
#東欧キットこころの悩み相談センター
ASU-57 1/35 AER MOLDOVA
T-20 Komsomolets 1/35 AER MOLDOVA
T-40 1/35 START
T-50 1/35 Techmod
すべて2008年撮影
屋根裏に放ってありますが出来自体がアレなのでレストアしようか放棄しようか迷い中www


9
146
1,180

Flight mode is a lie unless the hardware matches the software. If my phone isn't generating 5,000 lbs of thrust, I’m not turning the toggle on. Absolute trust issues with my OS.
#AirplaneMode #TechMod #Aviation

ALT Multi-panel meme: A phone is modded with carbon-fiber wings and a jet turbine. Text: "Actually installing a JET Turbine so your phone doesn't lie."
34

Apr 30
$CNO Q1 2026 earnings: Sales Engine Hums, But GAAP Earnings Remain Noisy
CNO Financial continues to execute well on its core strategy, delivering its 15th consecutive quarter of sales growth with Total New Annualized Premiums (NAP) rising 11% YoY. Operating metrics were excellent: Net Operating Income grew 25% YoY to $101.3M, and Operating EPS surged 33% to $1.05. However, the bottom line tells a different story. GAAP Net Income was just $37.7M, suppressed by $42.4M in unfavorable market risk benefit changes, $15.2M in investment losses, and a new $13.7M charge for the 'TechMod' initiative. Management continues aggressive capital returns with $60M in Q1 share repurchases, but investors must look past the heavy GAAP noise and planned tech spending to see the underlying profitability.
Full article with charts - link in bio
🐂 𝗕𝘂𝗹𝗹 𝗖𝗮𝘀𝗲
𝗨𝗻𝘀𝘁𝗼𝗽𝗽𝗮𝗯𝗹𝗲 𝗦𝗮𝗹𝗲𝘀 𝗠𝗼𝗺𝗲𝗻𝘁𝘂𝗺: The company marked 15 straight quarters of sales growth. Total NAP is accelerating ( 11% YoY), driven by a massive 52.5% YoY surge in Medicare Supplement premiums as CNO capitalizes on competitor weakness in Medicare Advantage.
𝗘𝘅𝗽𝗮𝗻𝗱𝗶𝗻𝗴 𝗜𝗻𝘃𝗲𝘀𝘁𝗺𝗲𝗻𝘁 𝗬𝗶𝗲𝗹𝗱𝘀: With new money rates consistently exceeding 6%, CNO's unallocated investment income grew 10% YoY, directly feeding the 33% surge in Operating EPS.
🐻 𝗕𝗲𝗮𝗿 𝗖𝗮𝘀𝗲
𝗧𝗲𝗰𝗵 𝗦𝗽𝗲𝗻𝗱 𝗗𝗿𝗮𝗴𝗴𝗶𝗻𝗴 𝗖𝗮𝘀𝗵 𝗙𝗹𝗼𝘄: The 'TechMod' modernization initiative stripped $13.7M from earnings this quarter and is guided to consume $75M of free cash flow in FY26, severely dampening near-term cash generation.
𝗟𝗶𝗳𝗲 𝗠𝗮𝗿𝗴𝗶𝗻 𝗖𝗼𝗺𝗽𝗿𝗲𝘀𝘀𝗶𝗼𝗻: Despite management's positive narrative on sales, Life segment margin actually compressed to $65.8M (down from $68.2M a year ago), indicating rising benefit costs or acquisition friction.
⚖️ 𝗩𝗲𝗿𝗱𝗶𝗰𝘁
🟢 Bullish. The core engine—selling health and annuity products to the middle market—is highly functional and growing. The GAAP net income weakness is primarily non-economic timing noise, making the 33% operating EPS growth the truer measure of the company's health.
— • — • —
𝗧𝗵𝗲𝗺𝗲𝘀
New: 🟢🟢 𝗠𝗲𝗱𝗶𝗰𝗮𝗿𝗲 𝗦𝘂𝗽𝗽𝗹𝗲𝗺𝗲𝗻𝘁 𝗖𝗮𝗽𝘁𝘂𝗿𝗲𝘀 𝗔𝗱𝘃𝗮𝗻𝘁𝗮𝗴𝗲 𝗗𝗲𝗳𝗲𝗰𝘁𝗼𝗿𝘀
A major market shift is underway. As competitors face severe margin pressure and regulatory scrutiny in Medicare Advantage (MA), consumers are fleeing to Medicare Supplement (Med Supp). CNO is perfectly positioned to catch this wave: Med Supp NAP accelerated by an explosive 52.5% YoY to $18.3M in Q1. Because CNO manufactures Med Supp but only distributes MA, this mix shift is highly accretive to margins.
🟢 𝗖𝗼𝗻𝘀𝗶𝘀𝘁𝗲𝗻𝘁 𝗔𝗴𝗲𝗻𝘁 𝗙𝗼𝗿𝗰𝗲 𝗘𝘅𝗽𝗮𝗻𝘀𝗶𝗼𝗻
Distribution remains CNO's primary moat. The company delivered its 13th consecutive quarter of producing agent growth in the Consumer division and its 15th in the Worksite division. More boots on the ground directly translates to premium growth in the underserved middle-income demographic.
🟢 𝗜𝗻𝘃𝗲𝘀𝘁𝗺𝗲𝗻𝘁 𝗬𝗶𝗲𝗹𝗱𝘀 𝗣𝗮𝗱𝗱𝗶𝗻𝗴 𝘁𝗵𝗲 𝗕𝗼𝘁𝘁𝗼𝗺 𝗟𝗶𝗻𝗲
CNO's investment portfolio continues to benefit from a higher-for-longer rate environment. General account net investment income grew 5.3% YoY to $395.0M. Management previously noted that new money rates have exceeded 6% for over 12 consecutive quarters, providing a stable, compounding tailwind for operating margins.
New: ⚪ 𝗟𝗶𝗳𝗲 𝗠𝗮𝗿𝗴𝗶𝗻 𝗖𝗼𝗺𝗽𝗿𝗲𝘀𝘀𝗶𝗼𝗻 𝗖𝗼𝗻𝘁𝗿𝗮𝗱𝗶𝗰𝘁𝘀 𝗚𝗿𝗼𝘄𝘁𝗵 𝗡𝗮𝗿𝗿𝗮𝘁𝗶𝘃𝗲
While management frequently highlights record sales momentum across the board, the Life segment tells a different story on the bottom line. Despite stable Insurance Policy Income in the segment ($232.7M vs $228.9M YoY), the Life margin actually decelerated, falling from $68.2M in 25Q1 to $65.8M in 26Q1. This drop indicates either rising mortality claims or elevated acquisition costs that are outpacing premium growth.
New: ⚪ 𝗧𝗲𝗰𝗵𝗠𝗼𝗱 𝗜𝗻𝗶𝘁𝗶𝗮𝘁𝗶𝘃𝗲 𝗪𝗲𝗶𝗴𝗵𝗶𝗻𝗴 𝗼𝗻 𝗙𝗿𝗲𝗲 𝗖𝗮𝘀𝗵 𝗙𝗹𝗼𝘄
CNO recorded a $13.7M non-operating expense for its 'TechMod' initiative this quarter. This three-year project, designed to modernize legacy systems, is guided to consume $75M in 2026. While necessary for long-term efficiency, it will materially depress near-term free cash flow and limit excess capital for buybacks.
🔴 𝗠𝗮𝗰𝗿𝗼𝗲𝗰𝗼𝗻𝗼𝗺𝗶𝗰 𝗨𝗻𝗰𝗲𝗿𝘁𝗮𝗶𝗻𝘁𝘆 𝗥𝗶𝘀𝗸
Management has repeatedly flagged a 'significant lack of visibility' in the macroeconomic environment. While rising unemployment might aid in agent recruiting, it poses a direct threat to discretionary purchases like traditional life insurance and fixed annuities, which are critical to CNO's growth strategy.
New: 🔴 𝗖𝗿𝗲𝗱𝗶𝘁 𝗟𝗼𝘀𝘀 𝗔𝗹𝗹𝗼𝘄𝗮𝗻𝗰𝗲 𝗧𝗶𝗰𝗸𝗶𝗻𝗴 𝗨𝗽
Net realized investment losses increased to $15.2M in Q1 (from $13.2M a year ago). Critically, $9.4M of this was driven by an unfavorable change in the allowance for credit losses. While small relative to the $26B portfolio, any deterioration in credit quality within their commercial mortgage or structured securities portfolios warrants close monitoring.
— • — • —
𝗢𝘁𝗵𝗲𝗿 𝗞𝗣𝗜𝘀
𝗧𝗼𝘁𝗮𝗹 𝗡𝗲𝘄 𝗔𝗻𝗻𝘂𝗮𝗹𝗶𝘇𝗲𝗱 𝗣𝗿𝗲𝗺𝗶𝘂𝗺𝘀 (𝗡𝗔𝗣): $𝟭𝟭𝟳.𝟰 𝗺𝗶𝗹𝗹𝗶𝗼𝗻
Accelerating. Up 11% YoY from $105.7M in 25Q1. Health products drove the bulk of the growth ( 17.5%), proving that the company's core distribution engine remains highly effective despite macro uncertainty.
𝗦𝗵𝗮𝗿𝗲 𝗥𝗲𝗽𝘂𝗿𝗰𝗵𝗮𝘀𝗲𝘀: $𝟲𝟬.𝟬 𝗺𝗶𝗹𝗹𝗶𝗼𝗻
Stable. The company repurchased 1.4 million shares at an average cost of $41.79. While down from the aggressive $100M pace seen in early 2025, it represents a continued commitment to returning capital. $360.4M remains on the authorization.
𝗖𝗼𝗻𝘀𝗼𝗹𝗶𝗱𝗮𝘁𝗲𝗱 𝗦𝘁𝗮𝘁𝘂𝘁𝗼𝗿𝘆 𝗥𝗶𝘀𝗸-𝗕𝗮𝘀𝗲𝗱 𝗖𝗮𝗽𝗶𝘁𝗮𝗹 (𝗥𝗕𝗖): 𝟯𝟳𝟱%
Stable. Sits comfortably within management's target range. Despite the heavy GAAP accounting noise and tech investments, the regulatory capital position remains a fortress, ensuring dividend safety.
— • — • —
𝗚𝘂𝗶𝗱𝗮𝗻𝗰𝗲
𝗙𝗬𝟮𝟲 𝗢𝗽𝗲𝗿𝗮𝘁𝗶𝗻𝗴 𝗘𝗣𝗦: $𝟰.𝟮𝟱 - $𝟰.𝟰𝟱
Decelerating. Based on prior call transcripts, management guided for this range. However, the midpoint of $4.35 implies a slight deceleration (-1%) compared to the actual reported FY25 Operating EPS of $4.40. Investors should clarify if this assumes elevated mortality or just conservative forecasting.
𝗙𝗬𝟮𝟲 𝗙𝗿𝗲𝗲 𝗖𝗮𝘀𝗵 𝗙𝗹𝗼𝘄: $𝟮𝟬𝟬𝗠 - $𝟮𝟱𝟬𝗠
Decelerating. This figure is heavily burdened by the planned $75M expenditure for the TechMod initiative. Excluding this one-time tech spend, underlying cash generation would be significantly higher.
𝗙𝗬𝟮𝟲 𝗘𝘅𝗽𝗲𝗻𝘀𝗲 𝗥𝗮𝘁𝗶𝗼: 𝟭𝟴.𝟴% - 𝟭𝟵.𝟮%
Stable. Aligns tightly with the company's historical performance, showing that underlying operating leverage remains intact despite inflationary pressures.
— • — • —
𝗞𝗲𝘆 𝗤𝘂𝗲𝘀𝘁𝗶𝗼𝗻𝘀
𝗟𝗶𝗳𝗲 𝗠𝗮𝗿𝗴𝗶𝗻 𝗖𝗼𝗺𝗽𝗿𝗲𝘀𝘀𝗶𝗼𝗻
Life segment margin declined YoY despite top-line sales growth. What drove this compression—was it elevated mortality, higher acquisition costs, or product mix? When should we expect operating leverage to return to this segment?
𝗧𝗲𝗰𝗵𝗠𝗼𝗱 𝗥𝗢𝗜 𝗮𝗻𝗱 𝗧𝗶𝗺𝗲𝗹𝗶𝗻𝗲
With TechMod taking a $13.7M bite out of Q1 earnings and expected to consume $75M of FCF this year, what specific efficiency metrics (e.g., lower expense ratio, faster policy issuance) will this unlock, and when will the ROI materialize?
𝗕𝗲𝗿𝗺𝘂𝗱𝗮 𝗥𝗲𝗶𝗻𝘀𝘂𝗿𝗮𝗻𝗰𝗲 𝗖𝗮𝗱𝗲𝗻𝗰𝗲
In 2025, you executed multiple capital-freeing reinsurance treaties with your Bermuda affiliate. Does the 2026 guidance assume any further transactions, or is there an opportunity for an upside surprise to excess capital generation later this year?
1
1
303

Apr 12
Goy finds out that this is a techmod chud's early game, and shit only gets more ridiculous from there
1
1
36
2,295

Mar 1
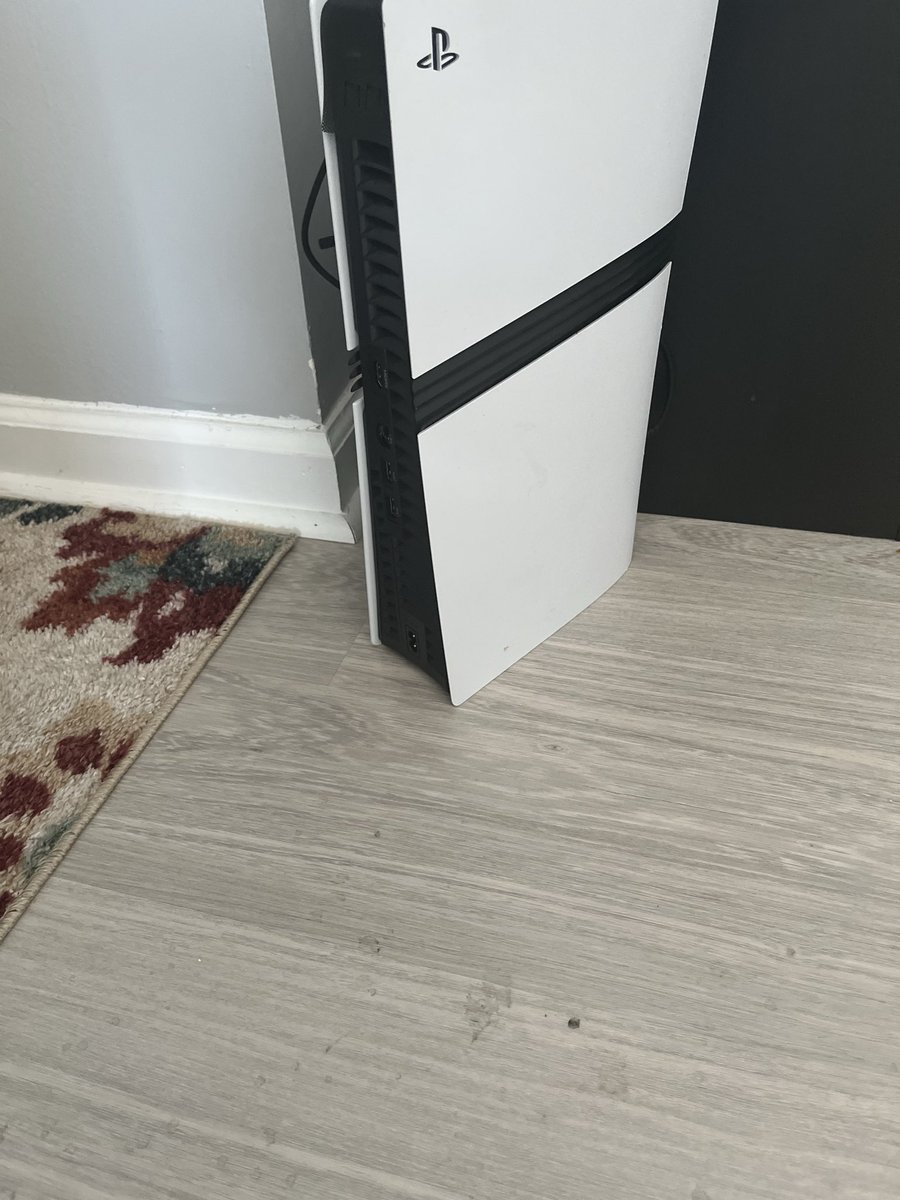
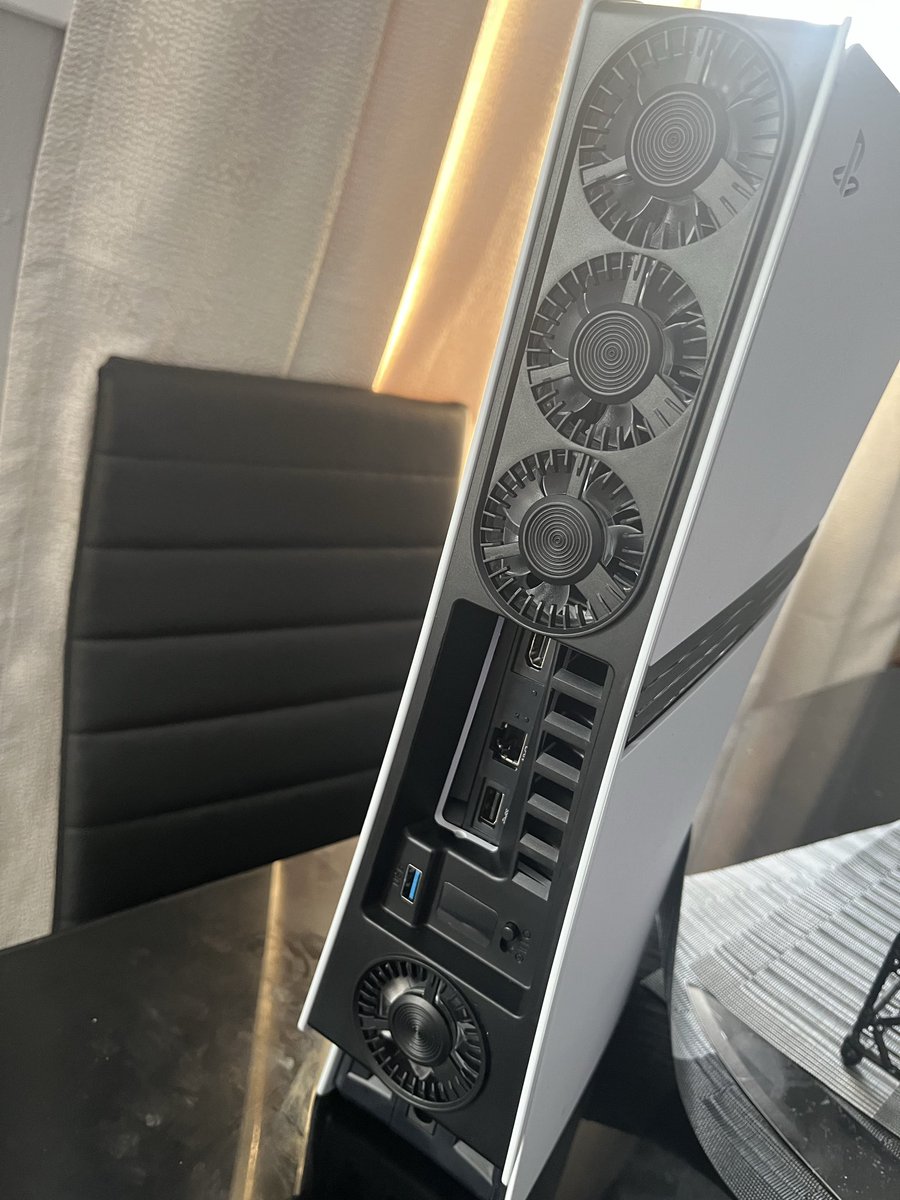
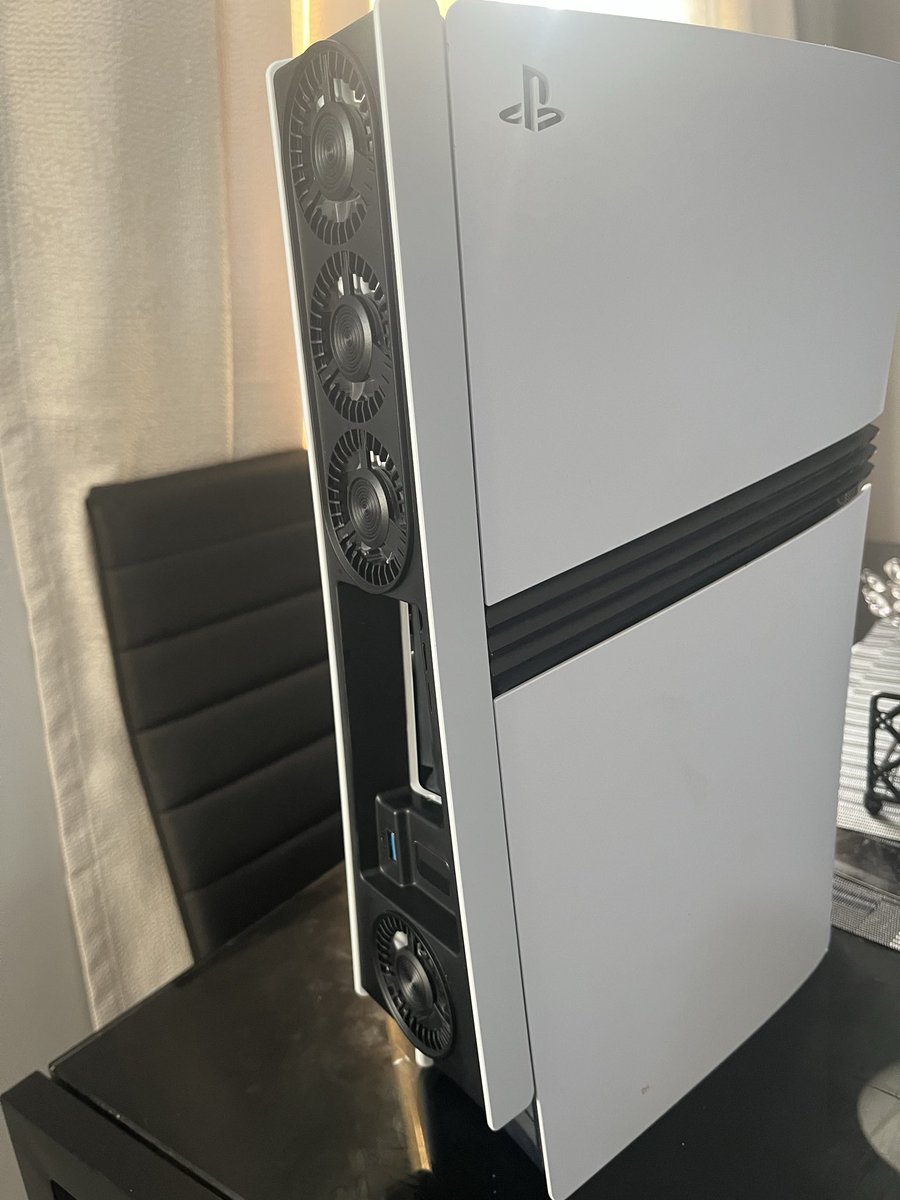
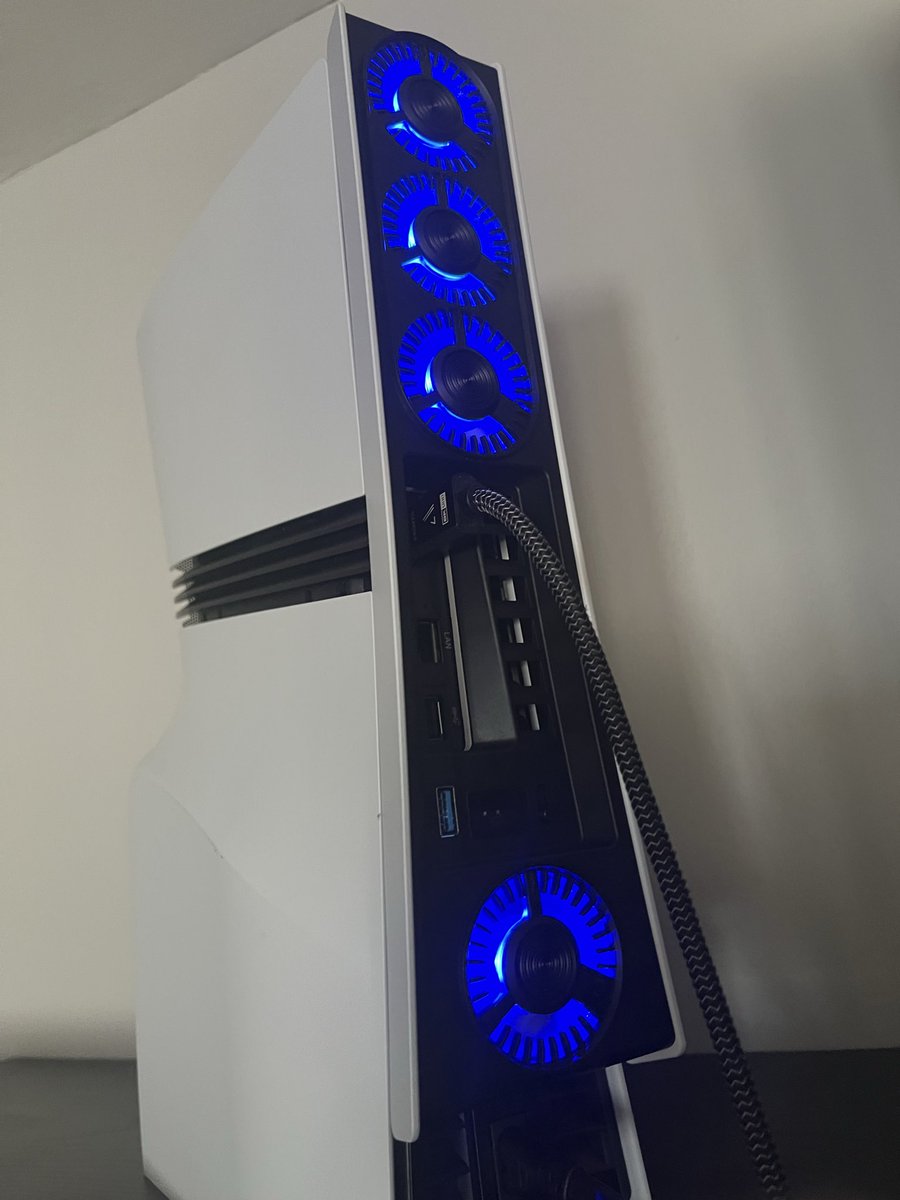
"Check out my beast-mode @PlayStation PS5 Pro setup! 🔥 High-powered external fan pulling heat straight out the vents—extra thermal headroom to keep things cool and stable under max loads. Ready for more power! @cerny @hermenhulst @PlayStationUK @sony
Mark Cerny, Hermen Hulst, and the legendary team: the PS5 Pro is crushing it already—PSSR 2 delivering sharp 4K visuals, 60fps (up to 120fps modes), killer ray tracing, and buttery performance. Devs like Gaijin Entertainment (War Thunder) even said it can technically handle path tracing with a highly optimized approach... we know full path tracing could be tricky performance-wise, but with multiframe techniques (temporal accumulation, denoising over multiple frames, etc.) a lot more becomes possible as the next step! Imagine unlocking that ultimate lighting realism for even more immersive worlds—who's ready to push those limits further? 💪 Let's make the Pro evolve! 👉🏿“Push!! Clocks!! Sony👈🏽
Drop your takes below—cooling mods, fave PSSR games to come, or path-tracing dreams!
#PS5Pro #PlayStation5Pro #PS5Pro #MarkCerny #PlayStation #Gaming #CustomCooling #NextGenGaming #Sony #PSSR #RayTracing #PathTracing #ConsoleGaming #GamerSetup #PS5 #GamingCommunity #TechMod #HighPerformance #FanMod #PlayStationFans #4K60fps #ConsoleMods #WarThunder #Warhammer40k #GamingSetup #Multiframe #TemporalUpscaling
@Naughty_Dog @insomniacgames @SonySantaMonica @SuckerPunchProd @Guerrilla @Bungie @BendStudio @mediamolecule @Housemarque @thegranturismo @Sony_XDEV
@SaberGames @fatsharkgames @CAGames @warhammer
@RockstarGames
206


Feb 6
RØDE Wireless PRO mic: Omnidirectional condenser captures supersonic bullet crack (150 dB N-wave, 2-8kHz transient) without clipping via 32-bit float dynamic range. ARM chipset SMPTE timecode syncs ms-precision delay (e.g., 200ms for sound propagation).
Mod as trigger: Detects impulse → delays detonation → thump blends with crack as "echo," muddying spectrogram analysis (60% ambiguity in noise per NIJ sims). Consumer tech as covert IED?
#AudioForensics #Acoustics #TechMod #IED
2
5
76
2,375

Jan 23
🔧 Tech Magic: China’s Huaqiangbei adds SIM slot to iPhone Air — a world first!
Videos are flooding the web showing modified iPhone Air units with a physical SIM card slot — engineered in Shenzhen’s legendary electronics market.
🛠️ How they did it:
Custom-molded mainboard with SIM area (using iPhone 15 Pro Max tray)
Replaced Taptic Engine to free up space
Works even on US models
A bold hardware hack that brings back the SIM card to Apple’s eSIM-only design. Would you mod your iPhone? 📱
#Huaqiangbei #iPhoneAir #SIMCard #HardwareHack #Apple #TechMod #ChinaTech
69

Jan 19
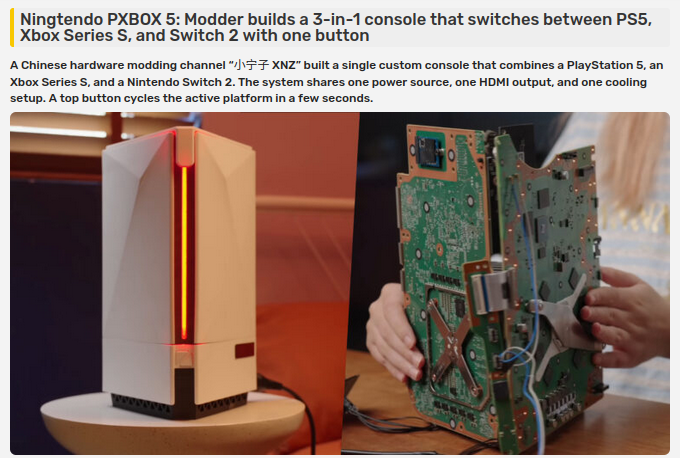
🎮 Akhir Perang Konsol: PS5, Xbox, Dan Switch Jadi Satu!
Modder asal China baru aja bikin eksperimen gila yang nyatuin mesin PS5 Slim, Xbox Series S, sampe Switch ke dalem satu casing custom. Semuanya fungsional dan siap tempur buat mainin semua game lintas platform tanpa ribet.
Mesin "3-in-1" ini dibekali sistem pendingin khusus biar suhu tetep adem meski jeroannya super padet. Gak ada lagi drama meja TV berantakan penuh kabel karena satu box ini udah handle semua kebutuhan gaming sekaligus.
Gila sih, kalo benda ini diproduksi massal, perdebatan fansboy konsol di sosmed otomatis langsung bubar jalan karena semuanya damai dalam satu mesin.
#GamingNews #ConsoleWars #TechMod
67

Jan 17
Let's Live Play: Minecraft - #024 | Sag mal beißt die Kiste hier
youtu.be/7fUXEayxDZ0
#appliedenergistics #storage #techmod #systemsetup

4
192

20 Dec 2025
#年末年始積みプラ崩そう祭2025
#経過
ズベズダのユンカースJu87B-2スツーカ。
Q.しばらく音沙汰なしだったけど今どうなってるの?
A.塗装が完了してマーキングが済んだところなのだ
鉤十字は付属しないので別売りのテックモッド(Techmod)製。
指定では小さめの3番だけど、1段大きい4番のを使用。


3
84
598


26 Nov 2025
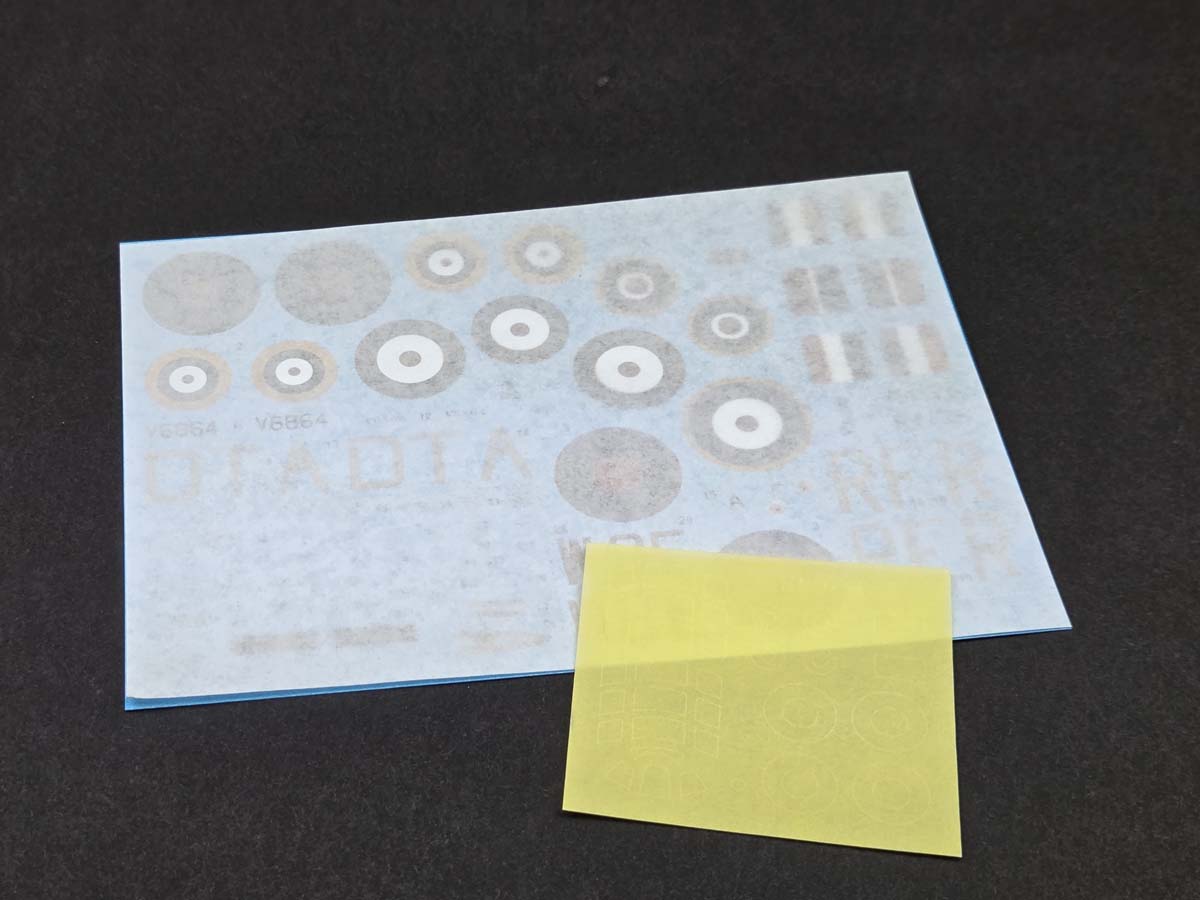
A first look at the decals for our upcoming Hurricane Mk I 1/48!
Printed by Techmod — sharp, clean and exactly how we wanted them ✈️🔥
Just a small taste of what’s waiting in the box.
#ArmaHobby #Hurricane #ModelKits #ScaleModeling #148scale #Techmod


1
12
249

9 Nov 2025
The Anvil Legendary Tech Mod goes hard af in Buried City.
Sadly another team third partied my 1v3. And I nearly killed two of the other team as well with the mod.
youtu.be/MEArOypxQtI
#ArcRaiders #pvp #anvil #techmod

2
102

7 Nov 2025
Sims has quite a comprehensive tutorial, at least, Sims 2000 did.
To be fair, I techmod minecraft to the point of basically needing a scientific degree, so I have little room to talk.
1
4
255


6 Oct 2025
create might be the greatest minecraft techmod of all time, it's like the game's equivalent of calamity or antibirth
5 Oct 2025

create mfs working their ass off just to make a machine that generates 2 iron nuggets everytime somebody takes a shit:
1
4
284


17 Sep 2025
gAntix Techmod
$ANTIX isn’t just another token. It’s the backbone of digital identity, powering payments, products, and community growth.
1
10