
استعرضت V-COLOR خلال #COMPUTEX2026 ذواكر DDR5 جديدة مزودة بشاشة جانبية تعرض التردد ودرجة الحرارة وسعة الذاكرة وحالة XMP/EXPO بشكل مباشر، إلى جانب تكوينات تصل إلى 512 جيجابايت لمحطات العمل والمستخدمين المحترفين. #VColor #DDR5 #ArabOverclockers
youtube.com/watch?v=NFnCzHEK…
31
妙蓮寺 retweeted

29 Jun 2024
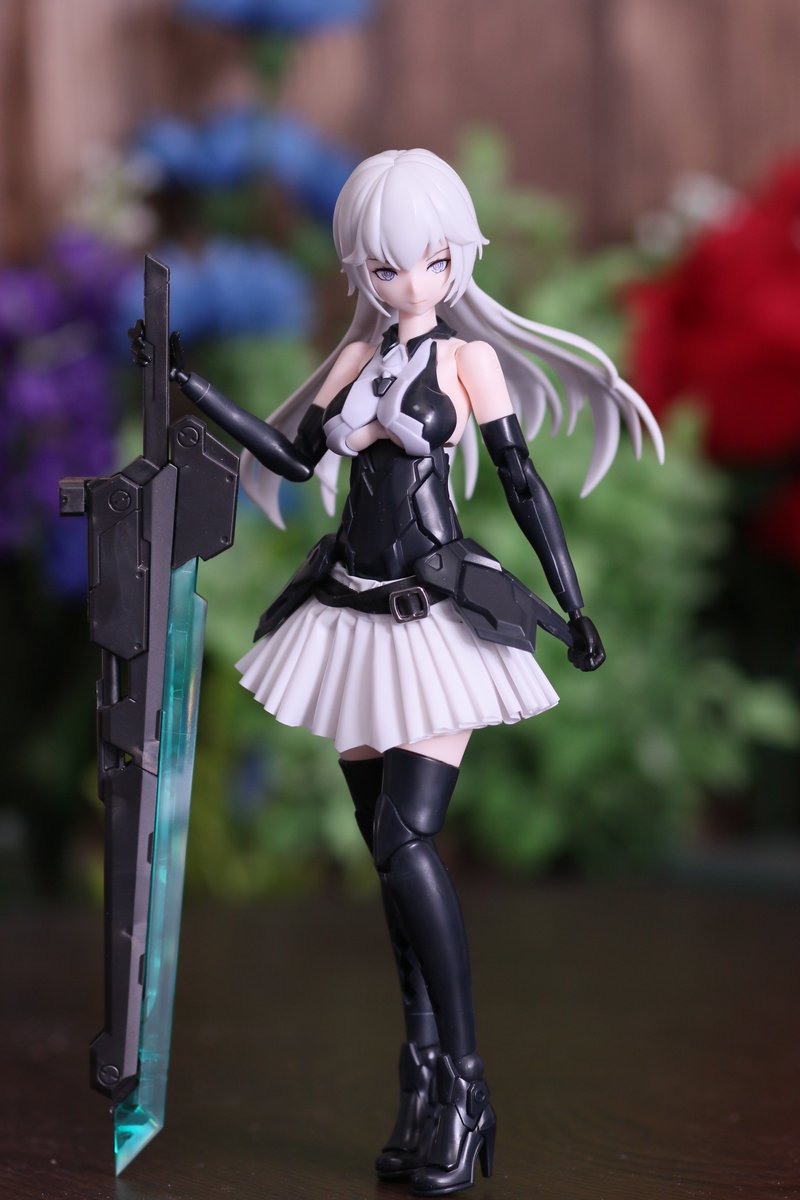
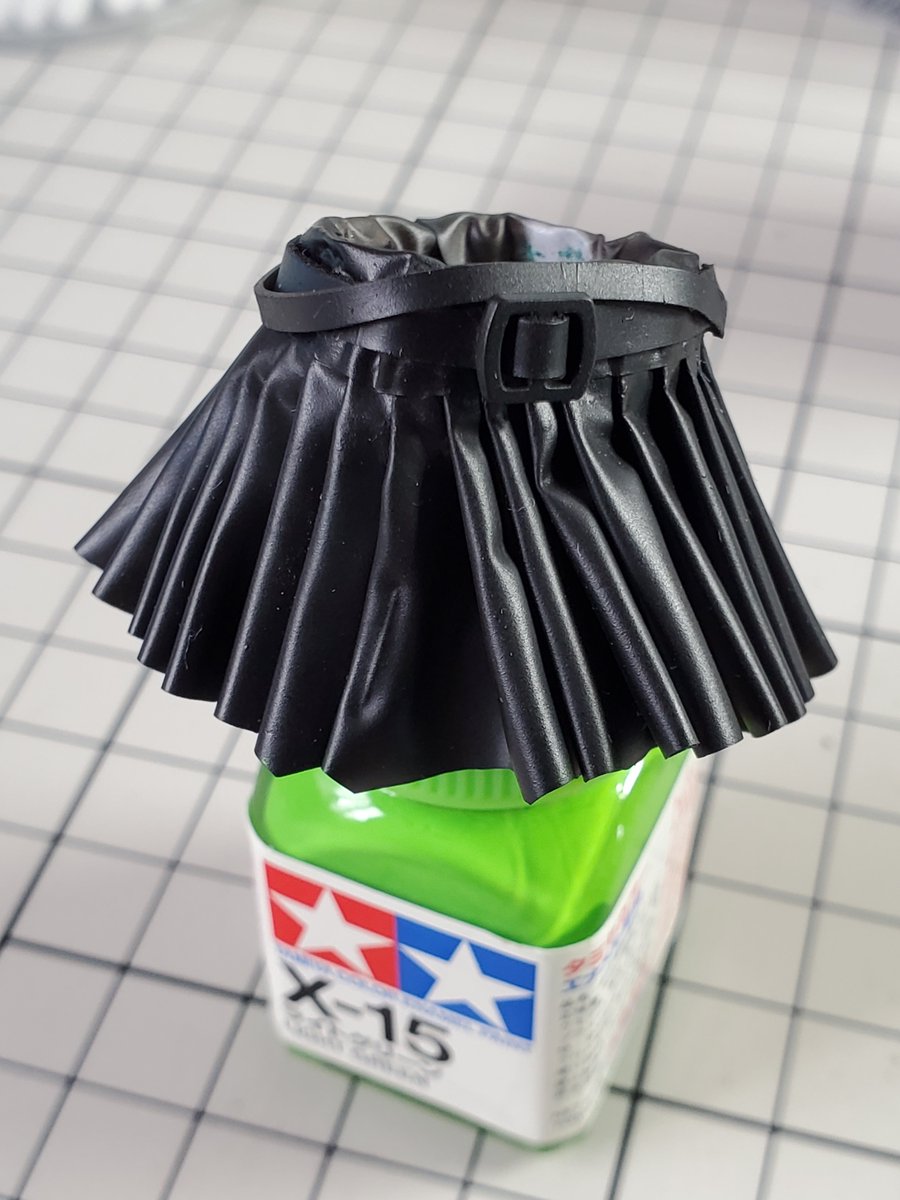
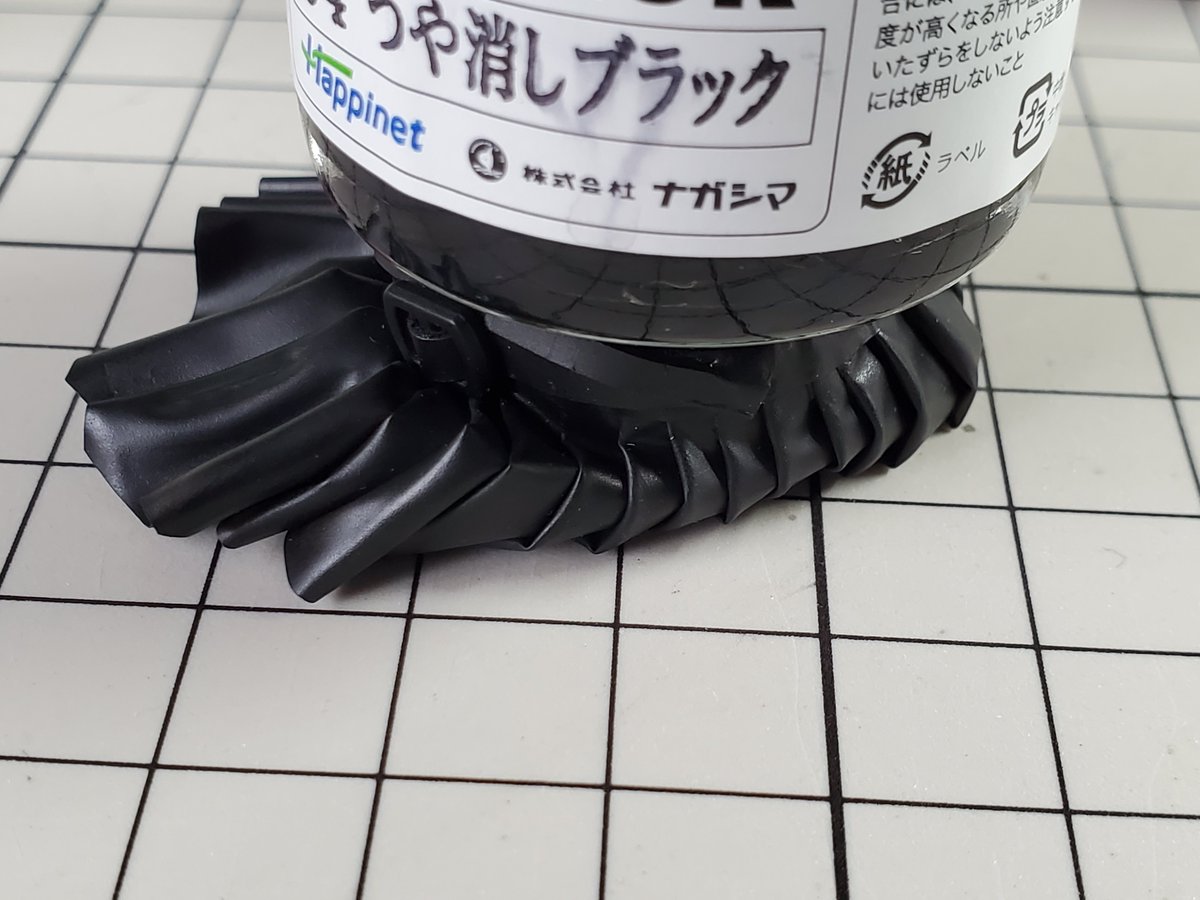
配管テープスカートを黒に塗装。
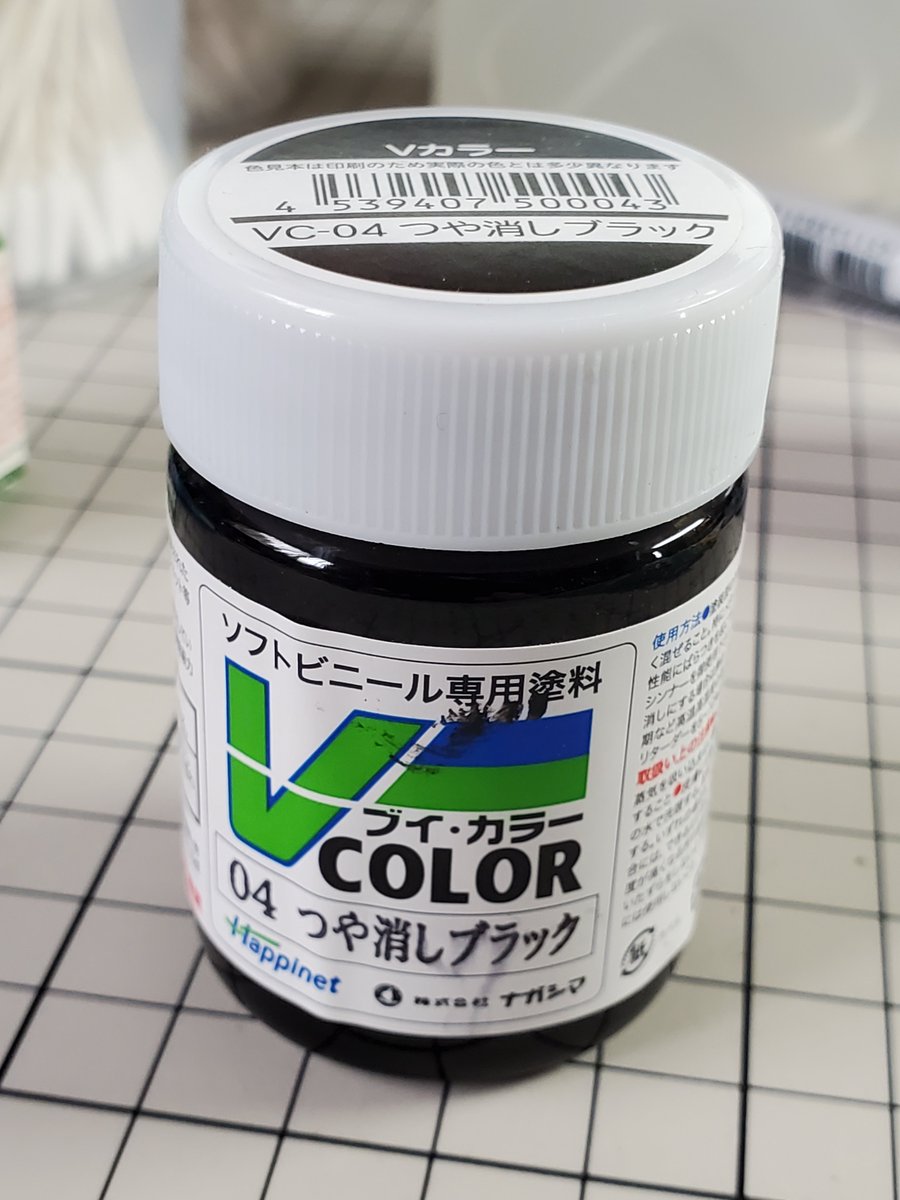
使用したのは、みんな大好きVCOLOR🎨
サフもプライマーもいらない、専用の溶剤で薄めて塗るだけ!
折れ曲げに強い💪
引っ掻いても剥げない。
潰してもヘッチャラさ!
5
123
610
30,761

Jun 6
OLED Ekranlı RAM - V-Color Xfinity OLED Manta | COMPUTEX 2026 #32 #işbirliği #computex2026 #computex #vcolor #manta #ram
1
6
1,152

V-Color brought RGB RAM to Computex 2026 and our builds are already jealous. 💾🔥 This is the memory upgrade you didn't know you needed.
#VColor #Computex2026 #PCGaming #RGBMemory #NewRelease #Computex
1
2
7
4,461

May 28
すごいぶっちゃけた話、メモリはもうCorsairとvcolor以外は使ってない
オブジェ
会社のPCはクルーシャルが結構入ってるけど
10
690

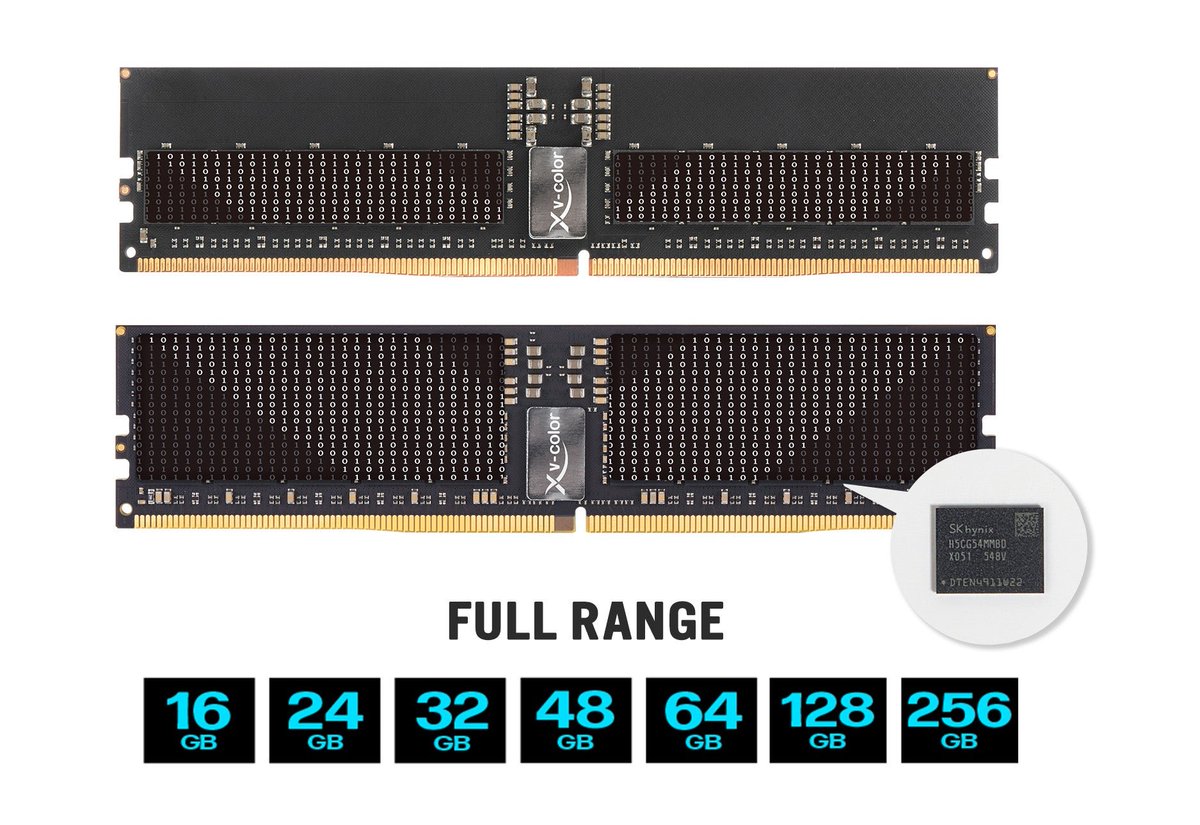
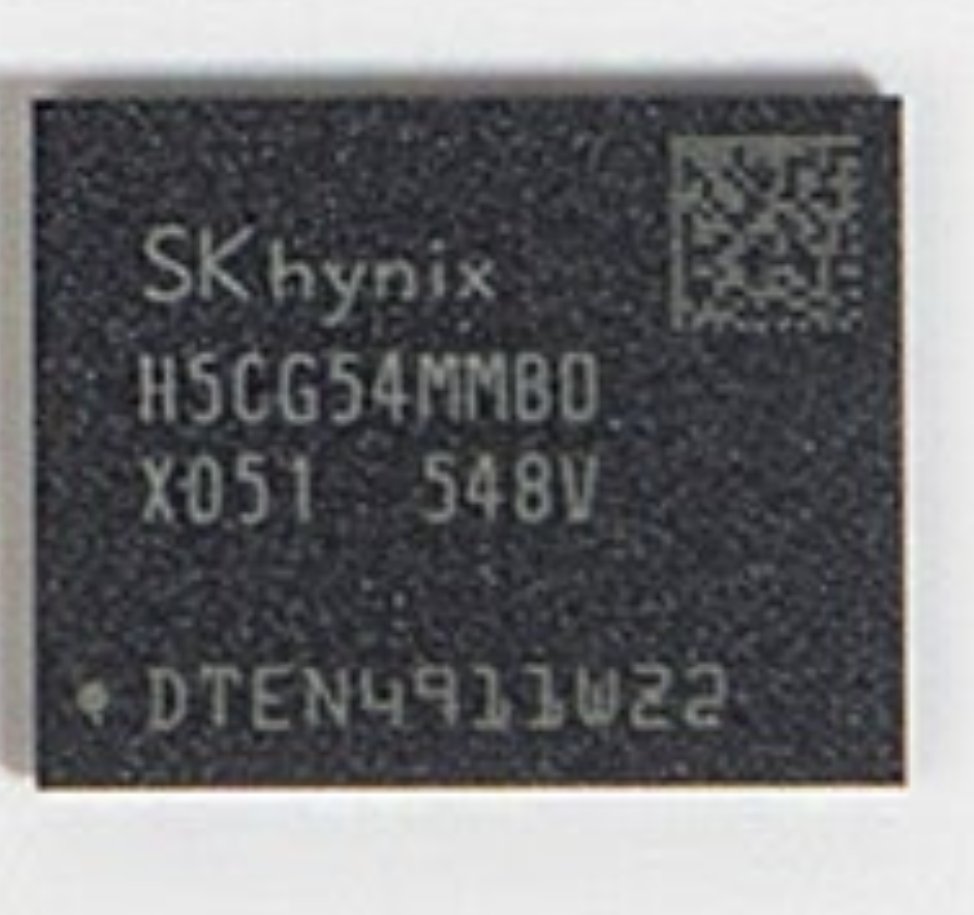
hynix 8000 native d5 die?
h5cg54mmbdx051
m=m die
mb=8000
x051=4GB
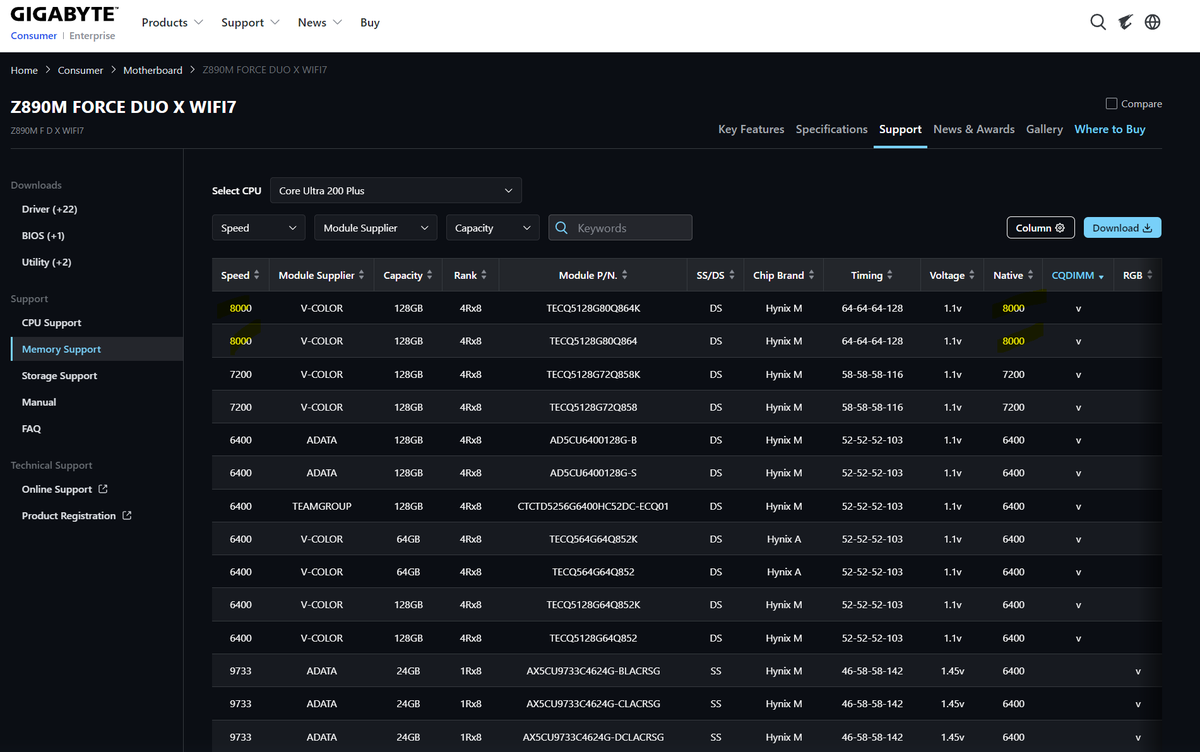
the first time i saw vcolor's 8000 1.1v dies of hynix was on gigabyte z890 duo x qvl as cqdimm.
now vcolor also makes rdimm with this die.
from 2021 to 2026, hynix d5 dies
eb=4800
gb=5600
hb=6400
kb=7200
mb=8000
we haven't seen the kb dies being used widely on the diy market yet, I guess ai is the one to thank.
vcolor press release
v-color.net/zh/blogs/�%…

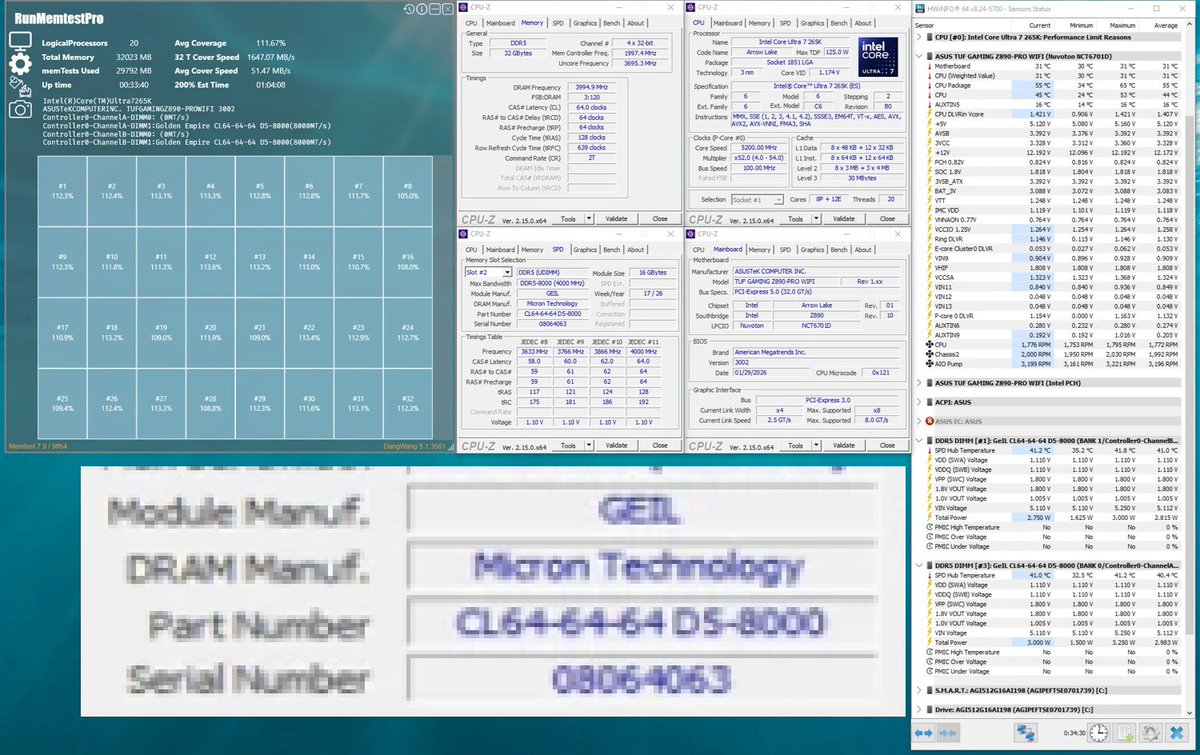
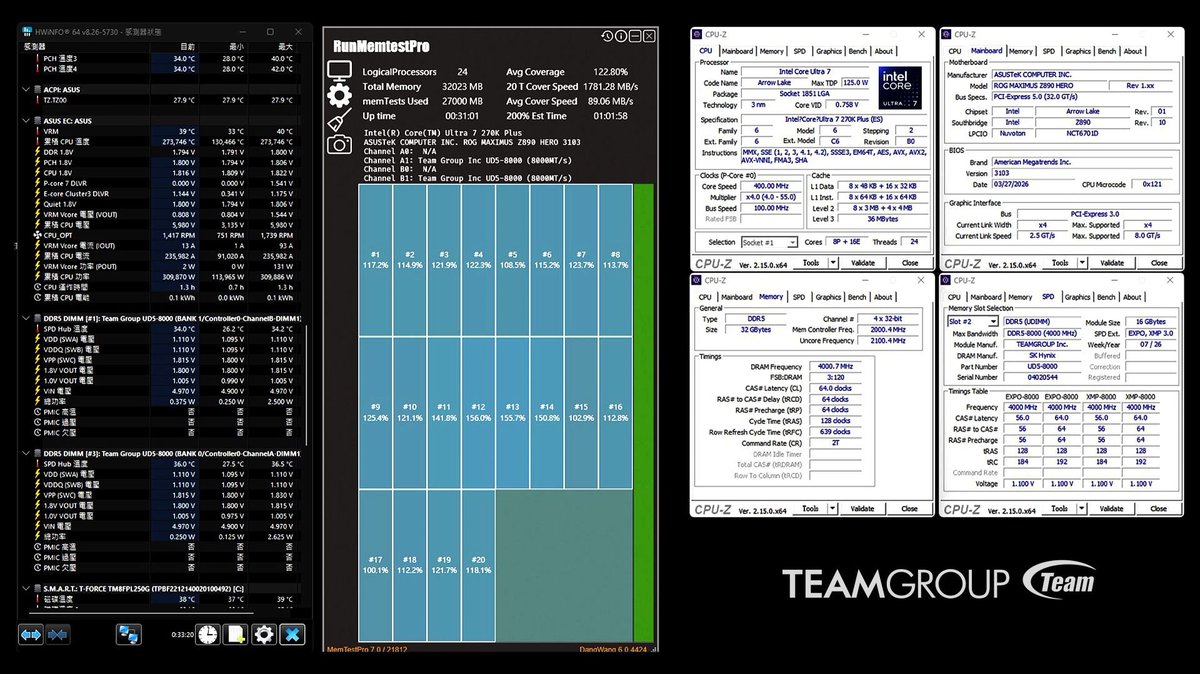
geil has also launched ddr5 8000 at 1.1v
there are a few differences between the geil's 8000 1.1v and the teamgroup's 8000 1.1v, according to the press releases
- geil used micron dies, teamgroup used hynix dies
- geil used jedec profile as 8000 and no expo/xmp profiles builtin, teamgroup used expo/xmp as 8000
in 2021, jedec d5 on z690 was 4800 1.1v
it is good to see all vendors working hard to further push the jedec standard.
geil press release
unikoshardware.com/2026/05/g…
teamgroup press release
teamgroupinc.com/en/news-det…


3
5
21
3,348

May 9
//@version=6
indicator("Reuters Eikon - Kurumsal PROFESYONEL 9.3", overlay=true, max_bars_back=1000, max_lines_count=500, max_labels_count=500)
// ==========================================
// 1. ALPHATREND (Kıvanç Özbilgiç Standart Hesaplama)
// ==========================================
grp_alpha = "AlphaTrend Ayarları"
coeff = input.float(1.0, "Çarpan", step=0.1, group=grp_alpha)
ap = input.int(14, "Periyot", group=grp_alpha)
novolumedata = input.bool(false, "Hacim Verisi Yok mu?", group=grp_alpha)
src = close
atr_val = ta.sma(ta.tr, ap)
upT = low - atr_val * coeff
downT = high atr_val * coeff
float AlphaTrend = 0.0
AlphaTrend := (novolumedata ? ta.rsi(src, ap) >= 50 : ta.mfi(hlc3, ap) >= 50) ? (upT < nz(AlphaTrend[1]) ? nz(AlphaTrend[1]) : upT) : (downT > nz(AlphaTrend[1]) ? nz(AlphaTrend[1]) : downT)
color1 = AlphaTrend > AlphaTrend[2] ? #00E60F : (AlphaTrend < AlphaTrend[2] ? #80000B : (AlphaTrend[1] > AlphaTrend[3] ? #00E60F : #80000B))
k1 = plot(AlphaTrend, color=color.new(#0022FC, 0), linewidth=3, title="AlphaTrend Ana")
k2 = plot(AlphaTrend[2], color=color.new(#FC0400, 0), linewidth=3, title="AlphaTrend Gecikmeli")
fill(k1, k2, color=color.new(color1, 80), title="AlphaTrend Bulutu")
buySignalk = ta.crossover(AlphaTrend, AlphaTrend[2])
sellSignalk = ta.crossunder(AlphaTrend, AlphaTrend[2])
K1 = ta.barssince(buySignalk)
K2 = ta.barssince(sellSignalk)
O1 = ta.barssince(buySignalk[1])
O2 = ta.barssince(sellSignalk[1])
plotshape(buySignalk and O1 > K2 ? AlphaTrend[2] : na, title="Buy", text="BUY", location=location.absolute, style=shape.labelup, size=size.tiny, color=color.new(#0022FC, 0), textcolor=color.white)
plotshape(sellSignalk and O2 > K1 ? AlphaTrend[2] : na, title="Sell", text="SELL", location=location.absolute, style=shape.labeldown, size=size.tiny, color=color.new(#80000B, 0), textcolor=color.white)
// ==========================================
// 2. TILLSON T3 (VFactor 0.7 Standardı)
// ==========================================
grp_t3 = "Tillson T3 Ayarları"
t3Len = input.int(8, "T3 Period", group=grp_t3)
vFact = input.float(0.7, "VFactor", group=grp_t3)
t3Calc(source, len, vf) =>
e1 = ta.ema(source, len)
e2 = ta.ema(e1, len)
e3 = ta.ema(e2, len)
e4 = ta.ema(e3, len)
e5 = ta.ema(e4, len)
e6 = ta.ema(e5, len)
c1 = -(vf * vf * vf)
c2 = 3 * (vf * vf) 3 * (vf * vf * vf)
c3 = -6 * (vf * vf) - 3 * vf - 3 * (vf * vf * vf)
c4 = 1 3 * vf (vf * vf * vf) 3 * (vf * vf)
c1 * e6 c2 * e5 c3 * e4 c4 * e3
t3 = t3Calc(close, t3Len, vFact)
bool t3_is_bull = t3 > nz(t3[1])
plot(t3, color=t3_is_bull ? #00FFFF : #FF9800, linewidth=2, title="Tillson T3")
// ==========================================
// 3. TRP (TD Sequential)
// ==========================================
var int buySetup = 0
var int sellSetup = 0
buySetup := close < nz(close[4]) ? buySetup 1 : 0
sellSetup := close > nz(close[4]) ? sellSetup 1 : 0
plotshape(buySetup == 9, title="TRP 9 Buy", text="9", style=shape.triangleup, location=location.belowbar, color=color.green, textcolor=color.green, size=size.tiny)
plotshape(sellSetup == 9, title="TRP 9 Sell", text="9", style=shape.triangledown, location=location.abovebar, color=color.red, textcolor=color.red, size=size.tiny)
// ==========================================
// 4. HACİM BAZLI RENKLİ BARLAR (VCB)
// ==========================================
grp_vol = "Hacim Ayarları"
avgl = input.int(21, "Hacim SMA Periyodu", minval=1, group=grp_vol)
v_sma = ta.sma(volume, avgl)
bool vold1 = volume > v_sma * 1.5 and close < open
bool vold2 = volume >= v_sma * 0.5 and volume <= v_sma * 1.5 and close < open
bool vold3 = volume < v_sma * 0.5 and close < open
bool volu1 = volume > v_sma * 1.5 and close > open
bool volu2 = volume >= v_sma * 0.5 and volume <= v_sma * 1.5 and close > open
bool volu3 = volume < v_sma * 0.5 and close > open
color vColor = vold1 ? #800000 : vold2 ? #FF0000 : vold3 ? color.orange : volu1 ? #006400 : volu2 ? color.lime : volu3 ? #7FFFD4 : na
barcolor(vColor)
// ==========================================
// 5. PİYASA YAPISI & YATAY FİLTRE
// ==========================================
[diplus, diminus, adx_val] = ta.dmi(14, 14)
float chop_val = 100 * math.log10(math.sum(ta.tr, 14) / (ta.highest(high, 14) - ta.lowest(low, 14))) / math.log10(14)
bool is_sideways = adx_val < 22 or chop_val > 61.8
float lowest_20 = ta.lowest(low[1], 20)
bool structure_broken = close < lowest_20
// ==========================================
// 6. DASHBOARD
// ==========================================
var table vt = table.new(position.bottom_right, 2, 6, frame_color=#2a2e39, frame_width=2, border_width=1, border_color=#2a2e39)
if barstate.islast or barstate.isrealtime
c_bg_dark = #131722, c_bg_light = #1e222d, c_bull = #00e676, c_bear = #ff5252, c_neutral = #787b86, s = size.small
table.cell(vt, 0, 0, "REUTERS", bgcolor=#000000, text_color=#ff9800, text_size=s, text_halign=text.align_left)
table.cell(vt, 1, 0, "V12 PRO", bgcolor=#000000, text_color=#ff9800, text_size=s, text_halign=text.align_right)
bool at_bull = AlphaTrend > AlphaTrend[2]
bool trend_bull = at_bull and t3_is_bull
bool trend_bear = not at_bull and not t3_is_bull
string trend_txt = trend_bull ? "GÜÇLÜ BOĞA ↗" : trend_bear ? "GÜÇLÜ AYI ↘" : "KARIŞIK ↔"
table.cell(vt, 0, 1, "Ana Trend", bgcolor=c_bg_dark, text_color=#64b5f6, text_size=s, text_halign=text.align_left)
table.cell(vt, 1, 1, trend_txt, bgcolor=c_bg_dark, text_color=trend_bull ? c_bull : trend_bear ? c_bear : c_neutral, text_size=s, text_halign=text.align_right)
string trp_txt = buySetup == 9 ? "GÜÇLÜ AL (9)" : sellSetup == 9 ? "GÜÇLÜ SAT (9)" : buySetup > 0 ? "Düşüş (" str.tostring(buySetup) ")" : sellSetup > 0 ? "Yükseliş (" str.tostring(sellSetup) ")" : "NÖTR"
table.cell(vt, 0, 2, "TD Kurulum", bgcolor=c_bg_light, text_color=#ffd600, text_size=s, text_halign=text.align_left)
table.cell(vt, 1, 2, trp_txt, bgcolor=c_bg_light, text_color=(buySetup == 9 or sellSetup > 0) ? c_bull : (sellSetup == 9 or buySetup > 0) ? c_bear : c_neutral, text_size=s, text_halign=text.align_right)
bool vol_active = volume > v_sma
table.cell(vt, 0, 3, "Hacim İvmesi", bgcolor=c_bg_dark, text_color=#00e5ff, text_size=s, text_halign=text.align_left)
table.cell(vt, 1, 3, vol_active ? "YÜKSEK ⚡" : "DÜŞÜK 💤", bgcolor=c_bg_dark, text_color=vol_active ? #ff9800 : c_neutral, text_size=s, text_halign=text.align_right)
table.cell(vt, 0, 4, "Piyasa Yapısı", bgcolor=c_bg_light, text_color=#ffffff, text_size=s, text_halign=text.align_left)
table.cell(vt, 1, 4, structure_broken ? "BOZULDU ⚠️" : "KORUNUYOR 🛡️", bgcolor=c_bg_light, text_color=structure_broken ? c_bear : c_bull, text_size=s, text_halign=text.align_right)
bool isGoldenBuy = trend_bull and vol_active and not structure_broken and not is_sideways
bool isGoldenSell = trend_bear and vol_active and structure_broken and not is_sideways
string final_sig = is_sideways ? "YATAY (İZLE)" : isGoldenBuy ? "GÜÇLÜ AL" : isGoldenSell ? "GÜÇLÜ SAT" : "BEKLE / NÖTR"
color final_col = is_sideways ? #313339 : isGoldenBuy ? c_bull : isGoldenSell ? c_bear : c_neutral
table.cell(vt, 0, 5, "NİHAİ KARAR", bgcolor=final_col, text_color=color.white, text_size=size.normal, text_halign=text.align_left)
table.cell(vt, 1, 5, final_sig, bgcolor=final_col, text_color=color.white, text_size=size.normal, text_halign=text.align_right)
// ==========================================
// 7. FİBONACCİ (DÜZELTİLDİ)
// ==========================================
grp_fib = "Fibonacci Ayarları"
showFib = input.bool(true, "Fib Seviyelerini Çiz", group=grp_fib)
fibLen = input.int(100, "Geriye Dönük Periyot", minval=10, group=grp_fib)
highPrice = ta.highest(high, fibLen)
lowPrice = ta.lowest(low, fibLen)
diff = highPrice - lowPrice
var line[] fibLines = array.new<line>()
var label[] fibLabels = array.new<label>()
if showFib and barstate.islast
// Eski çizimleri temizleme döngüsü düzeltildi
if array.size(fibLines) > 0
for i = 0 to array.size(fibLines) - 1
line.delete(array.get(fibLines, i))
array.clear(fibLines)
if array.size(fibLabels) > 0
for i = 0 to array.size(fibLabels) - 1
label.delete(array.get(fibLabels, i))
array.clear(fibLabels)
float[] levels = array.from(0.0, 0.236, 0.382, 0.5, 0.618, 0.786, 1.0)
color[] colors = array.from(color.red, color.gray, color.orange, color.green, color.orange, color.blue, color.red)
string[] names = array.from("1.0 (Zirve)", "0.236", "0.382", "0.5", "0.618", "0.786", "0.0 (Dip)")
for i = 0 to array.size(levels) - 1
float val = highPrice - (diff * array.get(levels, i))
color current_col = array.get(colors, i)
line n_line = line.new(bar_index - fibLen, val, bar_index 10, val, color=color.new(current_col, 30), width=1)
label n_lab = label.new(bar_index 10, val, array.get(names, i) " (" str.tostring(val, format.mintick) ")", style=label.style_label_left, textcolor=current_col, size=size.small)
array.push(fibLines, n_line)
array.push(fibLabels, n_lab)
2
2
2
1,268

Apr 11
AI を 選べ
Copilot に相談したら、間違った答えを延々垂れ流された。
Claude に聞いたら、一撃で正しい答えが出た。
今あなたが使っている AI が、正しい答えに辿り着くとは限らない。AI にも、得意・不得意がある。「あぁ、こいつ、良く分かっていないな」と感じたら、振り回される前に、別の AI を試してみよう。
BABYLON.js でゲーム開発中、thinInstance で「照明を無視した色・透明度を個別に指定する方法」が必要になった。Copilot に聞いたところ、「カスタムマテリアルを使い、シェーダーにフックをかける」という方針だけは知っていたが、間違った変数名やメソッド名、レンダリングパイプラインを理解していない間違ったフック箇所などを、あれこれ提案してきた。『これで上手く行くはずです、試してください』『今度は大丈夫です』と、アレコレ言ってくるが、実装しても効果が無かったりエラーが出たりするので、「あ、コイツ、分かっていないな」と見切りをつけた。
そこで、Claude に乗り換えたら、一撃で解決。たった2行かよ。鮮やか過ぎる!
mat.disableLighting = true;
mat.Fragment_Before_FragColor(`color = vColor;`);
Copilot は、『diffuseColor を上書きしましょう』(←いやいや、ライティング前の色を変えても意味ないでしょう?)『emissiveColor を指定しましょう』(←そんなフックポイントは無いのだが?)と、私の時間を使ってアレコレ試行錯誤させようとしてきた。一方、Claude は、BABYLON内部のGLSLの生コードを要求してきて、それを手渡したら内容を分析して、上記の2行を提案してきた。「レンダリングパイプラインの途中に割り込むのではなく、最終色を、決定する直前で(透明度を含む表示色で)上書きすればオーケー」という、極めて鮮やかな方法。
注意して頂きたいのは、「Copilot はダメ、Claude が良い」と言っているわけではない、ということ。今回の件については、たまたま知識を持っていて、たまたま解決策に上手く辿り着けたのが Claude だった、というだけのこと。問題が違えば、最適なAI も異なる。
普遍的な問題なら、どのAIでも直ぐに正解に辿り着けるだろうし、ネット上の公開情報が乏しい個別具体的な問題であれば、どのAI も正解に辿り着けないかも知れないし、その中間の問題なら、正解に辿り着けるAIは1つだけかも知れない。
人間でも AI でも、あなたを最適解に導いてくれるのは、あなたが頼っている、その人やそのAIでは無いかも知れない。一回しかない自分の人生の時間を無駄に溶かさないよう、「あ、この先に答えは無さそうだな」と気づいたら、サッと乗り換える身軽さを持とう。
7
195

Apr 9
4 RTX 6000 MAX-Q cards (96GB VRAM each), 768GB (8x96GB) - Vcolor DDR5 6400, and a threadripper 9985WX (I regret not getting the 9995). It’s actually absurd, since I bought everything in October I think it’s gone up total like.. $30,000? Maybe a little more?
2
12
1,138


2
422

Apr 2
the day vcolor ram goes down to 200 dollars is the day im splurging lowk
Apr 1

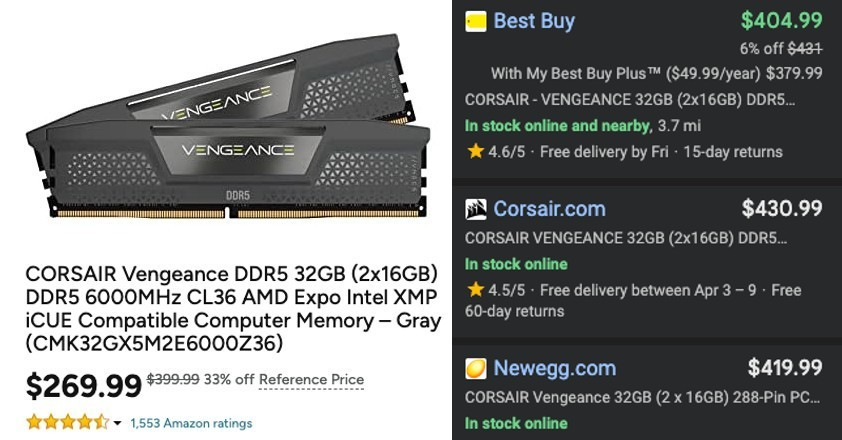
Are RAM prices finally crashing??
$269.99 for 32GB DDR5 6000MHz on Amazon Outlet Store
Currently $400 on Best Buy's and Corsair's website
That's a $130 decrease from other retailers' prices
go.pricingerrors.com/LzJZ1y #ad
3
170

Mar 26
hate these peoples wack ass graphics mods with pitch black harsh self shadowing and zero concept of how vcolor should be handled so basically every pedestrian has Void Eyes And Mouth because nobody cares how they look they only care if Street Shiny And Wet


2
96
two new things in the gigabyte's latest z890 qvl dated march 24, 2026.
- 8000mhz native 4gb dies (1.1v) from hynix
- 8000mhz cqdimm / 4r cudimm from vcolor
gigabyte z890m force wifi7 duo x
spotted two new dies of ddr5.
in short,
hynix 4gb dies now have both mdie and adie (second gen).
micron got native 8000 4gb dies (es).
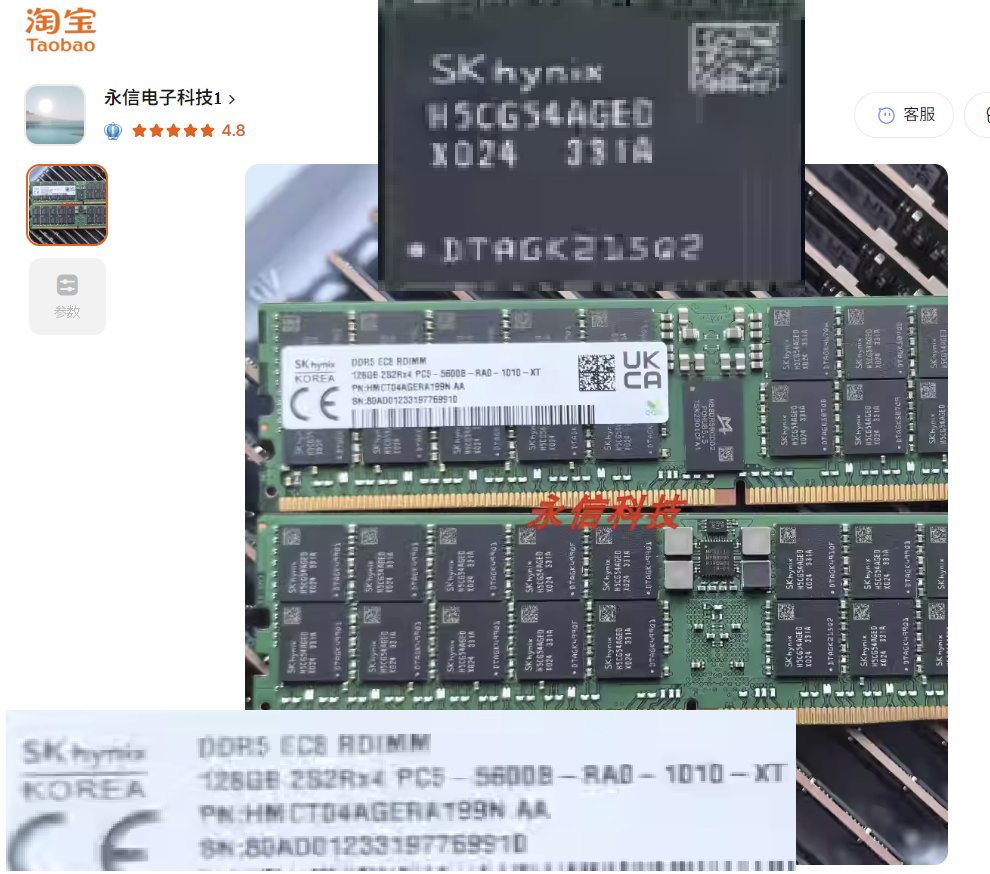
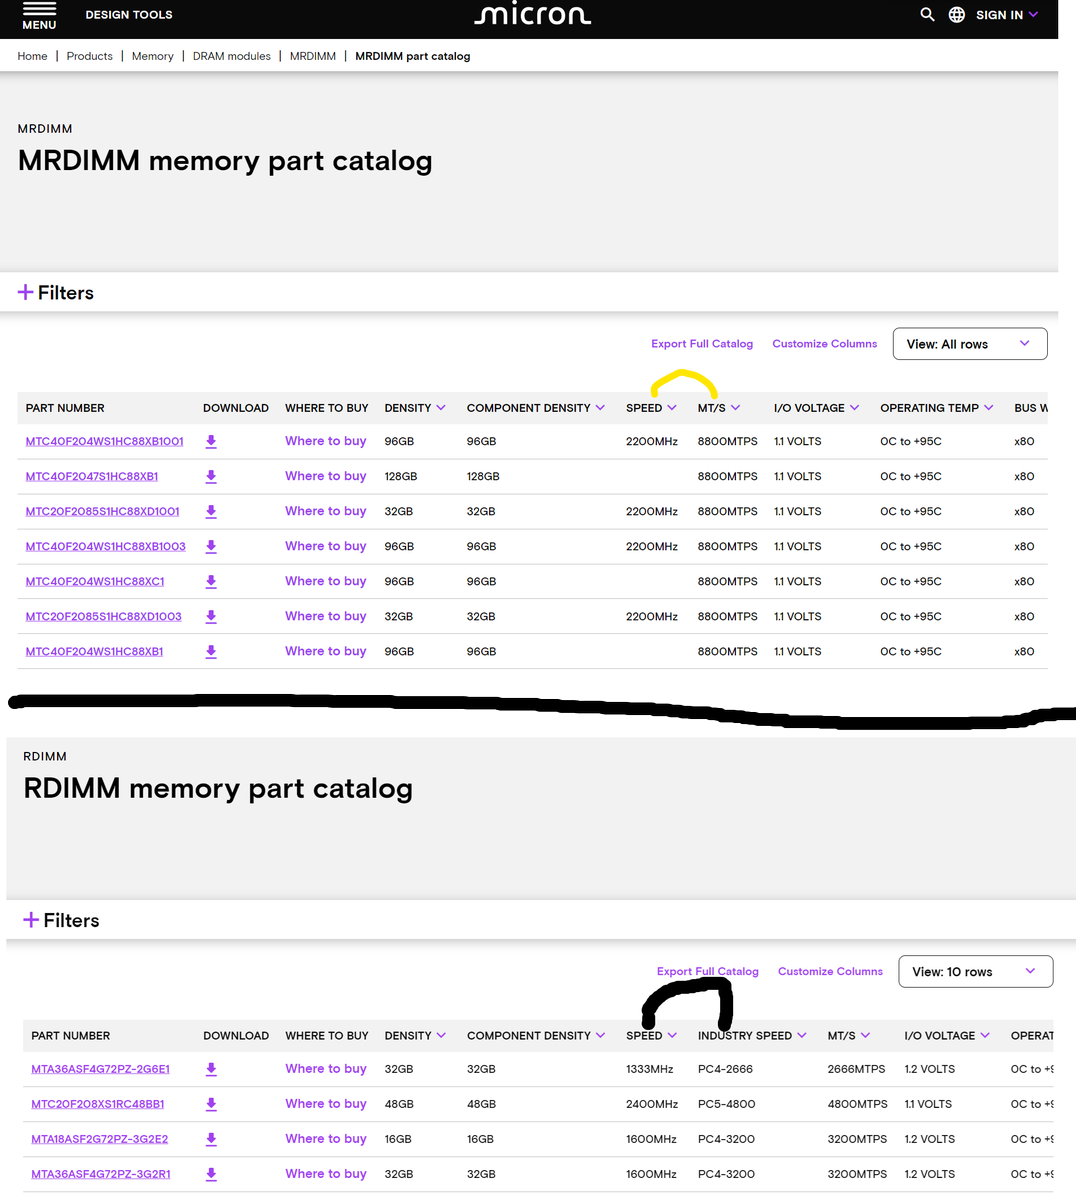
- skhynix 128gb ridmm
4gb adie (x023)
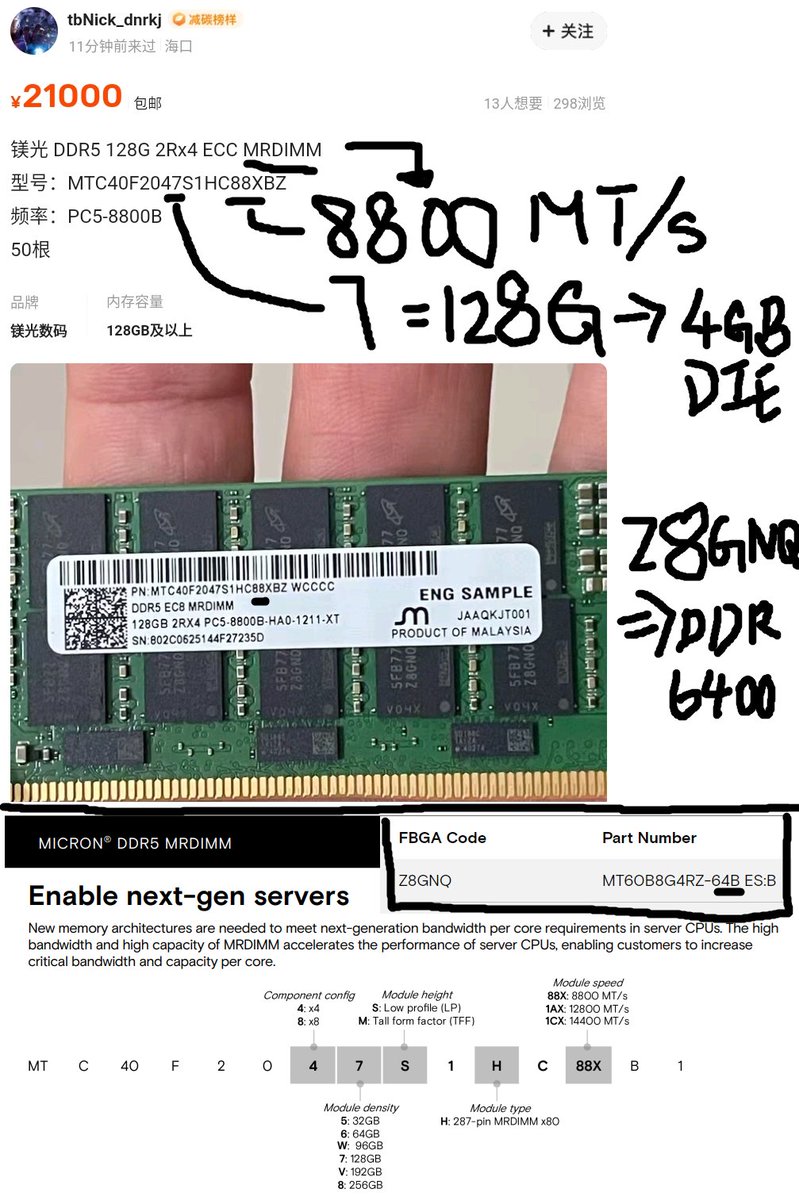
- micron 128gb 8800mt/s mrdimm
4gb dies, the dies seem to be 6400 native and running at 4400mhz?
- micron 128gb 8000mhz rdimm
4gb dies, seems to be native 8000
taobao 永信电子科技1
item.taobao.com/item.htm?abb…
the rest are at xianyu 闲鱼
1
1
2
762


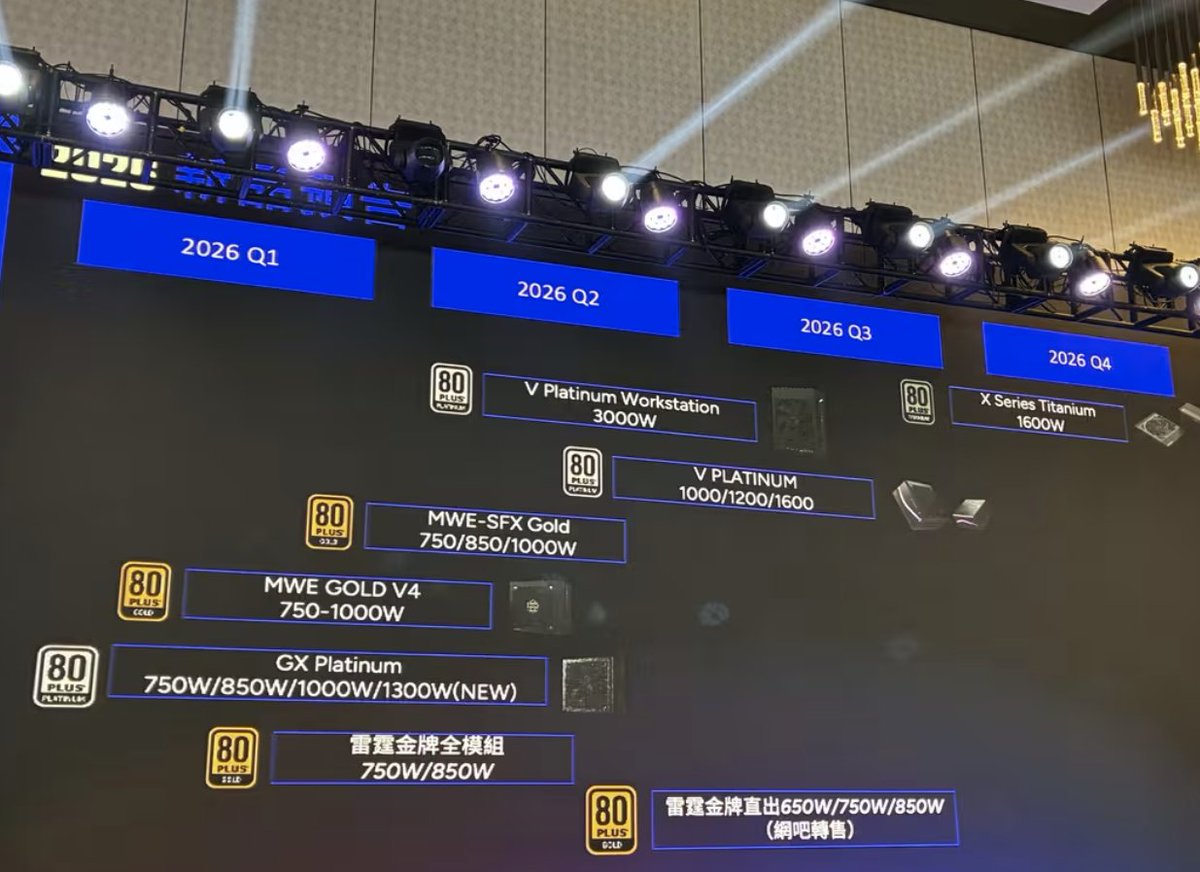
coolermaster launch 2026 china
3 new 120x30mm fans, eta march2026
- master fan m120, metal frame lcp blade, 2300rpm
- master fan a120, metal frame metal blade, 2500rpm, new 3phase motor
- master fan a120fc, metal frame metal blade, 4000rpm, new 3phase motor, includes wireless controller, dual ball bearing
3 high end psu
- v platinum workstation 3000w, eta 2026q2
- v platinum 1000/1200/1600w, eta 2026q2~q3
- x series titanium 1600w, eta 2026q4
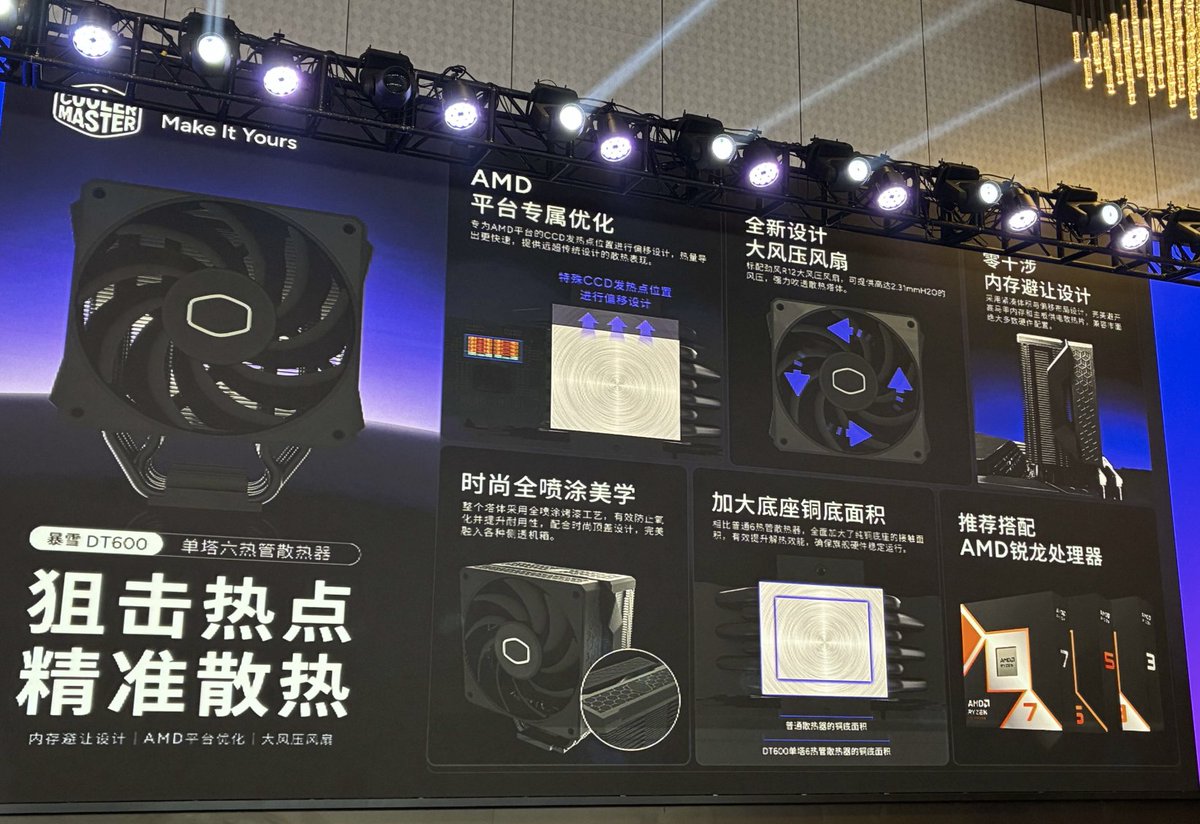
2 new entry level air coolers (black & white )optimised for amd ryzen cpu and ram clearance
- dt600 6hp single tower, no fan clip, 25usd
- dt621 6hp dual tower, no fan clip, single 120x30mm fan, 29usd
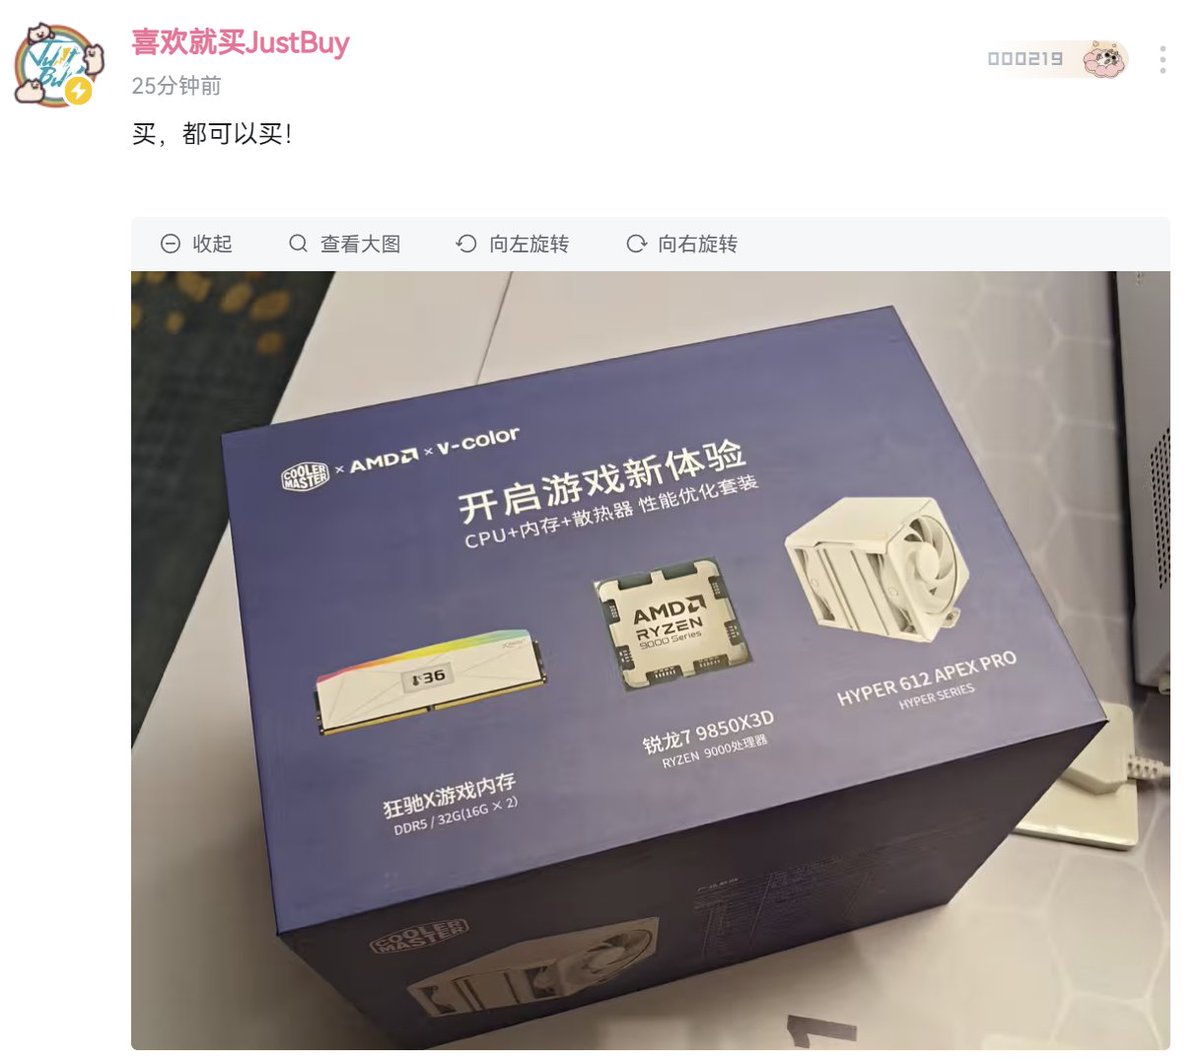
coolermaster x amd x vcolor media box?
- 9850x3d
- manta xfinity argb oled 16x2
- hyper 612 apex pro (white)
bilibili野兽仙贝SUPERODD
t.bilibili.com/1162033707229…
bilibili.com/opus/1162031018…
bilibili.com/opus/1162043023…
bilibili.com/opus/1162009968…


2
4
22
17,592
a very nice box
vcolor x amd x coolermaster
i bet that dram kit is 4800c58
no diff bro no diff
bilibili 喜欢就买JustBuy
t.bilibili.com/1162024421535…
2
3
25
2,258

Jan 23
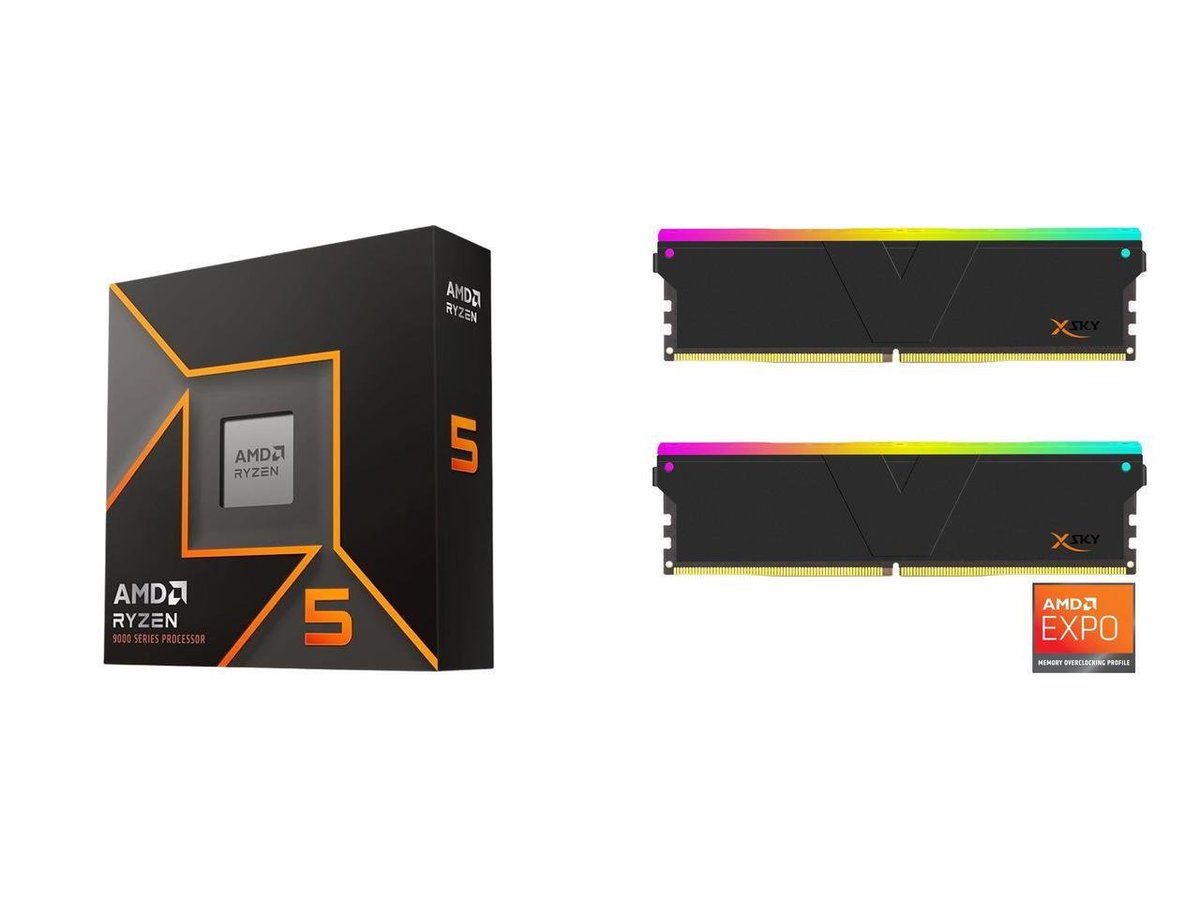
Thanks @a1dorains. and @grimlong for pointing out this bundle that is still available! It comes with a AMD Ryzen 5 9600X, 32GB of Vcolor DDR5 ram and a free MSI 240mm AIO all for $384 at Newegg! click.linksynergy.com/deepli…
3
321

Jan 23
🎉Winners Announced: ASRock White Lab x New Year Giveaway
Congratulations to our lucky winners! 🏆✨ We are thrilled to kick off the year by sending these prizes your way. A heartfelt thank you to everyone who participated and shared the joy! 💝
Is your name on the list? Check the image below to see if you are one of our lucky winners! A huge thank you to everyone who joined us in celebrating the New Year.
📩 Next Steps for Winners: Official notification letters have been sent to your submitted email from: Marketing@asrock.com.tw
🔔 Important Claiming Instructions: To secure your prize, please reply to our email with your shipping details within seven days.
🕒 Deadline: January 28, PST
Note: If we do not receive a response by the deadline, we will move on to invite another participant.
By participating, you agree to the ASRock Privacy Policy and Giveaway Terms & Conditions. asrock.com/general/TermsPriv…
#ASRock #Motherboard #ASRockWhiteLab #Giveaway #SteelLegend #B850 #AIO #AMD #Radeon #Phanteks #vcolor #Christmas #NewYear #HolidayGaming #Luckydraw #PowerUp


4
4
43
2,389