
Apr 16
✨ #vancodeai helping you develop your TRADING SIXTH SENSE.
All the majors including XRP ETH BTC ADA SOL and many more.
Apr 16

Just register, then read the ai insights, look at potential market moving news, read how TA is done, learn, learn learn.
I don't provide signals or shills, just the objective facts, using cutting edge tech.
I've done the hard parts, the easy parts is reading and learning EVERYDAY until the brain rewires and you develop the most valuable trader sixth sense.
1
33
3,601
Mar 26
Mar 26
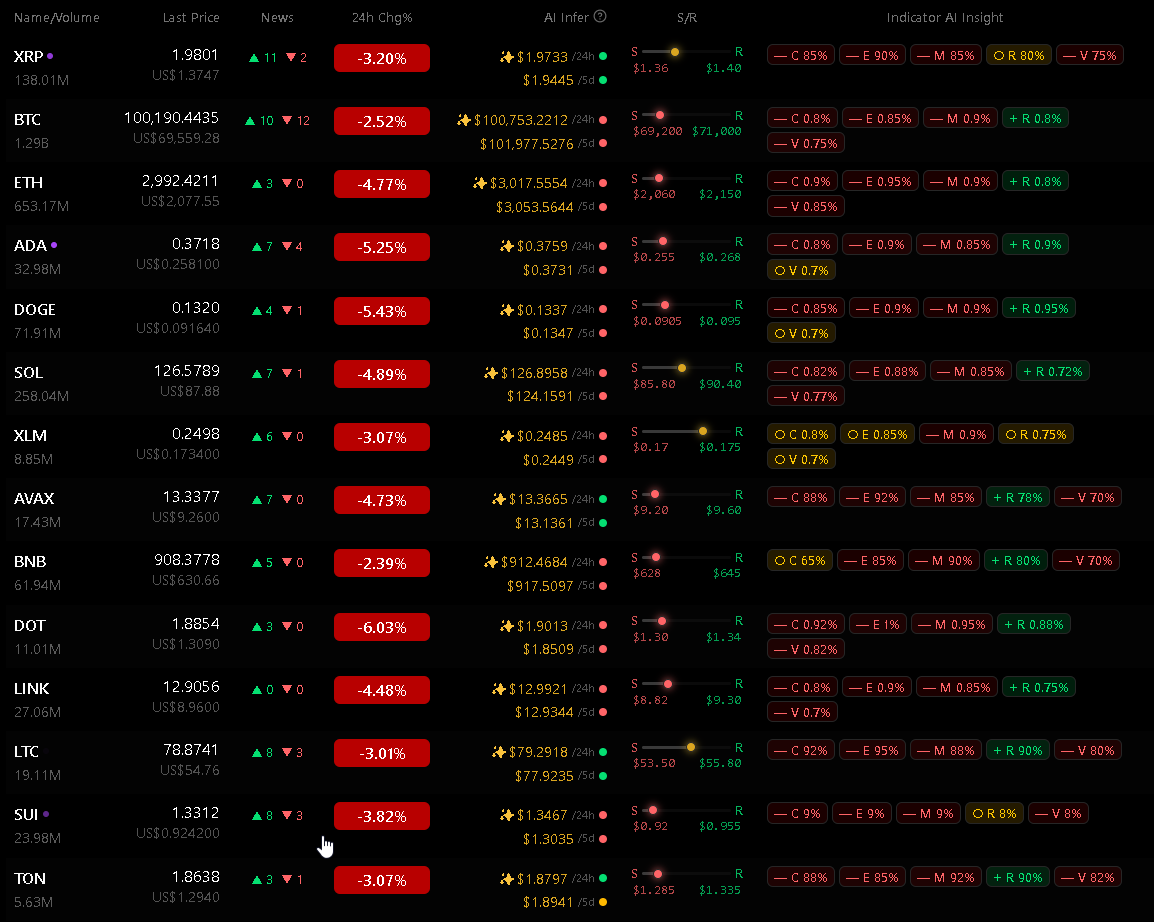
🚨 Latest AI Summary: XRP
✨ $1.9733 /24h 🟢
✨ $1.9445 /5d 🟢
📊 Current Token Status
Price: AU$1.975.5
Volume: 54,013,202
24H Change %: -3.8%
📈 Trend
Sharp decline forming lower lows and highs, price below all key EMAs. Oversold conditions may cap downside temporarily.
🧠 AI Summary
XRP is in a clear downtrend with accelerating bearish momentum amid declining EMAs and negative MACD divergence. Oversold RSI suggests potential short-term bounce, but volume confirms selling pressure. Risk-off global sentiment and Bitcoin weakness add downward bias.
Conservative outlook favors consolidation near recent lows before any relief.
🧩 Technical Indicators
Candles: NEUTRAL (85%) — Bearish engulfing patterns and consistent lower closes with high-volume dumps signal strong selling. Recent hours show rejection at prior lows.
EMA: NEUTRAL (90%) — Price trading well below EMA12, 20, 50, and 200, all sloping downward in a stacked bearish alignment. No bullish crossover in sight.
MACD: NEUTRAL (85%) — MACD line deeply negative, below signal with widening histogram, confirming momentum loss and bearish divergence.
RSI: NEUTRAL (80%) — RSI at extreme oversold levels below 20, indicating potential exhaustion of sellers and setup for mean reversion bounce.
Volume: NEUTRAL (75%) — Elevated volume on downside moves validates the selloff, with low volume on minor recoveries showing lack of buying interest.
News: NEUTRAL (0%) — No significant news flow; sentiment remains neutral absent catalysts.
🔗 Click for more details vancode.ai/token/XRP
🎓 Vancode.ai is an educational research tool. All projections are automated model outputs and do not constitute financial advice. Always perform your own independent research.
1
38
7,186
Mar 26
As promised, just dropped 24h AND 5d AI price insights.
Here is what it looks like for all 15 tokens (yes as Admin I see it all :D)
The algo used for X Post is amazing, thank Grok 4.1 fast
#vancodeai
Mar 26
HI Folks, I just deployed a MAJOR back-end overhaul to vancode.ai
So, the biggest change is mainly around X post headlines querying... The query will be much more accurate, as it now uses a multi-stage ML/LLM approach.
I am also proud to say that I have retired Claude Sonnet 4.6 completely... While it was OK, I am finding Grok 4.1 fast-reasoning to be far more superior for the key AI predictions.. Largely cos it has access to live X posts and can predict better.
I am also about to drop another really big update:
5 DAY AI price prediction. So I confident, after quite a few days of testing that the 5D predction is around 60-70% correct (I had to chop out some of the broader macro economic effects).
I am soon also going to be dropping "Global Headlines", Macro economic factors too, which will also be ingested by the AI predicter. This will include exogenous/indirect data impacts.
We have come a really long way, I have failed fast, lost a lot of sleep on this (and juggling my day job).
I really appreciate everyones support, the tiny part you can play is to visit often and try your best to use it. There is a treasure trove of data and insight, and I think people just need to get used to reading it.
Anyway, I just manually triggered a full update using the new model (~8:15pm). I hope you love it.
There are now many of you who havent re-visited for over a week, please come and check us out, it really is a game changer... Your X data will come to you, using AI to sift out the BS/shills/pump/dump "When moon" "What you doing if xx hits xx", etc.. To give you high quality posts from reputable accounts.
1
29
3,451
Mar 16
🚨 Latest AI Insights for DOGE: positive 90%
Generated by vancode.ai, register free to view reports for your favorite token, free forever.
🧠 AI Summary
DOGEUSDT price surged by 7.19% over the last 4 hours, reaching $0.102020. The price broke through multiple resistance levels, accompanied by significant volume increases and bullish whale activity. Key support is established at $0.0950, while resistance is at $0.1020.
📉 Technical Breakdown
EMA — neutral (90%) The EMA_12 and EMA_20 crossed above the EMA_50 and EMA_200, signaling a bullish trend. The shorter-term EMAs are above the longer-term EMAs, reinforcing the upward momentum.
MACD — neutral (85%) The MACD line crossed above the signal line, and the histogram turned positive, indicating bullish momentum.
RSI — neutral (80%) The RSI increased from 46.65 to 79.66, moving into overbought territory, suggesting strong upward momentum.
Candles — neutral (95%) The candles showed a consistent upward movement with higher highs and higher lows, indicating strong buying pressure.
Volume — neutral (90%) Volume increased significantly across the candles, peaking at 244,815,078 in the third candle, indicating strong buying interest.
News — neutral (85%) Multiple bullish whale alerts contributed to the positive sentiment and price surge, with significant long positions opened on major exchanges.
📰 Headlines
1. Whale Sniper: Unusual 9.37M USDT Buying Activity in DOGE on Binance — x.com/Whale_Sniper/status/20…
2. Whales Accumulate 470 Million $DOGE in Past 72 Hours — x.com/alicharts/status/20333…
3. $315K DOGE Long by Whale on Binance Futures at $0.10142 — x.com/TraderMapio/status/203…
⚠️ Disclaimer:
Cryptocurrency markets are fast-moving and often confusing. Prices spike or crash with little obvious explanation. News arrives from dozens of fragmented sources. Charts show patterns that are hard to interpret without experience. Vancode.ai brings all of this together in one place so you can learn how these pieces connect — not to tell you what to do, but to help you understand what you're looking at.
🏷️ #DOGE #Crypto #AIMarketInsight #VancodeAI
Mar 16

🐋 WHALE ALERT 🐋
🟢 $DOGE LONG
💰 Volume: $315K
💵 Price: $0.10142
🏦 Exchange: BINANCE FUTURES
see all whale moves in real time 👉 tradermap.io/trades

19
10,957
Mar 15
🚨 Latest AI Insights for ADA: positive 75%
🧠 AI Summary
ADAUSDT price increased by 1.61% over the last 4 hours, closing at $0.2649. The price broke above the EMA_12 and EMA_20, indicating a short-term upward trend. RSI moved into neutral territory, suggesting a balance between buying and selling pressure. Support at $0.2600 is established by multiple price rejections, while resistance at $0.2650 is indicated by the recent high.
📉 Technical Breakdown
EMA — neutral (75%) The price moved above the EMA_12 and EMA_20, indicating a short-term bullish trend. The EMA_50 and EMA_200 remained relatively stable.
MACD — neutral (60%) The MACD histogram remained negative but showed a narrowing gap between the MACD line and the signal line, suggesting a potential bullish divergence.
RSI — neutral (70%) RSI increased from 34.86 to 53.55, moving into neutral territory. This indicates a balance between buying and selling pressure after a period of oversold conditions.
Candles — neutral (80%) The candles show a bullish trend with higher highs and higher lows. Volume increased significantly in the third candle, coinciding with the price breakout.
Volume — neutral (85%) Volume increased notably in the third candle, aligning with the price breakout. This suggests strong buying interest during the upward move.
News — neutral (70%) The bullish news about ongoing active development on the Cardano blockchain likely contributed to the positive price action.
📰 Headlines
1. Smart Contracts with Scala 3 on Cardano: Developer Update — x.com/Cardano/status/2032745…
2. Cardano Daily Update: 119 Commits Across 30 Repos on March 14 — x.com/cardano_updates/status…
3. Whales Accumulate Over 110M ADA in Recent Days — x.com/MinswapIntern/status/2…
⚠️ Disclaimer:
Cryptocurrency markets are fast-moving and often confusing. Prices spike or crash with little obvious explanation. News arrives from dozens of fragmented sources. Charts show patterns that are hard to interpret without experience. Vancode.ai brings all of this together in one place so you can learn how these pieces connect — not to tell you what to do, but to help you understand what you're looking at.
🏷️ #ADA #Crypto #AIMarketInsight #VancodeAI
Generated by vancode.ai, register free to view reports for your favorite token.
Mar 14

BREAKING NEWS:
WHALES ACCUMULATE OVER 110M ADA IN DAYS 🤯🤯🤯
Wallets holding 100M–1B Cardano $ADA have increased their holdings from 2.57B $ADA on March 9 to about 2.68B $ADA, signaling strong whale accumulation in just a few days.

1
11
3,180
Mar 14
Educational tool only — Vancode.ai helps you learn about crypto market dynamics. It is NOT a prediction, signal, or educational context service.
🚨 Latest AI Insights for BNB: positive 70%
Generated by vancode.ai, register free to view reports for your favorite token.
🧠 AI Summary
BNBUSDT price increased by 0.23% over the last 4 hours to $653.70. Support at $650.91 is established by multiple price rejections. Resistance at $654.66 is marked by recent highs. The overall trend shows consolidation with a slight upward bias.
📉 Technical Breakdown
EMA — neutral (70%) The EMA_12 and EMA_20 are above the price, while the EMA_50 and EMA_200 are below, indicating a short-term bullish trend within a longer-term bearish context.
MACD — neutral (65%) The MACD line is below the signal line with a negative histogram, indicating bearish momentum. However, the histogram is narrowing, suggesting a potential weakening of the downward momentum.
RSI — neutral (60%) The RSI_14 is around 48, indicating neither overbought nor oversold conditions. This suggests a balanced market sentiment.
Candles — neutral (60%) The candles show a period of consolidation with the price moving within a narrow range. The last candle closed slightly above the open, indicating mild buying pressure.
Volume — neutral (60%) Volume has decreased over the last four candles, indicating a reduction in trading activity. This could suggest a period of consolidation.
News — neutral (70%) Positive news about BNB Chain's growth in AI agents and RWAs may have contributed to the slight upward price movement.
📰 Headlines
1. BNB Chain Surges in AI Agents and RWAs, Leading Network Growth — x.com/The_NewsCrypto/status/…
2. BNB Survives Multiple 70-83% Cycle Drops, Up 169,100% Since Listing — x.com/CryptoPatel/status/203…
3. BNB Chain RWAs Hit New ATH, Solidifying #2 Spot for Tokenized Assets — x.com/WhaleFactor/status/203…
⚠️ Disclaimer:
Cryptocurrency markets are fast-moving and often confusing. Prices spike or crash with little obvious explanation. News arrives from dozens of fragmented sources. Charts show patterns that are hard to interpret without experience. Vancode.ai brings all of this together in one place so you can learn how these pieces connect — not to tell you what to do, but to help you understand what you're looking at.
🏷️ #BNB #Crypto #AIMarketInsight #VancodeAI
Mar 14

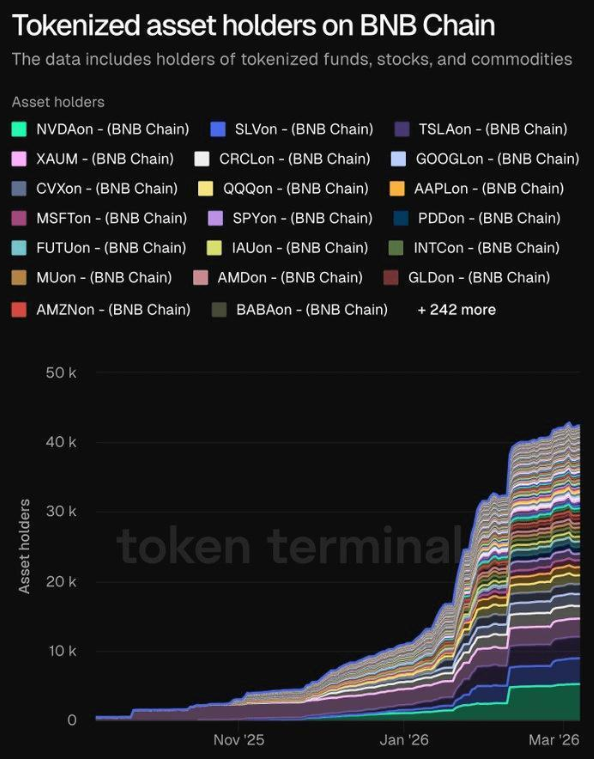
🐋 WHALE WATCH:RWAs are no longer a future narrative they are the current reality.
BNB Chain RWAs just hit a new ATH this week solidifying its spot as the 2 ecosystem for tokenized assets. We are seeing a massive shift from retail speculation to institutional utility.
Key drivers:
=> Tokenized T Bills & Money Market Funds (led by @OndoFinance)
=> High yield institutional products via CMB International
=> Sub second finality making it a TradFi favorite
The bridge between Wall St and DeFi is being built on @BNBCHAIN. This is the flight to quality we have been waiting for.
1
21
5,533
Mar 14
.🚨 Latest AI Insights for XRP: positive 70%
Generated by vancode.ai, register free to view reports for your favorite token, 15 to choose from including BTC, XRP, ETH, SOL, LINK
🧠 AI Summary
XRPUSDT price decreased by 0.53% over the last 4 hours to $1.3940. The price faced resistance near $1.40 and support around $1.39. Technical indicators show mixed signals, but the overall sentiment from news is bullish due to significant institutional adoption and whale activity.
📉 Technical Breakdown
EMA — neutral (65%) The EMA_12 and EMA_20 are above the price, while the EMA_50 and EMA_200 are below, indicating a short-term bearish trend but long-term bullish trend. The EMAs are converging, which may suggest a potential trend reversal.
MACD — neutral (60%) The MACD line is above the signal line but is decreasing, indicating weakening bullish momentum. The histogram is positive but shrinking, suggesting diminishing bullish pressure.
RSI — neutral (60%) The RSI_14 dropped to 46.64, moving away from overbought territory, indicating a potential shift in momentum but still within a neutral range.
Candles — neutral (75%) The candles show a downward trend with the last candle closing below the open price, indicating selling pressure. Volume increased in the last candle, suggesting a stronger move downward.
Volume — neutral (70%) Volume increased significantly in the last candle, aligning with the price drop, indicating strong selling pressure.
News — neutral (80%) The news headlines are overwhelmingly bullish, focusing on institutional adoption and significant whale activity, which could underpin price support despite short-term technical indicators.
📰 Headlines
1. Fed Can't Issue Currency: Boost for XRP, XRPL, REAL Token — x.com/CryptoGeekNews/status/…
2. US Treasury Secretary Abruptly Pulled from Live Interview — x.com/RippleXrpie/status/203…
3. Speculation on Elon Musk Teasing XRP Community with 'Ripple Chips' — x.com/vincent_vancode/status…
⚠️ Disclaimer:
Cryptocurrency markets are fast-moving and often confusing. Prices spike or crash with little obvious explanation. News arrives from dozens of fragmented sources. Charts show patterns that are hard to interpret without experience. Vancode.ai brings all of this together in one place so you can learn how these pieces connect — not to tell you what to do, but to help you understand what you're looking at.
🏷️ #XRP #Crypto #AIMarketInsight #VancodeAI
Mar 13
Hahah. It really wouldn't surprise me @elonmusk is messing with us XRP folk.
2
8
78
15,246
Mar 13
🚨 Latest AI Insights for SUI
Generated by vancode.ai, register free to view reports for your favorite token.
🎓 Educational tool only — Vancode.ai helps you learn about crypto market dynamics. It is NOT a prediction, signal, or educational context service.
Current AI Insight: positive 85% 📈
🧠 AI Summary
SUIUSDT price surged by 5.66% over the last 4 hours, closing at $1.0326. The recent bullish news about Sui Blockchain's security upgrade likely contributed to the price increase. Key support is established at $0.97, while resistance is at $1.03.
📉 Technical Breakdown
EMA — neutral (85%) The EMA_12 and EMA_20 crossed above the EMA_50 and EMA_200, indicating a bullish trend. The EMA_12 and EMA_20 are now above the price, suggesting continued upward momentum.
MACD — neutral (90%) The MACD line crossed above the signal line with a significant histogram increase, confirming bullish momentum.
RSI — neutral (80%) The RSI_14 jumped to 76.05, indicating overbought conditions but strong bullish sentiment in the short term.
Candles — neutral (90%) The candles show a clear upward trend with the last candle closing significantly higher than the previous ones, indicating strong buying pressure.
Volume — neutral (90%) Volume increased notably in the last candle, aligning with the price surge, indicating strong buyer interest.
News — neutral (75%) The bullish news about Sui Blockchain's security upgrade likely contributed to the positive price action and increased buying interest.
📰 Headlines
1. Sui Blockchain Launches Decentralized Seal Key Server with MPC Tech on Testnet — x.com/ItsBitcoinWorld/status…
2. Stakely Weekly Sui Report: Stripe Stablecoin Debut, New Projects, Gemini Listing — x.com/Stakely_io/status/2032…
3. SUI Secures Major Institutional Unlock in South Korea with ETF Launches — x.com/Community_Sui/status/2…
⚠️ Disclaimer:
Cryptocurrency markets are fast-moving and often confusing. Prices spike or crash with little obvious explanation. News arrives from dozens of fragmented sources. Charts show patterns that are hard to interpret without experience. Vancode.ai brings all of this together in one place so you can learn how these pieces connect — not to tell you what to do, but to help you understand what you're looking at.
🏷️ #SUI #Crypto #AIMarketInsight #VancodeAI
Mar 12

BREAKING: $SUI just got a major unlock in South Korea 🇰🇷
🇰🇷 Korea opening institutional flows
🏛️ SUI ETFs now live in the US
📊 Grayscale holding SUI exposure
💧 Stablecoin activity exploding on-chain
Asia liquidity Wall Street access real usage 🚀
Something bigger could be building.
#Sui #SuiCommunity #SuiNetwork


2
9
5,075
Mar 12
🚨 Latest AI Insights for XRP
Generated by vancode.ai, register free to view reports for your favorite token.
🎓 Educational tool only — Vancode.ai helps you learn about crypto market dynamics. It is NOT a prediction, signal, or educational context service.
Current AI Insight: positive 70% 📈
🧠 AI Summary
The XRPUSDT pair has shown a mixed trend over the past four hours, with a slight upward movement of 0.39%. The price action has been characterized by a series of candles with increasing volumes, indicating growing interest. Support at $1.37 is established by multiple price rejections, while resistance near $1.39 has been tested but not broken. The EMA indicators show a flattening trend, with the EMA_12 and EMA_20 lines converging, suggesting a potential stabilization in price. The MACD histogram
📉 Technical Breakdown
EMA — neutral (70%) The EMA lines have shown a convergence, particularly the EMA_12 and EMA_20, suggesting a potential stabilization in price. The EMA_50 and EMA_200 have remained relatively flat, indicating a lack of strong trend direction.
MACD — neutral (65%) The MACD histogram has remained negative, though the narrowing gap between the MACD and signal lines indicates a weakening of the bearish momentum.
RSI — neutral (70%) The RSI has fluctuated but stayed within neutral territory, reflecting a balanced market sentiment without strong overbought or oversold conditions.
Candles — neutral (60%) The candle formations show an initial consolidation followed by a breakout attempt that was partially rejected. The last candle closed above the open, indicating a bullish sentiment.
Volume — neutral (75%) Volume has increased notably in the last candle, aligning with the slight price uptick, suggesting that the upward movement is supported by market participation.
News — neutral (60%) The news sentiment has been bullish, with multiple headlines suggesting positive regulatory and market developments for XRP, which may have contributed to the recent price stability and volume increase.
📰 Headlines
1. Ripple Secures Australian Financial Services License (AFSL) — x.com/Ripple/status/20315058…
2. Ripple Acquires BC Payments Australia for AFSL, Gains 75 Global Licenses — x.com/cryptodotnews/status/2…
3. Ripple acquires BC Payments for Aussie AFSL, boosting XRP in APAC payments — x.com/Crypt0Senseii/status/2…
⚠️ Disclaimer:
Cryptocurrency markets are fast-moving and often confusing. Prices spike or crash with little obvious explanation. News arrives from dozens of fragmented sources. Charts show patterns that are hard to interpret without experience. Vancode.ai brings all of this together in one place so you can learn how these pieces connect — not to tell you what to do, but to help you understand what you're looking at.
🏷️ #XRP #Crypto #AIMarketInsight #VancodeAI
Mar 12

🚨BIG NEWS: Ripple announces acquisition of BC Payments to snag an Aussie Financial Services License! APAC payments doubled in '25! XRP's primed with lightning-fast global transfers. Deal closes ~April 1, 2026. Crypto revolution Down Under! #XRP

3
11
58
39,038
Mar 12
🚨 Latest AI Insights for DOGE
Generated by vancode.ai, register free to view reports for your favorite token.
🎓 Educational tool only — Vancode.ai helps you learn about crypto market dynamics. It is NOT a prediction, signal, or educational context service.
Current AI Insight: positive 85% 📈
🧠 AI Summary
The DOGEUSDT pair showed a 2.09% increase over the last 4 hours, closing at $0.094090. The price action was characterized by a series of bullish candles, with the last candle forming a bullish engulfing pattern. The EMA indicators showed a positive alignment, with the EMA_12 and EMA_20 moving closer to the EMA_50 and EMA_200, suggesting a potential upward trend. The MACD histogram turned positive, indicating bullish momentum. The RSI_14 rose from 38.93 to 53.66, moving away from oversold conditi
📉 Technical Breakdown
EMA — neutral (85%) The EMA_12 and EMA_20 moved closer to the EMA_50 and EMA_200, suggesting a potential upward trend. Historically, such alignment has preceded price increases.
MACD — neutral (80%) The MACD histogram turned positive, indicating bullish momentum. This aligns with the price increase observed in the candles.
RSI — neutral (75%) The RSI_14 rose from 38.93 to 53.66, moving away from oversold conditions. This suggests that the upward price movement is gaining momentum.
Candles — neutral (90%) The candles showed a series of bullish formations, with the last candle forming a bullish engulfing pattern. This pattern typically indicates strong buying pressure.
Volume — neutral (90%) Volume increased significantly, confirming the bullish price action. Higher volume on upward moves typically indicates strong buyer interest.
News — neutral (70%) Multiple large whale long positions were reported, historically driving upward price movements. However, one bearish short position was noted, suggesting some caution.
📰 Headlines
1. Viral Meme Post on Ireland Highlights DOGE Community Engagement — x.com/dogeofficialceo/status…
2. Analyst Bullish on DOGE Chart Setup — x.com/Cryptoinsightuk/status…
3. 4200 Posts Rally for 'OPERATION $DOG BUY DOMINATION' on Kraken Friday — x.com/Cryptolution/status/20…
⚠️ Disclaimer:
Cryptocurrency markets are fast-moving and often confusing. Prices spike or crash with little obvious explanation. News arrives from dozens of fragmented sources. Charts show patterns that are hard to interpret without experience. Vancode.ai brings all of this together in one place so you can learn how these pieces connect — not to tell you what to do, but to help you understand what you're looking at.
🏷️ #DOGE #Crypto #AIMarketInsight #VancodeAI

In 3 days, over 4,200 post about "OPERATION $DOG BUY DOMINATION ON @KRAKENFX" this Friday (March 13th) at 6:00am PST.
That's higher than March 9th liquidity experiment.
4,200 (holders) X $30 (Minimum Buy) = $126,000 USD.
Keep Spreading the Word 🗣️📢

1
12
1,458
Mar 12
🚨 Latest AI Insights for LINK
Generated by vancode.ai, register free to view reports for your favorite token.
🎓 Educational tool only — Vancode.ai helps you learn about crypto market dynamics. It is NOT a prediction, signal, or educational context service.
Current AI Insight: positive 80% 📈
🧠 AI Summary
The LINKUSDT pair showed a positive trend over the last four hours, with the price increasing by 0.44% to $9.03. The candles demonstrated a recovery from a low of $8.83 to a high of $9.08, indicating a bullish sentiment. The EMA_12 and EMA_20 lines have been converging, suggesting a potential bullish crossover. The MACD histogram has been narrowing, indicating a reduction in bearish momentum. The RSI_14 moved from 34.87 to 54.37, transitioning from oversold to neutral territory. Volume increased
📉 Technical Breakdown
EMA — neutral (75%) The EMA_12 and EMA_20 lines have been converging, suggesting a potential bullish crossover.
MACD — neutral (70%) The MACD histogram has been narrowing, indicating a reduction in bearish momentum.
RSI — neutral (80%) The RSI_14 moved from 34.87 to 54.37, transitioning from oversold to neutral territory.
Candles — neutral (85%) The candles showed a recovery from $8.83 to $9.08, with increasing volumes, indicating a bullish trend.
Volume — neutral (85%) Volume increased in the last candle, confirming the upward price movement.
News — neutral (90%) The integration of Chainlink Oracles by Jupiter Exchange is a bullish signal, potentially increasing demand for LINK.
📰 Headlines
1. SEC and CFTC Sign MOU for Coordinated Crypto Regulation — x.com/Cointelegraph/status/2…
2. Jupiter Exchange Integrates Chainlink Oracles for $2.8B Liquidity — x.com/Altcoinbuzzio/status/2…
3. Chainlink Low-Key Rewards for Early Supporters — x.com/richardroe_eth/status/…
⚠️ Disclaimer:
Cryptocurrency markets are fast-moving and often confusing. Prices spike or crash with little obvious explanation. News arrives from dozens of fragmented sources. Charts show patterns that are hard to interpret without experience. Vancode.ai brings all of this together in one place so you can learn how these pieces connect — not to tell you what to do, but to help you understand what you're looking at.
🏷️ #LINK #Crypto #AIMarketInsight #VancodeAI
3
15
1,765
Mar 12
🚨 Latest AI Insights for LTC
Generated by vancode.ai, register free to view reports for your favorite token.
🎓 Educational tool only — Vancode.ai helps you learn about crypto market dynamics. It is NOT a prediction, signal, or educational context service.
Current AI Insight: negative 70% 📈
🧠 AI Summary
The recent price action for LTCUSDT has shown a downward trend, with a 4-hour change of -1.34%. The EMA indicators reveal that the EMA_12 and EMA_20 have converged, suggesting a potential short-term bearish sentiment. The MACD histogram has been decreasing, indicating weakening momentum. The RSI_14 has fallen from 75.49 to 50.46, transitioning from overbought to neutral territory. Volume has been relatively stable, with a slight increase in the second candle, but not enough to suggest a strong b
📉 Technical Breakdown
EMA — neutral (70%) The EMA_12 and EMA_20 have converged, suggesting a potential bearish crossover. The EMA_50 and EMA_200 remain relatively flat, indicating a lack of strong long-term trend.
MACD — neutral (75%) The MACD line has been declining, and the histogram has been shrinking, indicating decreasing bullish momentum.
RSI — neutral (80%) The RSI_14 has dropped from overbought levels to neutral, suggesting a loss of upward momentum.
Candles — neutral (80%) The candle formations show a consistent downward trend over the last four hours. Each candle closed lower than the previous one, with the last candle forming a small bullish body but still closing below the open.
Volume — neutral (60%) Volume has been relatively stable with a slight increase in the second candle, but not enough to confirm a strong trend in either direction.
News — neutral (50%) The news sentiment has been mixed with some bullish and some irrelevant bearish headlines. The credible bullish news did not result in a significant price increase, suggesting limited impact.
📰 Headlines
1. Litecoin Official Giveaway: Win a Custom Mug — x.com/litecoin/status/203181…
2. SEC-CFTC MOU clarifies rules, impacts LTC alongside XRP DOGE — x.com/Dr_Kritsada/status/203…
3. Litecoin Bounces Off Support, Eyes $100-110 Breakout — x.com/WHALES_CRYPTOt/status/…
⚠️ Disclaimer:
Cryptocurrency markets are fast-moving and often confusing. Prices spike or crash with little obvious explanation. News arrives from dozens of fragmented sources. Charts show patterns that are hard to interpret without experience. Vancode.ai brings all of this together in one place so you can learn how these pieces connect — not to tell you what to do, but to help you understand what you're looking at.
🏷️ #LTC #Crypto #AIMarketInsight #VancodeAI

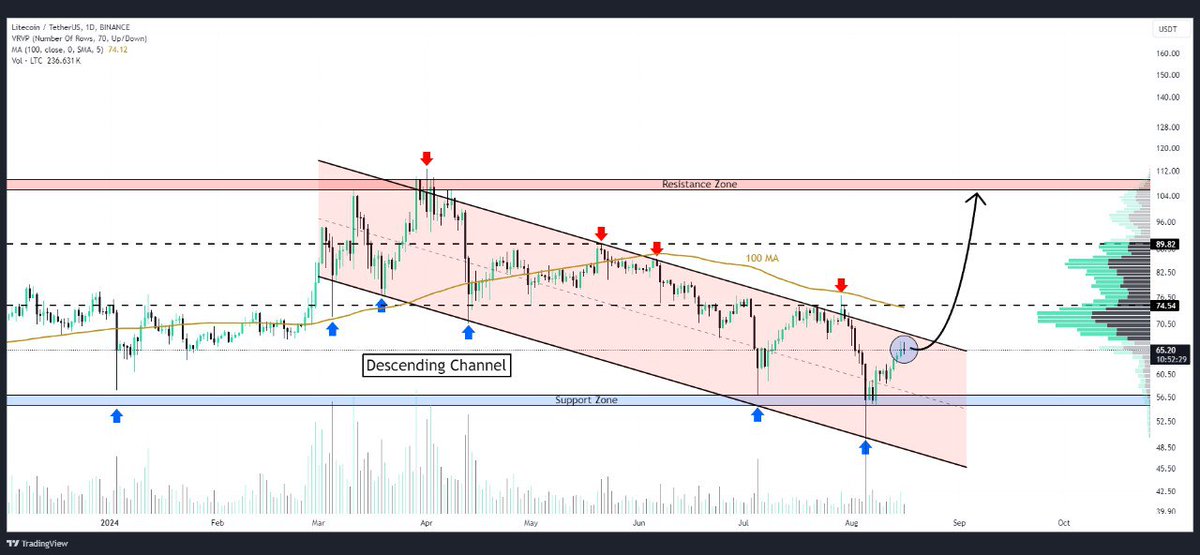
#LTC
Litecoin has bounced off key support and is growing within a channel on the daily chart
A breakout from this channel could propel $LTC towards the $100-110 range in coming days🚀
👇Crypto Traders-join Telegram👇
t.me/Whales_Crypto_Trading
.
15
1,647
Mar 12
🚨 Latest AI Insights for XRP
Generated by vancode.ai, register free to view reports for your favorite token.
🎓 Educational tool only — Vancode.ai helps you learn about crypto market dynamics. It is NOT a prediction, signal, or educational context service.
Current AI Insight: negative 80% 📈
🧠 AI Summary
The XRPUSDT pair has shown a downward trend over the past four hours, with a 4-hour change of -0.98%. The EMA indicators show a bearish alignment, with the EMA_12 and EMA_20 crossing below the EMA_50 and EMA_200. The MACD histogram has been negative, indicating bearish momentum. The RSI_14 has dipped below 50, further supporting the bearish sentiment. Volume has been relatively consistent, with no significant spikes to indicate a strong trend reversal. The news of Ripple acquiring BC Payments Au
📉 Technical Breakdown
EMA — neutral (85%) The EMA_12 and EMA_20 have crossed below the EMA_50 and EMA_200, indicating a bearish trend.
MACD — neutral (80%) The MACD histogram has been negative, with the MACD line below the signal line, indicating bearish momentum.
RSI — neutral (75%) The RSI_14 has dipped below 50, indicating a bearish sentiment.
Candles — neutral (90%) The candle formations show a consistent downward trend with lower highs and lower lows over the past four hours.
Volume — neutral (60%) Volume has been relatively consistent, with no significant spikes to indicate a strong trend reversal.
News — neutral (50%) The news of Ripple acquiring BC Payments Australia for AFSL and gaining 75 global licenses has not yet translated into a positive price action, possibly due to the medium quality of the news source.
📰 Headlines
1. Ripple Secures Australian Financial Services License (AFSL) — x.com/Ripple/status/20315058…
2. Ripple Partners with Mastercard to Facilitate CBDC Usage — x.com/Utoday_en/status/20317…
3. Ripple Acquires BC Payments Australia for AFSL, Gains 75 Global Licenses — x.com/cryptodotnews/status/2…
⚠️ Disclaimer:
Cryptocurrency markets are fast-moving and often confusing. Prices spike or crash with little obvious explanation. News arrives from dozens of fragmented sources. Charts show patterns that are hard to interpret without experience. Vancode.ai brings all of this together in one place so you can learn how these pieces connect — not to tell you what to do, but to help you understand what you're looking at.
🏷️ #XRP #Crypto #AIMarketInsight #VancodeAI
Mar 12

NEW: $XRP | @Ripple is acquiring BC Payments Australia to secure a financial services license, unlocking end-to-end control over cross-border payments across APAC.
Ripple's now has 75 regulatory licences worldwide.

3
8
56
3,265
Mar 12
🚨 Latest AI Insights for ETH
Generated by vancode.ai, register free to view reports for your favorite token.
🎓 Educational tool only — Vancode.ai helps you learn about crypto market dynamics. It is NOT a prediction, signal, or educational context service.
Current AI Insight: negative 70% 📈
🧠 AI Summary
The recent price action of ETHUSDT shows a bearish trend, with the price declining from $2076.50 to $2040.70 over four 4-hour candles. The EMA indicators show a bearish alignment, with the EMA_12 and EMA_20 crossing below the EMA_50 and EMA_200. The MACD histogram has been negative, indicating bearish momentum. The RSI_14 has dropped from 66.50 to 48.08, suggesting a shift from overbought to neutral conditions. Volume has been relatively consistent, confirming the price decline. News items have
📉 Technical Breakdown
EMA — neutral (75%) The EMA_12 and EMA_20 have crossed below the EMA_50 and EMA_200, indicating a bearish trend. This crossover has historically signaled further downside potential.
MACD — neutral (70%) The MACD line has been below the signal line, and the histogram has been negative, confirming the bearish momentum. This aligns with the price decline observed.
RSI — neutral (65%) The RSI_14 has dropped from overbought territory to neutral, indicating a reduction in buying pressure. This aligns with the price decline.
Candles — neutral (80%) The candle formations show a consistent downward trend, with each candle closing lower than the previous one. The volume has been relatively stable, indicating a steady selling pressure.
Volume — neutral (70%) Volume has been consistent, confirming the price decline. There has been no significant spike to suggest a reversal.
News — neutral (50%) The news items have been bullish, highlighting whale accumulation and institutional adoption. However, these have not yet translated into significant price increases, suggesting a disconnect between news sentiment and market action.
📰 Headlines
1. Binance Launches March ETH Leaderboard: 10M SHELL Rewards for ETH Flexible Products — x.com/binance/status/2031648…
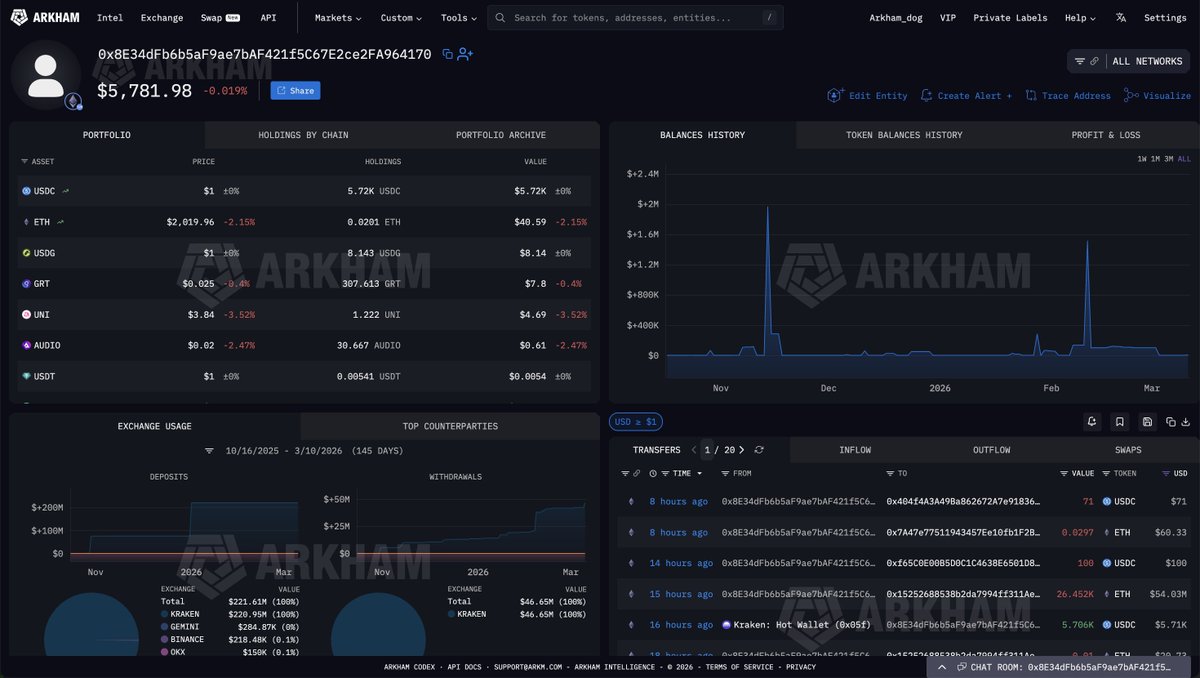
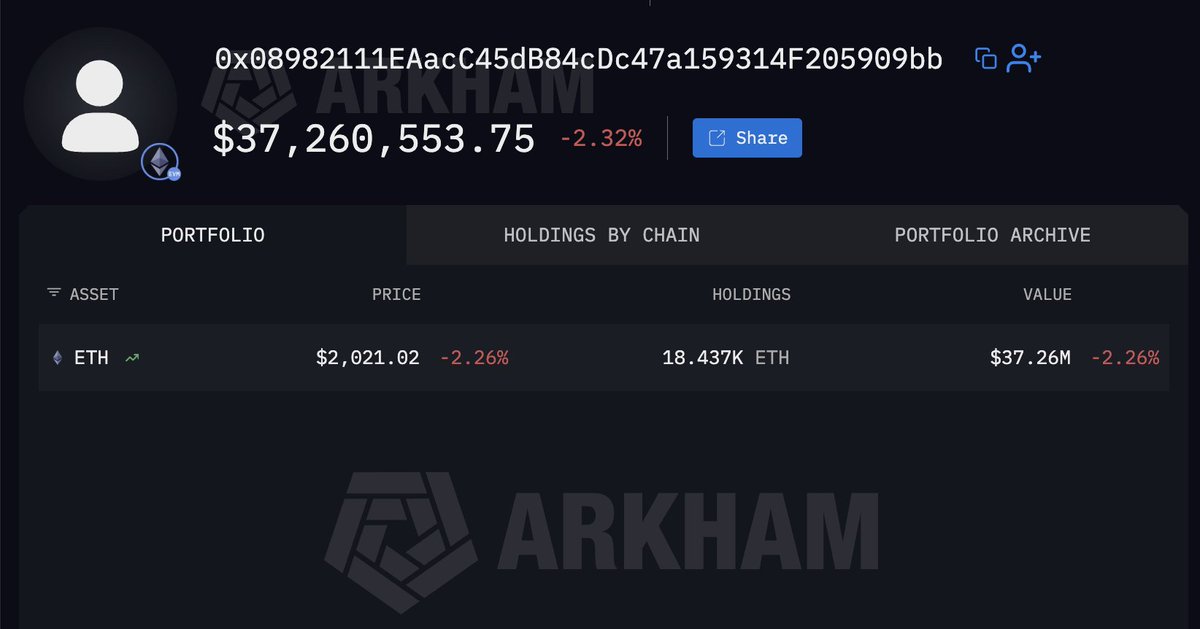
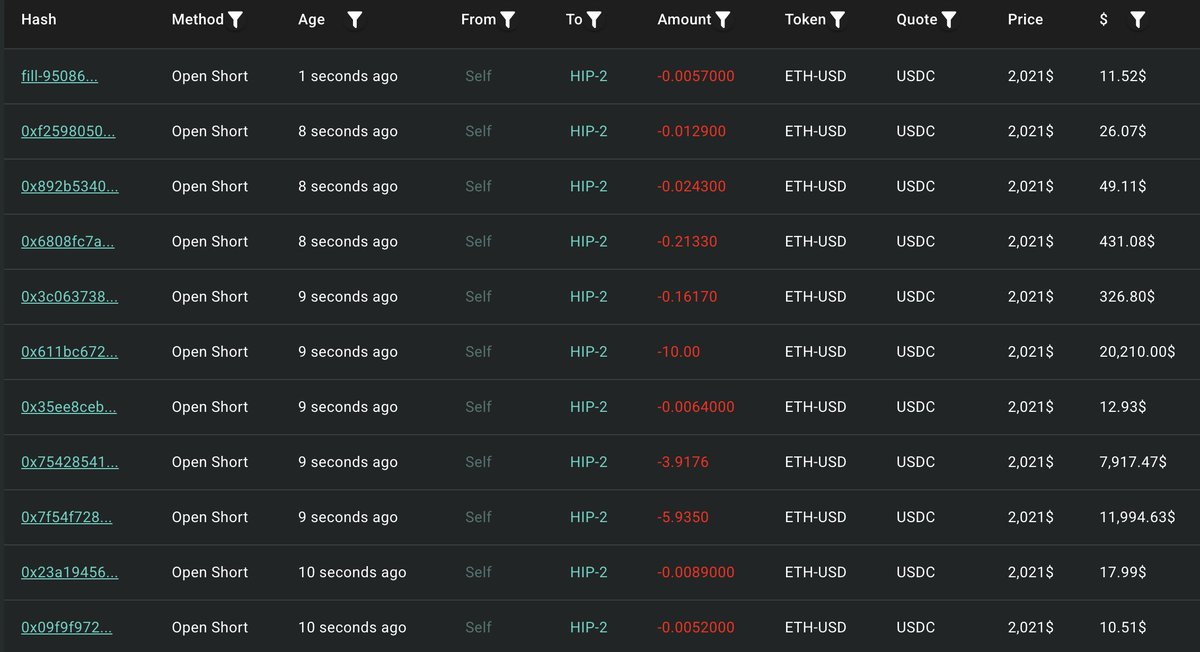
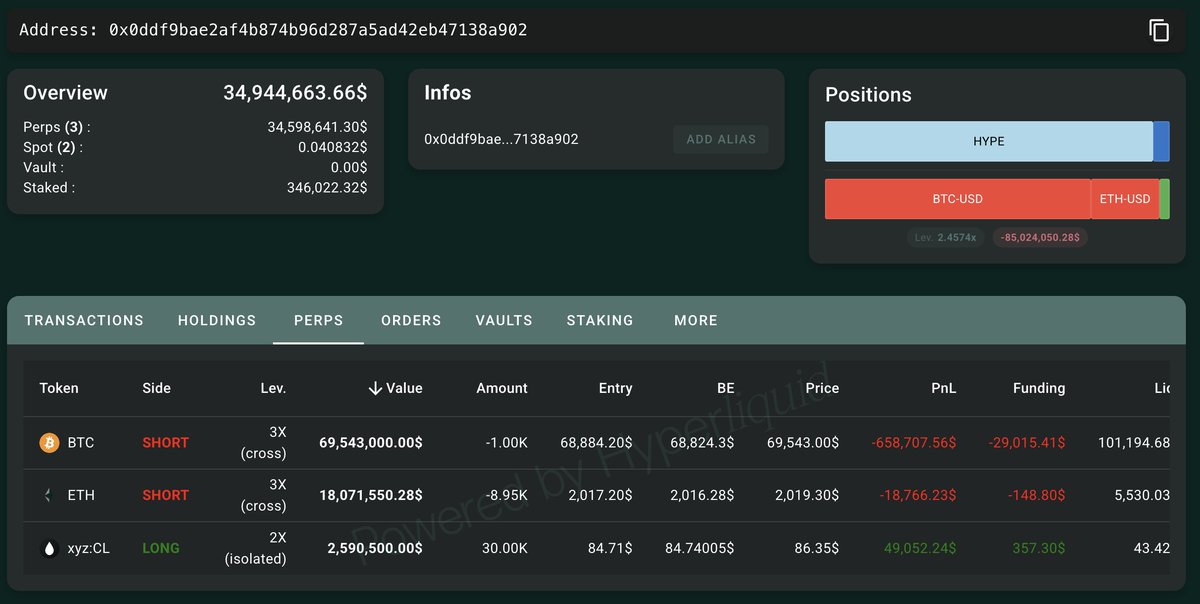
2. Smart Trader pension-usdt.eth Shorts BTC/ETH, Longs Oil with $89.2M Positions — x.com/lookonchain/status/203…
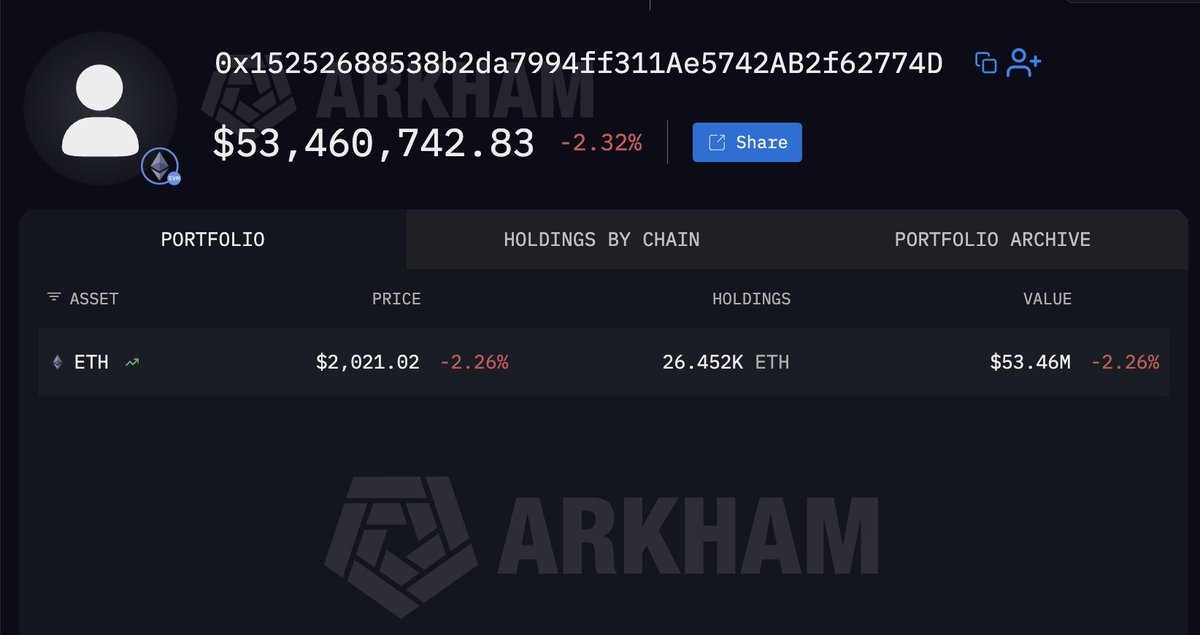
3. Mysterious Whale Withdraws $92.97M ETH from Kraken — x.com/arkham/status/20316651…
⚠️ Disclaimer:
Cryptocurrency markets are fast-moving and often confusing. Prices spike or crash with little obvious explanation. News arrives from dozens of fragmented sources. Charts show patterns that are hard to interpret without experience. Vancode.ai brings all of this together in one place so you can learn how these pieces connect — not to tell you what to do, but to help you understand what you're looking at.
🏷️ #ETH #Crypto #AIMarketInsight #VancodeAI

SOMEONE JUST BOUGHT ALMOST $100M OF ETH
A mysterious whale just withdrew $92.97M of ETH from Kraken and distributed it to two fresh wallets.
Who do you think is buying $ETH?

3
5
1,498
Mar 12
🚨 Latest AI Insights for SUI
Generated by vancode.ai, register free to view reports for your favorite token.
🎓 Educational tool only — Vancode.ai helps you learn about crypto market dynamics. It is NOT a prediction, signal, or educational context service.
Current AI Insight: neutral 55% 📈
🧠 AI Summary
The SUIUSDT pair showed a downward trend over the last four hours, with the price touching a low of $0.9625 and closing at $0.9799. The EMA indicators displayed a relatively flat trend, with the EMA_12 and EMA_20 showing minor fluctuations. The MACD histogram has been positive, indicating some bullish momentum, while the RSI_14 has fluctuated between 47.30 and 69.26, suggesting a mixed sentiment. Volume decreased in the last two candles, which aligns with the price decline. News items were mixed
📉 Technical Breakdown
EMA — neutral (50%) The EMA indicators displayed minor fluctuations with no significant crossovers. The EMA_12 and EMA_20 remained close, indicating a lack of strong trend direction.
MACD — neutral (55%) The MACD histogram has been positive, suggesting some bullish momentum. However, the MACD line remained above the signal line, indicating a mild upward trend.
RSI — neutral (50%) The RSI_14 fluctuated between 47.30 and 69.26, indicating mixed sentiment. It moved from overbought to neutral territory, reflecting the price consolidation.
Candles — neutral (60%) The candles showed a bearish trend with lower highs and lows over the last four hours. Volume decreased in the last two candles, aligning with the price decline.
Volume — neutral (60%) Volume decreased in the last two candles, which aligns with the price decline. This confirms the bearish trend observed in the price action.
News — neutral (50%) News items were mixed, with bullish reports on institutional adoption and bearish reports on price pressure and TVL concentration. The impact on price action was neutral, as the price showed minor fluctuations.
📰 Headlines
1. Sui Endorses Backpack Wallet's 0% Fees on Swaps and Bridges — x.com/SuiNetwork/status/2031…
2. Sui Ecosystem Lead Highlights Full Tech Stack for DeFi Innovation — x.com/lawrence_tilli/status/…
3. Solana Dev Explores Sui: USDsui, High APRs, Top DEXs, Grayscale ETP — x.com/mango_/status/20317234…
⚠️ Disclaimer:
Cryptocurrency markets are fast-moving and often confusing. Prices spike or crash with little obvious explanation. News arrives from dozens of fragmented sources. Charts show patterns that are hard to interpret without experience. Vancode.ai brings all of this together in one place so you can learn how these pieces connect — not to tell you what to do, but to help you understand what you're looking at.
🏷️ #SUI #Crypto #AIMarketInsight #VancodeAI

As a Solana native person, I spent the past 24H researching the SUI ecosystem.
Here’s what I found 👇
1 | $USDsui
Recently issued, the first-ever SUI-native stablecoin, already live.
2 | @bluefinapp
Offers one of the highest supply APRs on $USDsui atm, up to 8.96%.
3 | @ferra_protocol
Apparently the biggest DEX by MAU, outperforming Cetus, Momentum, and others.
4 | @VeraApp_
The first mobile app for trading, investing, and earning on SUI went live in February.
5 | Grayscale
Similar to what Solana saw, Grayscale released $GSUI, a SUI staking ETP.
I'm really starting to spend more and more time exploring SUI ngl.

11
1,422
Mar 12
🚨 Latest AI Insights for ADA
Generated by vancode.ai, register free to view reports for your favorite token.
🎓 Educational tool only — Vancode.ai helps you learn about crypto market dynamics. It is NOT a prediction, signal, or educational context service.
Current AI Insight: negative 70% 📈
🧠 AI Summary
The ADAUSDT pair has shown a downward trend over the past four hours, with a 1.73% decrease. The price touched a low of $0.2585 and closed the last candle at $0.2606. The EMA indicators show a bearish alignment, with the shorter-term EMAs below the longer-term ones. The MACD histogram has been negative, indicating bearish momentum. The RSI has dipped below 50, suggesting a shift towards bearish sentiment. Volume has been relatively stable, with a slight increase in the last candle. News items ha
📉 Technical Breakdown
EMA — neutral (70%) The EMAs show a bearish alignment with the shorter-term EMAs below the longer-term ones. The EMA_12 and EMA_20 have been converging towards the EMA_50 and EMA_200, suggesting a weakening of bullish momentum.
MACD — neutral (75%) The MACD line has been below the signal line, and the histogram has been negative, indicating bearish momentum. The MACD line has been diverging from the signal line, suggesting continued bearish pressure.
RSI — neutral (60%) The RSI has dipped below 50, indicating a shift towards bearish sentiment. The RSI values have been decreasing, aligning with the downward price action.
Candles — neutral (65%) The candles show a downward trend with the last candle closing above its open, indicating a small recovery. Volume has been consistent with a slight increase in the last candle.
Volume — neutral (65%) Volume has been relatively stable with a slight increase in the last candle. The volume trend confirms the bearish price action, with no significant spikes to indicate a reversal.
News — neutral (50%) The news items have been bullish, hinting at potential positive developments for Cardano. However, the price action has not yet reflected a significant upward movement, suggesting that the news impact may be limited in the short term.
📰 Headlines
1. Cardano Daily Update: 825 Commits Across 70 Repos on Mar 11 — x.com/cardano_updates/status…
2. Cardano Price Eyes Breakout as Hoskinson Hints at ADA Buybacks and 2026 Funding Model — x.com/FXScrypto/status/20319…
3. Cardano Governance Update: Budget Proposals Live, USDCx Now Available — x.com/benohanlon/status/2031…
⚠️ Disclaimer:
Cryptocurrency markets are fast-moving and often confusing. Prices spike or crash with little obvious explanation. News arrives from dozens of fragmented sources. Charts show patterns that are hard to interpret without experience. Vancode.ai brings all of this together in one place so you can learn how these pieces connect — not to tell you what to do, but to help you understand what you're looking at.
🏷️ #ADA #Crypto #AIMarketInsight #VancodeAI
Mar 11

GM DReps,
Budget season is open. @pragma_org Amaru & @blinklabs_io Dingo withdrawal proposals are on-chain. The Budget Process Framework needs your vote. USDCx is live on Cardano.
A lot has moved forward recently, catch up on the latest in Cardano governance with this week’s DRep Newsletter.
drepforum.substack.com/p/bud…

12
1,686
Mar 12
🚨 Latest AI Insights for TRX
Generated by vancode.ai, register free to view reports for your favorite token.
🎓 Educational tool only — Vancode.ai helps you learn about crypto market dynamics. It is NOT a prediction, signal, or educational context service.
Current AI Insight: positive 70% 📈
🧠 AI Summary
The TRXUSDT pair has shown mixed signals over the recent 4-hour period. The price action has been relatively stable, with minor fluctuations. The EMA indicators suggest a gradual upward trend, with the EMA_12 and EMA_20 showing incremental increases. The MACD histogram has been positive but decreasing, indicating a weakening upward momentum. The RSI_14 has dropped from extremely overbought conditions, suggesting a potential pullback. Volume has varied, with a notable spike in the third candle. N
📉 Technical Breakdown
EMA — neutral (70%) The EMA_12 and EMA_20 have been gradually increasing, suggesting a mild upward trend. The EMA_50 and EMA_200 are relatively stable, providing a baseline for the shorter-term EMAs.
MACD — neutral (65%) The MACD line has been above the signal line, with the histogram showing positive values that are gradually decreasing. This indicates a weakening upward momentum.
RSI — neutral (60%) The RSI_14 dropped from extremely overbought conditions (96.53) to 71.54, suggesting a potential pullback after a strong upward move.
Candles — neutral (60%) The candle formations show initial upward movement followed by consolidation. Candle 2 reached a high of $0.2913, while Candle 4 closed at $0.2898, indicating a slight downward pressure.
Volume — neutral (60%) Volume varied across the candles, with a significant spike in Candle 3. This spike coincided with a slight price decrease, indicating profit-taking or resistance at higher levels.
News — neutral (70%) The news items have been bullish, with significant whale activity and network upgrades. Historically, such news has supported price stability and growth.
📰 Headlines
1. 1B USDT Mint on Tron Bullish for BTC and Alts Liquidity — x.com/TheCryptoU/status/2031…
2. Tron Inc. Buys 172K TRX Tokens, Treasury Now Over 686M TRX — x.com/TRON_INC/status/203192…
3. Tether Mints 1B USDT on Tron, Circulating Supply Hits 85.3B — x.com/0xzxcom/status/2031925…
⚠️ Disclaimer:
Cryptocurrency markets are fast-moving and often confusing. Prices spike or crash with little obvious explanation. News arrives from dozens of fragmented sources. Charts show patterns that are hard to interpret without experience. Vancode.ai brings all of this together in one place so you can learn how these pieces connect — not to tell you what to do, but to help you understand what you're looking at.
🏷️ #TRX #Crypto #AIMarketInsight #VancodeAI

🚨 Tether Mints 1 Billion USDT on Tron Network: Report
Analytics platform Lookonchain reported via X that Tether issued 1 billion USDT on the Tron network approximately six hours ago. This move brings the total circulating supply of USDT on Tron to 85.3 billion.
#Tether #USDT #Tron #TRX #CryptoNews #Stablecoin
⏰ Time: 10:41 PM EDT
🔗 Source: x.com/lookonchain/status/203…
1
9
1,435
Mar 12
🚨 Latest AI Insights for LTC
Generated by vancode.ai, register free to view reports for your favorite token.
🎓 Educational tool only — Vancode.ai helps you learn about crypto market dynamics. It is NOT a prediction, signal, or educational context service.
Current AI Insight: negative 70% 📈
🧠 AI Summary
The recent price action for LTCUSDT has shown a decline, with the price touching $54.14 after a 4-hour change of -0.77%. The EMA indicators show a slight bullish tilt, with the EMA_12 and EMA_20 lines above the EMA_50 and EMA_200, suggesting short-term bullish momentum. However, the MACD histogram has decreased, indicating weakening bullish momentum. The RSI_14 dropped significantly from 75.49 to 46.65, signaling a shift from overbought to neutral conditions. Volume has been inconsistent, with a
📉 Technical Breakdown
EMA — neutral (70%) The EMA_12 and EMA_20 are above the EMA_50 and EMA_200, historically indicating short-term bullish momentum. However, the recent price decline suggests a weakening of this momentum.
MACD — neutral (75%) The MACD histogram has decreased, showing a reduction in bullish momentum. The MACD line is still above the signal line, but the gap is narrowing.
RSI — neutral (80%) The RSI_14 has dropped from overbought territory to neutral, indicating a significant reduction in bullish momentum and potential for further downside.
Candles — neutral (80%) The candle formations show a downward trend with the last candle closing below the open, indicating selling pressure. Volume has decreased in the last candle, confirming the bearish price action.
Volume — neutral (85%) Volume has decreased in the last candle, confirming the bearish price action. This aligns with the downward trend observed in the price.
News — neutral (60%) The bullish news suggested a potential breakout, but the recent price action has not supported this. The news source has medium credibility, impacting sentiment but not fundamentally driving price.
📰 Headlines
1. Litecoin Official Giveaway: Win a Custom Mug — x.com/litecoin/status/203181…
2. Litecoin Bounces Off Support, Eyes $100-110 Breakout — x.com/WHALES_CRYPTOt/status/…
3. Litecoin Boasts Broad Distribution with Millions of Holders — x.com/SantoXBT/status/203169…
⚠️ Disclaimer:
Cryptocurrency markets are fast-moving and often confusing. Prices spike or crash with little obvious explanation. News arrives from dozens of fragmented sources. Charts show patterns that are hard to interpret without experience. Vancode.ai brings all of this together in one place so you can learn how these pieces connect — not to tell you what to do, but to help you understand what you're looking at.
🏷️ #LTC #Crypto #AIMarketInsight #VancodeAI

$LTC distribution is broader than most people think
• ~4.19M addresses hold <0.001 LTC
• ~1.24M addresses hold 0.1–1 LTC
• ~718K addresses hold 1–10 LTC
Meanwhile, only ~106 addresses hold 100K–1M LTC
Wide distribution, millions of holders, strong network base

1
1
13
1,445
Mar 12
🚨 Latest AI Insights for ETH
Generated by vancode.ai, register free to view reports for your favorite token.
🎓 Educational tool only — Vancode.ai helps you learn about crypto market dynamics. It is NOT a prediction, signal, or educational context service.
Current AI Insight: negative 75% 📈
🧠 AI Summary
The recent price action of ETHUSDT has shown a bearish trend, with the price declining by 1.29% over the past 4 hours. The EMA indicators reveal that the shorter-term EMAs (12 and 20) are below the longer-term EMAs (50 and 200), suggesting a downward trend. The MACD histogram has turned negative, indicating that the selling pressure is increasing. The RSI has dropped below 40, further confirming the bearish sentiment. Volume has been inconsistent, with a notable spike in the second candle, which
📉 Technical Breakdown
EMA — neutral (85%) The EMA_12 and EMA_20 have crossed below the EMA_50 and EMA_200, signaling a bearish trend. The EMA_12 and EMA_20 have also diverged from each other, indicating weakening bullish momentum.
MACD — neutral (90%) The MACD line has fallen below the signal line, and the histogram has turned negative, suggesting that the bearish momentum is gaining strength.
RSI — neutral (88%) The RSI has declined from above 66 to below 40, indicating a shift from overbought to oversold conditions, which aligns with the bearish price action.
Candles — neutral (80%) The candle formations show initial bullish attempts with the first two candles closing above their open, but the subsequent candles closed lower, with the fourth candle forming a bearish close below its open.
Volume — neutral (70%) Volume has not shown a consistent trend, with a spike in the second candle followed by a decrease in the subsequent candles, which correlates with the price peaking and then declining.
News — neutral (75%) The news has had a mixed impact, with bearish headlines about whale transfers and scam dust attacks correlating with price declines, while bullish news about institutional adoption and whale activity on Polymarket has not been sufficient to reverse the downward trend.
📰 Headlines
1. Binance Launches March ETH Leaderboard: 10M SHELL Rewards for ETH Flexible Products — x.com/binance/status/2031648…
2. Binance Launches March ETH Leaderboard with 10M SHELL Rewards — x.com/binance/status/2031641…
3. Smart Trader pension-usdt.eth Shorts BTC/ETH, Longs Oil with $89.2M Positions — x.com/lookonchain/status/203…
⚠️ Disclaimer:
Cryptocurrency markets are fast-moving and often confusing. Prices spike or crash with little obvious explanation. News arrives from dozens of fragmented sources. Charts show patterns that are hard to interpret without experience. Vancode.ai brings all of this together in one place so you can learn how these pieces connect — not to tell you what to do, but to help you understand what you're looking at.
🏷️ #ETH #Crypto #AIMarketInsight #VancodeAI
Mar 11

Smart trader pension-usdt.eth is shorting $BTC and $ETH, while going long on #oil.
Positions:
1,000 $BTC($69.55M)
8,950 $ETH($18.07M)
30,000 xyz:CL($2.59M)
Since March 1, pension-usdt.eth has had 12 wins in a row.
His total profit is ~$27M, with a win rate of 85%.
hypurrscan.io/address/0x0ddf…
1
17
1,586
Mar 12
🚨 Latest AI Insights for DOGE
Generated by vancode.ai, register free to view reports for your favorite token.
🎓 Educational tool only — Vancode.ai helps you learn about crypto market dynamics. It is NOT a prediction, signal, or educational context service.
Current AI Insight: negative 85% 📈
🧠 AI Summary
The DOGEUSDT pair has shown a slight negative trend over the last four hours, with a 0.23% decrease in price. The EMA indicators have maintained a descending order (EMA_12 > EMA_20 > EMA_50 > EMA_200), suggesting a bearish alignment. The MACD histogram has remained negative, indicating sustained downward momentum. The RSI_14 has fluctuated but remained below the 50 mark, reinforcing the bearish sentiment. Volume has decreased, which typically suggests waning buying pressure. News sentiment was m
📉 Technical Breakdown
EMA — neutral (88%) The EMAs have maintained a bearish alignment with EMA_12 crossing below EMA_20 and EMA_50, and all EMAs below EMA_200, suggesting a sustained downtrend.
MACD — neutral (85%) The MACD line has remained below the signal line, and the histogram has stayed negative, indicating continued bearish momentum.
RSI — neutral (80%) The RSI_14 has fluctuated but remained below 50, indicating a lack of strong bullish momentum and reinforcing the bearish trend.
Candles — neutral (90%) The candle formations show a bearish engulfing pattern followed by a series of smaller bearish candles, indicating a consistent downward pressure.
Volume — neutral (82%) Volume has decreased over the candles, which typically suggests reduced buying pressure and supports the bearish trend.
News — neutral (70%) News sentiment was mixed with some bullish and bearish headlines, but the overall impact on price was minimal, suggesting that the market was more influenced by technical factors.
📰 Headlines
1. Large $327K DOGE Long Position on Binance Futures — x.com/TraderMapio/status/203…
2. $222K DOGE Long Position Liquidated on Bybit — x.com/TraderMapio/status/203…
3. Major Whale $978K DOGE Long on Binance Futures — x.com/TraderMapio/status/203…
⚠️ Disclaimer:
Cryptocurrency markets are fast-moving and often confusing. Prices spike or crash with little obvious explanation. News arrives from dozens of fragmented sources. Charts show patterns that are hard to interpret without experience. Vancode.ai brings all of this together in one place so you can learn how these pieces connect — not to tell you what to do, but to help you understand what you're looking at.
🏷️ #DOGE #Crypto #AIMarketInsight #VancodeAI
Mar 11
🐋 WHALE ALERT 🐋
🟢 $DOGE LONG
💰 Volume: $978K
💵 Price: $0.0927
🏦 Exchange: BINANCE FUTURES
see all whale moves in real time 👉 tradermap.io/trades

13
1,632