Jacob Thebeau retweeted

15h
Miley Cyrus says EMDR therapy changed her life.
She did the train visualization thing, watching her memories pass by like a movie in her mind, and after the first session, her stage fright was completely gone. Never came back.
She also realized the intense need to be loved that she’d been carrying wasn’t even fully hers… it was her mom’s. She’d been holding it for her.
EMDR (Eye Movement Desensitization and Reprocessing) is a type of therapy that helps your brain reprocess traumatic or painful memories using guided eye movements so they stop having such a strong emotional grip on you.
Sometimes the heaviest things we carry aren’t even ours, they’re just emotions we inherited from the people we love.
10
88
1,094
104,579

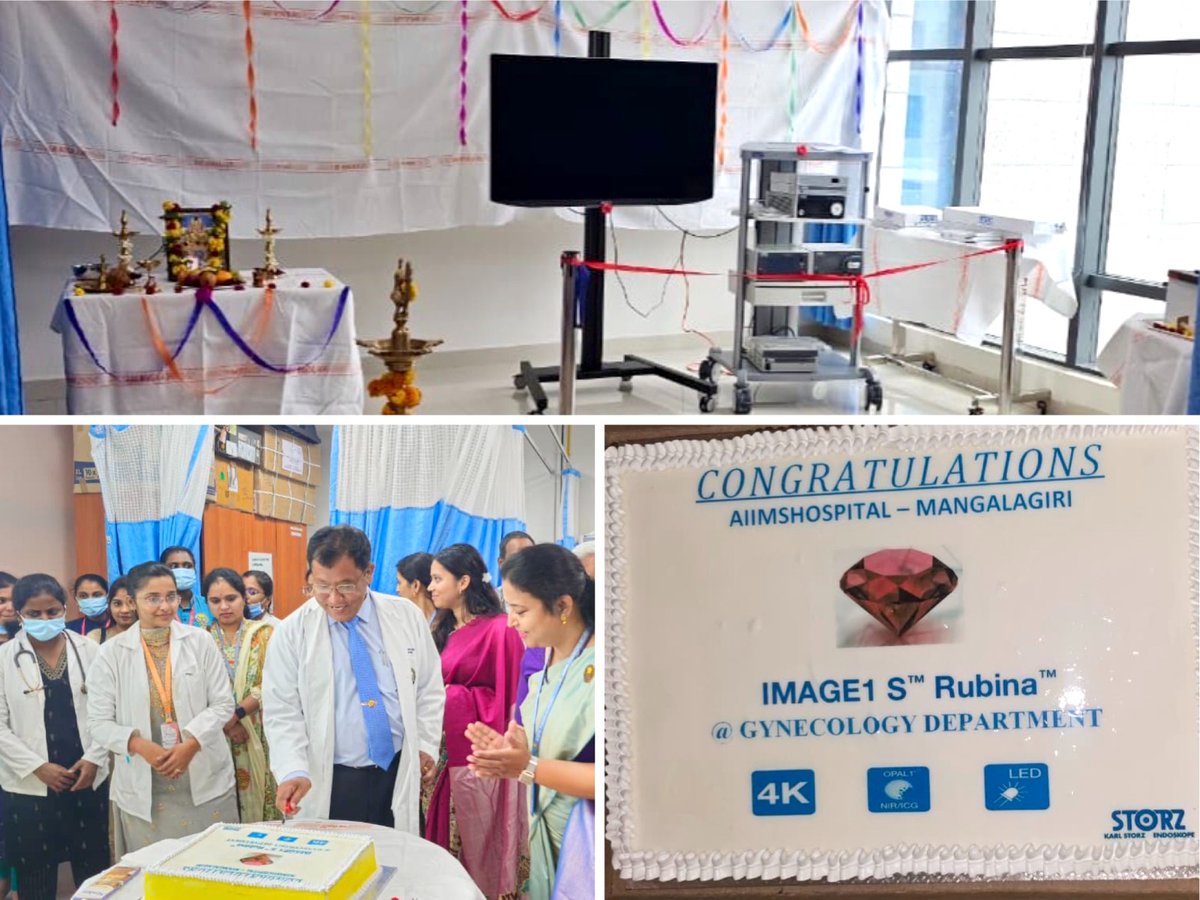
Prof. (Dr.) Ahanthem Santa Singh, Executive Director & CEO, AIIMS Mangalagiri, inaugurated the state-of-the-art 3D 4K Laparoscopic Visualization System in the Department of Obstetrics & Gynecology.
@MoHFW_INDIA
@JPNadda
#AIIMSMangalagiri #HealthcareInnovation

1
1

|| For example, with Jake's concept art in Resident Evil, they could use AI as a visualization tool to preview what the final character model might look like before moving forward with development.


2

“ VISUALIZATION DESIGNER • WORDSMITH • SATIRIST • CREATIVE DIRECTOR”
law advocacy ? Anything else? 😭🤡
= nasty, bitter old chap, 60 , going nowhere professionally, just spitting hate online at one of the most dynamic/popular young politicians in the USA… quietly tragic

2
swiccho retweeted

Jun 12
A visualization of the pollution created when tires are burned.
751
2,242
20,335
3,589,780
Wesley Moço retweeted

Jun 13
The R programming language is, in my opinion, the best tool for statistical analysis and data visualization. Its extensive libraries and powerful capabilities make complex data tasks easier and more efficient.
Take a look at the visualizations featured in this post. All graphs were created using R and showcase various statistical analysis results. Looks fantastic, doesn’t it?
Are you looking to take your statistics and R programming skills to the next level? I’ve created a comprehensive course on Statistical Methods in R.
By enrolling in the course, you’ll receive lifetime access to:
- 20 video lessons on statistical methods and their application in R.
- An exclusive group chat for questions, support, and networking.
- Quizzes, projects, scripts, and additional resources to enhance your skills.
Ready to dive deeper into statistics and R programming? Learn more: statisticsglobe.com/online-c…
#RStats #DataScience #datavis #R #DataVisualization #datastructure #programming

16
74
1,718
lartnestpasdemain retweeted

"This visualization shows the Flower of Life (19 circles) emerging from prime number behavior.
Primes don’t just exist randomly they follow rules from a deeper 2^a × 3^b lattice.
When you let that lattice express itself geometrically, you get the exact interlocking circle patterns our ancestors drew thousands of years ago.
The animation shows tracers starting from the center and building the structure shell by shell (center → 7 circles → full 19). It suggests these sacred symbols were mathematical, not just mystical maps of how number and resonance organize reality."
zenodo.org/records/20680281
ctftheory.com/walter-russell…
6
10
55
1,989

Tactile heatmap, center of pressure, and force vector visualization of PaXini PX-6AX GEN3.
2
65
Harrison Alewine retweeted

Just nailed the first set of Python data visualization exercises! Finally get how Matplotlib bar charts work—time to level up to seaborn tomorrow. #LearningPython #DataScience,

1
2
5


"Visualization of success"
एक छोटी कहानी के जरिए बहुत अच्छी तरह से आपने समझा दिया। 👌
1
15
Erika retweeted

A visualization of the pollution created when tires are burned.
15
64
340
29,215