
11 Aug 2024
🔥 Exciting new #geemap features: Create interactive charts from #EarthEngine data with just a few lines of Python 📊 The new charting functions provide a similar API to the EarthEngine JavaScript ui.Chart, making data visualization a breeze 🥳 Check out the details in this pull request:
github.com/gee-community/gee…
#geospatial #bqplot
4
61
291
25,568

31 May 2023
The pre-cursor to flask-ipywidgets was a total hack using bqplot and flask, and led to a call with @SylvainCorlay which got this whole thing started.
2
51

12 Jan 2023
Interactive chart visualizations using #Python and #bqplot - visualizing S&P500 returns bit.ly/3XtFb1f #100daysofcode #day15
3
122

11 Nov 2022
Want to create interactive charts in Python Jupyter Notebooks?
Well, Python Data Viz library "Bqplot" can help you with that.
Check out our video to learn plotting using bqplot.
#python3 #dataviz #DataVisualization #DataScience
youtube.com/watch?v=tufOz_Lp…

3
3


18 Aug 2022
7 Faydalı Python Kütüphanesi
Projelerinizi şu kütüphanelerle güçlendirin:
1. pytype
2. bqplot
3. py-spy
4. jsonschema
5. blaze
6. pudb
7. kornia
🔗 python.plainenglish.io/7-use…
👨🏻💻 Python Eğitimim 17-18 Eylül'de. Ağustos İndiriminden Faydalanın:
🔗 zaferdemirkol.com/egitim/pyt…
3

25 Jul 2022
There’s some similar examples (moving vline in a plot) using ipytone bqplot, but I guess it would be possible to use it with bokeh widgets too (and holoviews, hvplot, etc.) since it is interoperable with ipywidgets?
1
3
24 Jun 2022
Create Interactive Plots in Python using "bqplot". It's a data viz library from Bloomberg built on top of "ipywidgets".
#Python #Python3 #DataVisualization #DataScience
coderzcolumn.com/tutorials/d…
2
2
8 Jun 2022
In this example, the pitch of a synth follows the curve of global CO2 concentrations, while another synth plays small notes following the curve of global main air temperature.
(inspired from youtube.com/watch?v=ONuA9Hmk…, made with bqplot)
6/N
1
5
17
8 Jun 2022
The stars and galaxies in this deep space image (taken by Hubble) are turned into sound with frequencies on y-axis, time on x-axis and gain modulated by light intensity.
(inspired from nasa.gov/content/explore-fro…, made with bqplot and scikit-image)
5/N
1
1
14
15 May 2022
bqplot [Python] - Interactive Plots using Internal Object Model API. Bqplot is an interactive plotting library from Bloomberg.
#Python #pythonprogramming #pythoncode #Python3 #pythonlearning
coderzcolumn.com/tutorials/d…
1
3
30 Apr 2022
Interactive Choropleth Maps [Python] using bqplot
#Python #pythonprogramming #pythonlearning
coderzcolumn.com/tutorials/d…
1
5
27 Apr 2022
bqplot [Python] - Interactive Plots using Internal Object Model API
#pythonprogramming #pythonlearning #Python
coderzcolumn.com/tutorials/d…
2
2
25 Apr 2022
How to put the chart into the tooltip of another chart in bqplot [Python]?
#pythonprogramming #pythonlearning
coderzcolumn.com/tutorials/d…
1
2

#bqplot running entirely in the browser 😍🥰
27 Jan 2022

JupyterLite is a JupyterLab distribution that runs entirely in the browser built from the ground-up using JupyterLab components and extensions.
Demo jupyterlite.github.io/demo/l…
github.com/jupyterlite/jupyt…
1
7


28 Jan 2022
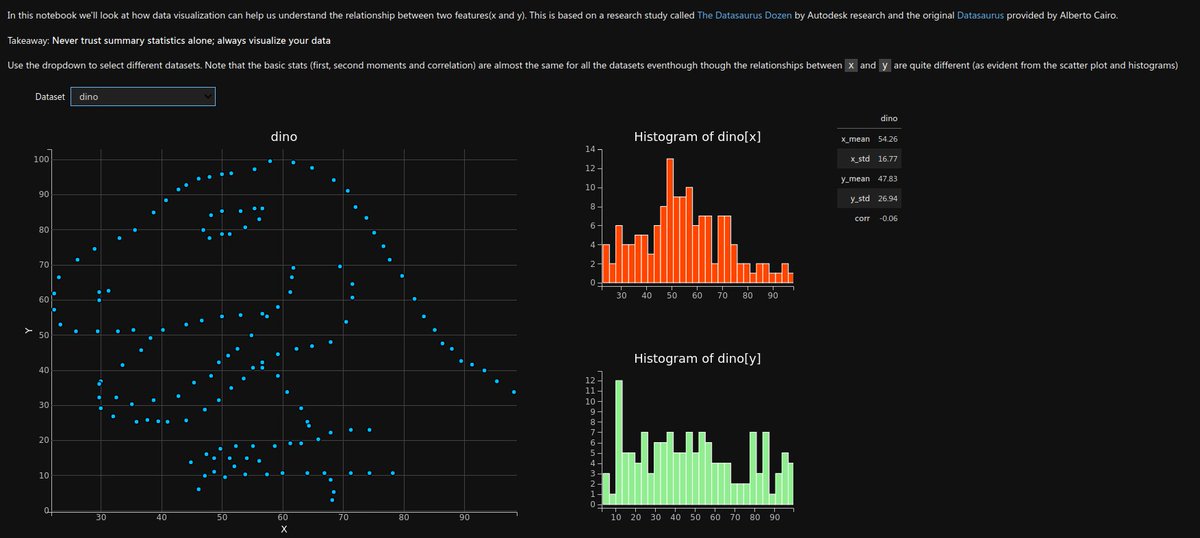
Dados diferentes com estatísticas descritivas semelhantes, mas com distribuições muito distintas. Na galeria de exemplos do @bqplot, mais uma ferramenta para ilustrar a recomendação:
"Never trust summary statistics alone; always visualize your data".
bqplot.github.io/bqplot-gall…
1
12
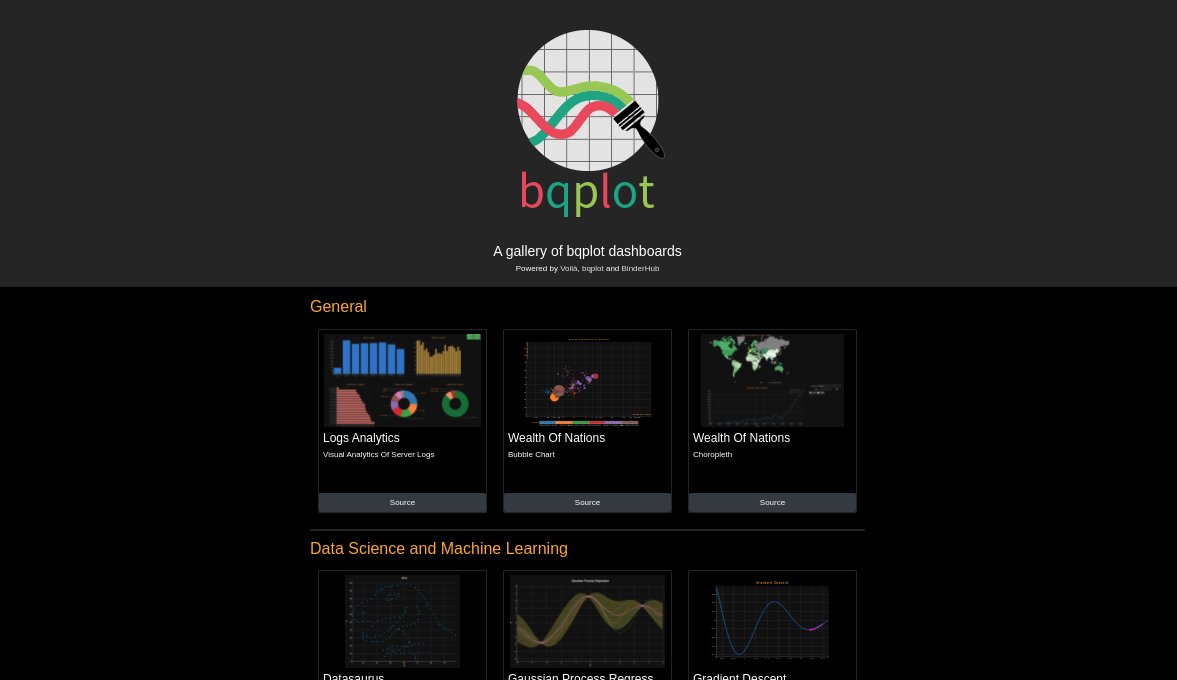
We have a new gallery website! 🥰
bqplot.github.io/bqplot-gall…
Powered by #Voila and #BinderHub
#Python @ProjectJupyter #bqplot @mybinderteam
2
18
42

12 Jan 2022
I created a new template for @ProjectJupyter 's #voila, reusing the retrolab styling to provide a nicer interface for your dashboards 😁
github.com/martinRenou/voila…
github.com/jupyterlab/retrol…
#python #dashboard @bqplot
1
17