
Top 100 Data Analytics Interview Questions 📊
SQL Interview Questions
1. What is SQL?
2. What is the difference between SQL and MySQL?
3. What are primary keys and foreign keys?
4. What is normalization?
5. What is denormalization?
6. Difference between WHERE and HAVING?
7. Difference between DELETE, DROP, and TRUNCATE?
8. Difference between INNER JOIN and LEFT JOIN?
9. What is RIGHT JOIN?
10. What is FULL OUTER JOIN?
11. What is SELF JOIN?
12. What is CROSS JOIN?
13. What are aggregate functions?
14. Difference between COUNT and COUNT DISTINCT?
15. What is GROUP BY?
16. Difference between GROUP BY and ORDER BY?
17. What is a subquery?
18. What are CTEs?
19. What are window functions?
20. Explain ROW_NUMBER().
21. Explain RANK() and DENSE_RANK().
22. What are indexes?
23. What causes slow SQL queries?
24. How do you optimize SQL queries?
25. What are views?
26. What are stored procedures?
27. What are transactions?
28. Explain ACID properties.
29. Find duplicate records in SQL.
30. Find second-highest salary using SQL.
31. Calculate running totals using SQL.
32. Find top-selling products using SQL.
33. Calculate month-over-month growth.
34. Difference between UNION and UNION ALL?
35. What are NULL values?
36. Difference between CHAR and VARCHAR?
37. What is a primary key?
38. What is a foreign key?
39. Difference between clustered and non-clustered indexes?
40. Explain query execution plans.
*Excel Interview Questions*
41. What is VLOOKUP?
42. Difference between VLOOKUP and XLOOKUP?
43. What are Pivot Tables?
44. What are slicers in Excel?
45. Explain conditional formatting.
46. Difference between COUNT, COUNTA, and COUNTIF?
47. What are absolute and relative references?
48. What is data validation?
49. Explain IFERROR().
50. What is Power Query?
51. What are dashboards in Excel?
52. Difference between SUMIF and SUMIFS?
53. Explain INDEX MATCH.
54. What are macros?
55. What is VBA?
56. How do you clean data in Excel?
57. How do you remove duplicates?
58. What is flash fill?
59. What are named ranges?
60. Explain text functions in Excel.
61. What are charts in Excel?
62. How do you create dynamic dashboards?
63. What is Goal Seek?
64. What is Solver?
65. Explain What-If Analysis.
*Power BI Interview Questions*
66. What is Power BI?
67. Difference between Power BI Desktop and Service?
68. What is DAX?
69. What is Power Query?
70. What are calculated columns?
71. Difference between measures and calculated columns?
72. Explain relationships in Power BI.
73. What is star schema?
74. What is snowflake schema?
75. What are slicers?
76. What are bookmarks?
77. What is drill-through?
78. Explain row-level security.
79. What are KPIs?
80. Difference between dashboard and report?
81. What is data modeling?
82. Explain CALCULATE().
83. Explain FILTER().
84. Explain ALL().
85. Explain time intelligence functions.
86. What is incremental refresh?
87. Difference between Import and DirectQuery?
88. Explain Power BI gateways.
89. How do you optimize dashboards?
90. What causes slow reports?
91. How do you handle large datasets?
92. What are custom visuals?
93. Explain workspace management.
94. How do you publish reports?
95. Explain deployment pipelines.
*Tableau Interview Questions*
96. What is Tableau?
97. Difference between Tableau and Power BI?
98. What are dimensions and measures?
99. Explain Tableau filters.
100. What are calculated fields?
FOR PART 2 COMMENT "INTERVIEW"
6
27
140
4,277
🚀 Power BI Roadmap — Topic 4
📊 Power BI Basics
In this section, you'll learn:
- How Power BI works
- The Power BI ecosystem
- Connecting data
- Creating your first report
- Understanding the Power BI interface
📌 1. What is Power BI?
Microsoft Power BI is a Business Intelligence (BI) and Data Visualization platform developed by Microsoft.
It helps organizations:
✔ Analyze data
✔ Create reports
✔ Build dashboards
✔ Share insights
✔ Make data-driven decisions
📌 2. Components of Power BI
Power BI consists of three major components.
🔹 Power BI Desktop
Used for: Creating reports, Building data models, Writing DAX, Data transformation
👉 This is where developers spend most of their time.
🔹 Power BI Service
Cloud-based platform used for: Publishing reports, Sharing dashboards, Scheduled refresh, Collaboration
🔹 Power BI Mobile
- Used for: Viewing reports, Monitoring KPIs, Accessing dashboards on mobile devices
📌 3. Installing Power BI Desktop
Download Options:* Microsoft Store, Official Microsoft website
Installation Steps:
1. Download installer
2. Run setup
3. Complete installation
4. Launch Power BI Desktop
📌 4. Understanding the Power BI Interface
When Power BI opens, you'll see:
Main Sections:
Area | Purpose
Ribbon | Commands & tools
Report Canvas | Build visualizations
Fields Pane | Tables & columns
Visualizations Pane | Charts & visuals
Filters Pane | Filtering
📌 5. Three Main Views in Power BI
🔹 Report View
Used to:
✔ Create reports,
✔ Add charts,
✔ Build dashboards
Icon: 📄 Report
Most work happens here.
🔹 Data View
Used to:
✔ Inspect data,
✔ Create calculated columns,
✔ Verify loaded tables
Icon: 📋 Table
🔹 Model View
Used to:
✔ Create relationships,
✔ Build star schemas,
✔ Manage data models
Icon: 🔗 Relationship
📌 6. Connecting Data Sources
Power BI supports hundreds of data sources.
Common Sources:
Files: ✔ Excel, ✔ CSV, ✔ XML, ✔ JSON
Databases: ✔ SQL Server, ✔ MySQL, ✔ PostgreSQL, ✔ Oracle
Cloud: ✔ Azure, ✔ SharePoint, ✔ Google Analytics
Web: ✔ APIs, ✔ Websites
📌 7. Get Data Process
Steps:
1. Click "Get Data"
2. Choose source
3. Connect
4. Load or Transform
Example:
Excel File: Sales.xlsx
Power BI imports: Sheets, Tables, Named Ranges
📌 8. Import vs DirectQuery vs Live Connection
🔹 Import Mode
Data is loaded into Power BI memory.
Advantages:
✅ Fast performance,
✅ Full DAX support,
✅ Better user experience
Disadvantages:
❌ Requires refresh
🔹 DirectQuery
Data remains in database.
Advantages:
✅ Real-time data
Disadvantages:
❌ Slower performance
🔹 Live Connection
Direct connection to enterprise models.
Example: SSAS Tabular Models
📌 9. Loading Data
After connecting:
Options:
Load: Directly loads data
Transform Data: Opens Power Query Editor
Used for:
✔ Cleaning data,
✔ Removing duplicates,
✔ Formatting columns
👉 In real projects, you'll often choose Transform Data first.
📌 10. Creating Your First Visualization
Suppose you have:
Product | Sales
Laptop | 50000
Phone | 30000
Create Bar Chart:
1. Select Bar Chart
2. Drag Product → Axis
3. Drag Sales → Values
Power BI automatically generates a chart.
📌 11. Understanding Visualizations Pane
Contains Charts:
✔ Bar Chart,
✔ Column Chart,
✔ Line Chart,
✔ Pie Chart,
✔ Area Chart,
✔ Scatter Plot
Advanced Visuals:
✔ KPI Card,
✔ Gauge,
✔ Waterfall,
✔ Funnel,
✔ Matrix
📌 12. Understanding Fields Pane
Shows: Tables, Columns, Measures
Example:
Sales Table
├─ Product
├─ Quantity
├─ Revenue
Used to build visuals.
📌 13. Understanding Filters Pane
Three levels:
Visual-Level Filter: Affects one visual
Page-Level Filter: Affects one page
Report-Level Filter: Affects entire report
📌 14. Saving Power BI Files
File Extension: .pbix
Contains:
✔ Data,
✔ Model,
✔ DAX,
✔ Reports
📌 15. Publishing Reports
Steps:
1. Save PBIX
2. Click Publish
3. Sign in
4. Select Workspace
5. Publish
Report becomes available in Power BI Service.
📌 16. First Mini Dashboard
Create:
KPI Cards: Total Sales, Total Orders
Charts: Sales by Product, Sales by Region
Filters: Region, Month
📌 17. Common Beginner Mistakes
❌ Loading unnecessary columns
❌ Ignoring data types
❌ Using too many visuals
❌ Poor naming conventions
❌ Skipping Power Query cleaning
📌 18. Practice Project
🛒 Sales Dashboard
Dataset: Product, Region, Sales
Tasks:
✔ Import Excel Data
✔ Create: Bar Chart, Line Chart, KPI Cards
✔ Add Filters
✔ Publish Report
📌 19. Interview Questions
1. What is Power BI?
2. Difference between Desktop and Service?
3. What are the three views in Power BI?
4. What is Import Mode?
5. What is DirectQuery?
6. What is a PBIX file?
7. How do you publish reports?
8. What is a Workspace?
9. What is Power Query?
10. What is a Dashboard?
🎯 Goal of This Topic
After this topic you should be able to:
✅ Install Power BI
✅ Connect data sources
✅ Load data
✅ Create visualizations
✅ Build simple dashboards
✅ Publish reports
Double Tap ❤️ For Part-5

2
6
40
4,220

Jun 11
🟩 Phase 10: Performance Optimization
Critical for enterprise projects.
📚 Learn:
✔ Performance Analyzer
✔ DAX Optimization
✔ Query Reduction
✔ Aggregation Tables
✔ Incremental Refresh
✔ Composite Models
✔ DirectQuery Optimization
Tools
✔ DAX Studio
✔ VertiPaq Analyzer
🎯 Goal:
Build fast and scalable reports.
1
29
Jun 11
🔵 Phase 4: Power BI Basics
Now start learning Power BI itself.
📚 Learn:
Installation & Interface
✔ Install Power BI Desktop
✔ Understand Interface
✔ Home Ribbon
✔ Report View
✔ Data View
✔ Model View
Data Loading
✔ Import Data
✔ DirectQuery
✔ Live Connection
✔ Connect to:
- Excel
- CSV
- SQL Server
- APIs
- Web Data
Practice
✔ Load sample datasets
✔ Explore tables and visuals
🎯 Goal:
Become comfortable using Power BI Desktop.
1
59

Jun 10
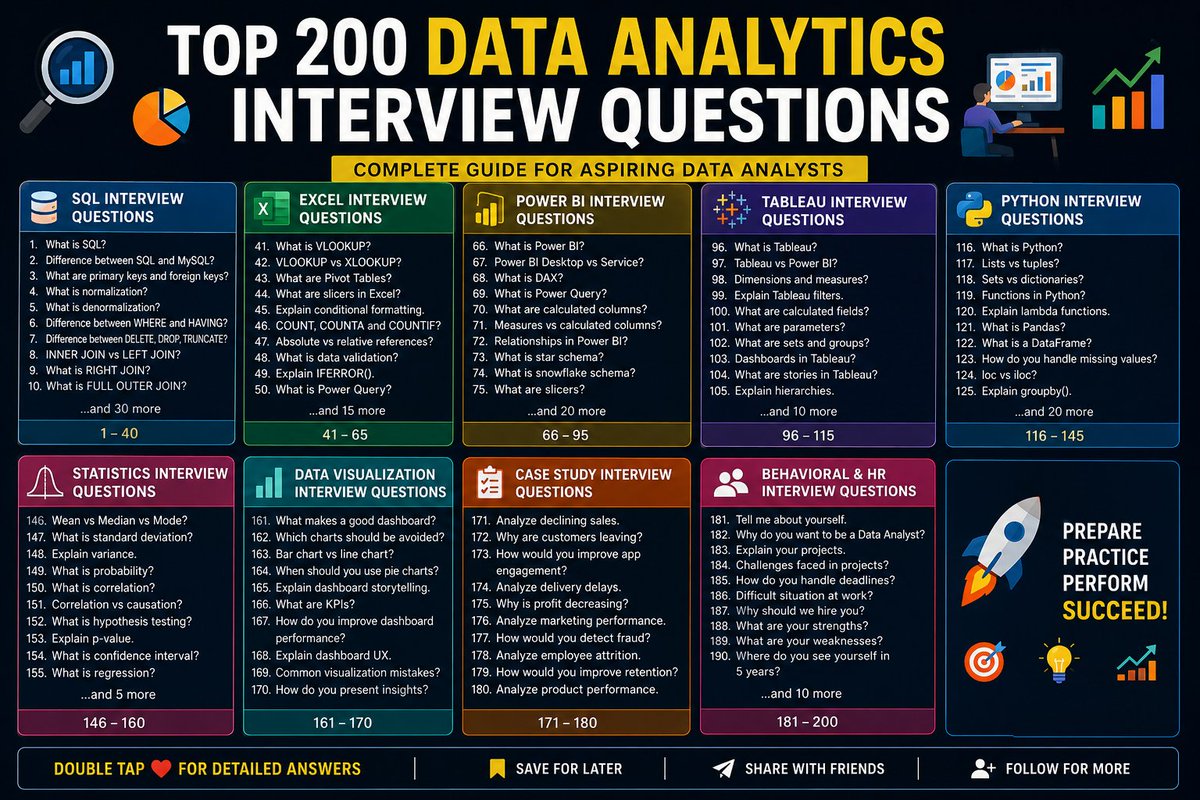
🚀 Top 200 Data Analytics Interview Questions 📊
SQL Interview Questions
1. What is SQL?
2. What is the difference between SQL and MySQL?
3. What are primary keys and foreign keys?
4. What is normalization?
5. What is denormalization?
6. Difference between WHERE and HAVING?
7. Difference between DELETE, DROP, and TRUNCATE?
8. Difference between INNER JOIN and LEFT JOIN?
9. What is RIGHT JOIN?
10. What is FULL OUTER JOIN?
11. What is SELF JOIN?
12. What is CROSS JOIN?
13. What are aggregate functions?
14. Difference between COUNT and COUNT DISTINCT?
15. What is GROUP BY?
16. Difference between GROUP BY and ORDER BY?
17. What is a subquery?
18. What are CTEs?
19. What are window functions?
20. Explain ROW_NUMBER().
21. Explain RANK() and DENSE_RANK().
22. What are indexes?
23. What causes slow SQL queries?
24. How do you optimize SQL queries?
25. What are views?
26. What are stored procedures?
27. What are transactions?
28. Explain ACID properties.
29. Find duplicate records in SQL.
30. Find second-highest salary using SQL.
31. Calculate running totals using SQL.
32. Find top-selling products using SQL.
33. Calculate month-over-month growth.
34. Difference between UNION and UNION ALL?
35. What are NULL values?
36. Difference between CHAR and VARCHAR?
37. What is a primary key?
38. What is a foreign key?
39. Difference between clustered and non-clustered indexes?
40. Explain query execution plans.
Excel Interview Questions
41. What is VLOOKUP?
42. Difference between VLOOKUP and XLOOKUP?
43. What are Pivot Tables?
44. What are slicers in Excel?
45. Explain conditional formatting.
46. Difference between COUNT, COUNTA, and COUNTIF?
47. What are absolute and relative references?
48. What is data validation?
49. Explain IFERROR().
50. What is Power Query?
51. What are dashboards in Excel?
52. Difference between SUMIF and SUMIFS?
53. Explain INDEX MATCH.
54. What are macros?
55. What is VBA?
56. How do you clean data in Excel?
57. How do you remove duplicates?
58. What is flash fill?
59. What are named ranges?
60. Explain text functions in Excel.
61. What are charts in Excel?
62. How do you create dynamic dashboards?
63. What is Goal Seek?
64. What is Solver?
65. Explain What-If Analysis.
Power BI Interview Questions
66. What is Power BI?
67. Difference between Power BI Desktop and Service?
68. What is DAX?
69. What is Power Query?
70. What are calculated columns?
71. Difference between measures and calculated columns?
72. Explain relationships in Power BI.
73. What is star schema?
74. What is snowflake schema?
75. What are slicers?
76. What are bookmarks?
77. What is drill-through?
78. Explain row-level security.
79. What are KPIs?
80. Difference between dashboard and report?
81. What is data modeling?
82. Explain CALCULATE().
83. Explain FILTER().
84. Explain ALL().
85. Explain time intelligence functions.
86. What is incremental refresh?
87. Difference between Import and DirectQuery?
88. Explain Power BI gateways.
89. How do you optimize dashboards?
90. What causes slow reports?
91. How do you handle large datasets?
92. What are custom visuals?
93. Explain workspace management.
94. How do you publish reports?
95. Explain deployment pipelines.
Tableau Interview Questions
96. What is Tableau?
97. Difference between Tableau and Power BI?
98. What are dimensions and measures?
99. Explain Tableau filters.
100. What are calculated fields?
101. What are parameters?
102. What are sets and groups?
103. Explain dashboards in Tableau.
104. What are stories in Tableau?
105. Explain hierarchies.
106. What is Tableau Prep?
107. Difference between live and extract connections?
108. Explain joins and blending.
109. What are LOD expressions?
110. Explain table calculations.
111. What are actions in Tableau?
112. How do you optimize dashboards?
113. Explain context filters.
114. What is dual-axis chart?
115. Explain data source filters.
Python Interview Questions
116. What is Python?
117. Difference between lists and tuples?
118. Difference between sets and dictionaries?
119. What are functions in Python?
120. Explain lambda functions.
121. What is Pandas?
122. What is a DataFrame?
123. How do you handle missing values?
124. Difference between loc and iloc?
125. Explain groupby().
126. What is NumPy?
127. Difference between NumPy arrays and lists?
128. Explain vectorization.
129. What is broadcasting?
130. Explain array indexing.
131. What is Matplotlib?
132. What is Seaborn?
133. Difference between bar chart and histogram?
134. Explain box plots.
135. Explain scatter plots.
136. How do you remove duplicates in Python?
137. How do you detect outliers?
138. Explain feature engineering.
139. How do you merge datasets?
140. How do you export data?
141. What is exception handling?
142. Explain try-except blocks.
143. What are APIs?
144. How do you automate reports?
145. Explain web scraping basics.
Statistics Interview Questions
146. Mean vs Median vs Mode?
147. What is standard deviation?
148. Explain variance.
149. What is probability?
150. What is correlation?
151. Difference between correlation and causation?
152. What is hypothesis testing?
153. Explain p-value.
154. What is confidence interval?
155. What is regression?
156. What is A/B testing?
157. Explain normal distribution.
158. What are outliers?
159. What is sampling?
160. Explain Type I and Type II errors.
Data Visualization Interview Questions
161. What makes a good dashboard?
162. Which charts should be avoided?
163. Difference between bar and line charts?
164. When should you use pie charts?
165. Explain dashboard storytelling.
166. What are KPIs?
167. How do you improve dashboard performance?
168. Explain dashboard UX.
169. What are common visualization mistakes?
170. How do you present insights to stakeholders?
Case Study Interview Questions
171. Analyze declining sales.
172. Why are customers leaving a platform?
173. How would you improve app engagement?
174. Analyze delivery delays.
175. Why is profit decreasing?
176. Analyze marketing campaign performance.
177. How would you detect fraud?
178. Analyze employee attrition.
179. How would you improve customer retention?
180. Analyze product performance.
Behavioral & HR Interview Questions
181. Tell me about yourself.
182. Why do you want to become a Data Analyst?
183. Explain your projects.
184. What challenges did you face in projects?
185. How do you handle deadlines?
186. Explain a difficult situation at work.
187. Why should we hire you?
188. What are your strengths?
189. What are your weaknesses?
190. Where do you see yourself in 5 years?
191. Explain your career gap.
192. Why are you switching careers?
193. Explain your resume.
194. How do you handle pressure?
195. Explain teamwork experience.
196. How do you deal with conflicts?
197. Describe leadership experience.
198. Explain a project failure.
199. How do you prioritize tasks?
200. Do you have any questions for us?
Bookmark This For Later 🔖
1
1
261

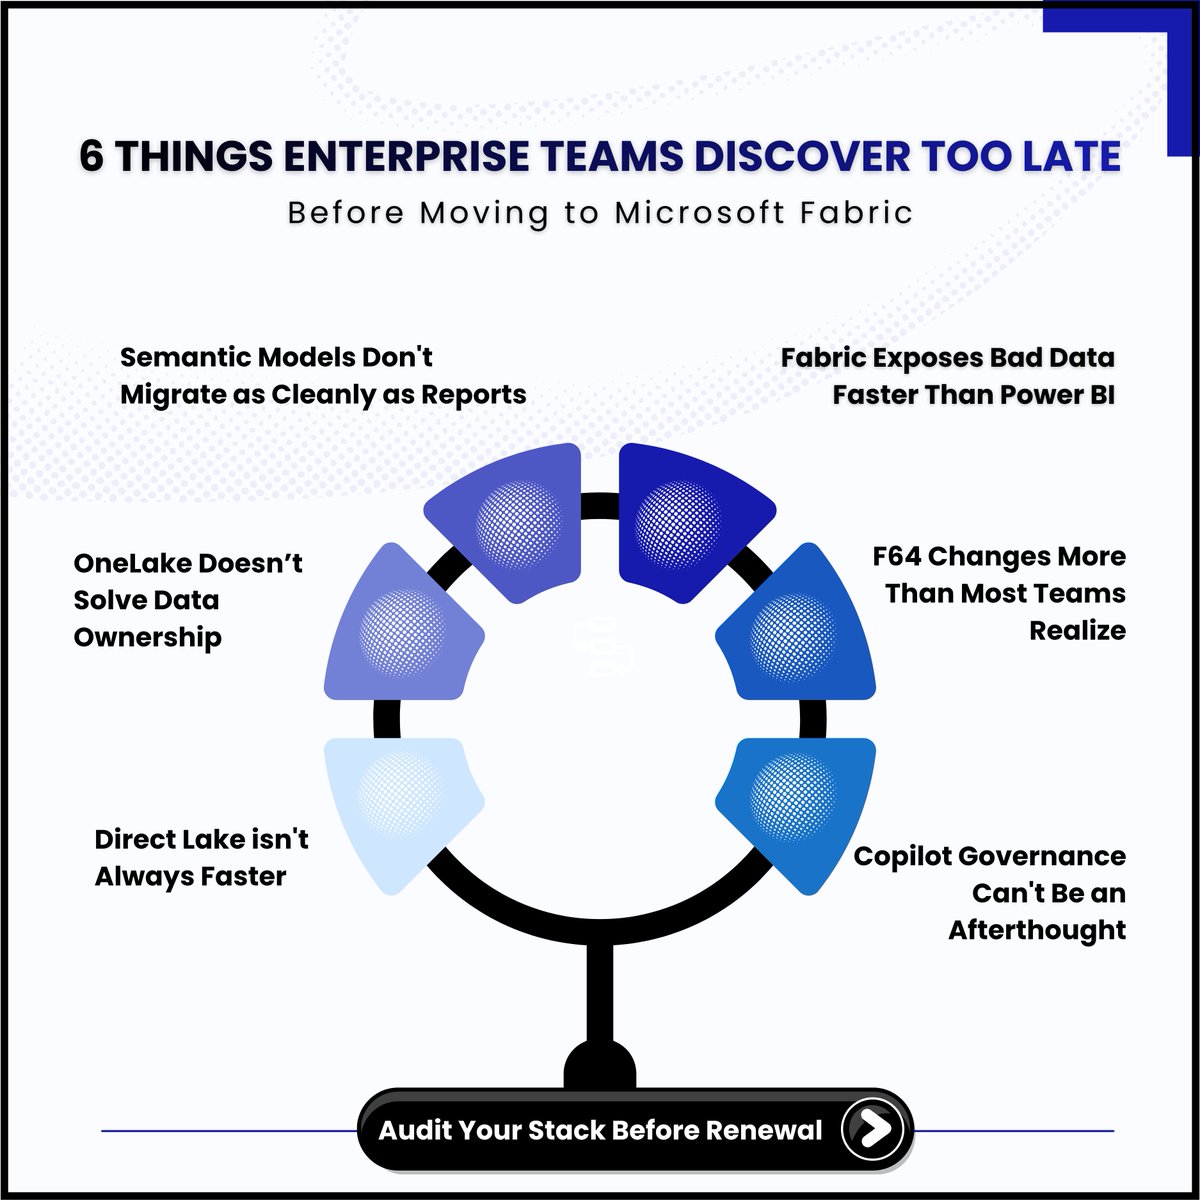
Microsoft Fabric is an Incredible Data Platform.
But your migration guide is lying to you.
Most Microsoft Fabric migration plans look flawless on paper.
➡️ Then month three arrives.
The reports migrated cleanly.
The semantic models didn't.
The complex DAX measures triggered silent DirectQuery fallbacks.
The On-Premise Report Server licensing gap wasn't in the budget.
And Copilot went live before anyone configured a single sensitivity label.
None of these are edge cases. ⬇️
They're the structural gaps that surface after the architecture decision is finalized — and long after the P-SKU contract is signed.
We mapped all 6 — the full breakdown —
with mitigation roadmaps for each gap in our blog.
Link Below.
#Microsoft #Copilot #PowerBI #DataPrivacy #ManagedIT
1
2
58

May 28
Your office has 200 desks and no fixed assignments. People move around, teams rotate, and meeting rooms change by the hour.
Tracking that in a spreadsheet gets old fast. Synoptic Panel in Power BI lets you take a floor plan, connect it to your reservation data, and see who sits where in real time. Switch floors, check availability and zoom in.
The map in this video is made up, but the problem is not, we've had companies come to us with exactly this setup.
And yes, this could be a legit use case for DirectQuery!
𝗥𝗲𝗮𝗱 𝘁𝗵𝗲 𝗳𝘂𝗹𝗹 𝗰𝗮𝘀𝗲 𝘀𝘁𝘂𝗱𝘆 𝗵𝗲𝗿𝗲:
okviz.com/usecase/workspace-…
𝗧𝗿𝘆 𝗦𝘆𝗻𝗼𝗽𝘁𝗶𝗰 𝗣𝗮𝗻𝗲𝗹
okviz.com/synoptic-panel/
2
1
11
1,455

May 10
1/2
Smart BI #010
Large Dataset Performance: Composite Models Aggregations in Fabric
One of the most common scaling challenges I see is handling fact tables with more then 10 million rows (and beyond).
Reports start lagging, dataset refreshes drag on forever, DAX queries feel sluggish even on Premium capacity, memory consumption spikes, and end users complain about unresponsive visuals. The classic Import mode model simply can't keep up once data volumes explode.
TECHNICAL SOLUTION
Switch to Composite Models combined with Aggregation Tables inside Microsoft Fabric, Microsoft's new unified analytics platform that brings together lakehouse, data engineering, real-time analytics, and Power BI in a single integrated environment.
Here's the core pattern:
• Main fact table stays in DirectQuery (or Dual) mode so you don't load everything into memory
• Dimension tables use Import or Dual storage mode
• Create lightweight pre-aggregated tables (at month/quarter/year grain) directly in Fabric Lakehouse or Dataflows
• Define the aggregation mappings in the semantic model so the engine automatically routes compatible queries to the much smaller aggregations
Power BI's query engine then intelligently decides when to hit the fast aggregation tables versus the source delivering dramatic improvements in both refresh times and interactive report performance without sacrificing real-time data.
This is the way to scale Power BI when pure Import mode hits its limits.
In this episode I wanted to highlight that this problem is extremely common...and that there's a clean, scalable technical solution available today.
What’s been your biggest Power BI performance headache with large datasets? Drop your experience below 👇
#PowerBI #MicrosoftFabric #DAX #CompositeModels #DataModeling #Aggregations
1
1
2
10,192

May 10
Learning Power Bi without Structure?
I got you covered
PowerBI-Learning-Roadmap/
│
├── 01_Foundation_of_BI/
│ ├── What_is_Business_Intelligence
│ ├── Data_vs_Information_vs_Insights
│ ├── KPI_and_Metrics
│ ├── Reporting_vs_Analytics
│ ├── OLTP_vs_OLAP
│ └── Data_Driven_Decision_Making
│
├── 02_PowerBI_Introduction/
│ ├── PowerBI_Desktop
│ ├── PowerBI_Service
│ ├── PowerBI_Mobile
│ ├── PowerBI_Gateway
│ ├── Licensing_Concepts
│ └── PowerBI_Ecosystem
│
├── 03_Data_Sources_and_Connections/
│ ├── Excel
│ ├── CSV_and_Text
│ ├── SQL_Server
│ ├── APIs
│ ├── SharePoint
│ ├── Azure_Sources
│ ├── Folder_Connections
│ └── Web_Data
│
├── 04_Power_Query_ETL/
│ ├── Query_Editor
│ ├── Data_Cleaning
│ ├── Remove_Duplicates
│ ├── Merge_Queries
│ ├── Append_Queries
│ ├── Pivot_and_Unpivot
│ ├── Conditional_Columns
│ ├── Custom_Columns
│ ├── Parameters
│ ├── Data_Types
│ ├── Error_Handling
│ └── M_Language_Basics
│
├── 05_Data_Modeling/
│ ├── Tables_and_Relationships
│ ├── Primary_and_Foreign_Keys
│ ├── Cardinality
│ ├── Filter_Direction
│ ├── Star_Schema
│ ├── Snowflake_Schema
│ ├── Fact_and_Dimension_Tables
│ ├── Data_Granularity
│ ├── Bridge_Tables
│ ├── Calendar_Table
│ └── Model_Optimization
│
├── 06_DAX_Fundamentals/
│ ├── Calculated_Columns
│ ├── Measures
│ ├── Aggregation_Functions
│ ├── IF_and_SWITCH
│ ├── Variables
│ ├── Filter_Context
│ ├── Row_Context
│ ├── CALCULATE_Function
│ ├── RELATED_and_LOOKUPVALUE
│ └── Time_Intelligence_Basics
│
├── 07_Intermediate_DAX/
│ ├── Advanced_CALCULATE
│ ├── ALL_and_ALLEXCEPT
│ ├── FILTER_Function
│ ├── Iterators_SUMX_AVERAGEX
│ ├── Ranking_Functions
│ ├── Dynamic_Measures
│ ├── Running_Totals
│ ├── Year_to_Date
│ ├── Month_to_Date
│ ├── Previous_Period_Analysis
│ └── KPI_Calculations
│
├── 08_Data_Visualization/
│ ├── Charts_and_Graphs
│ ├── Tables_and_Matrix
│ ├── Cards_and_KPIs
│ ├── Maps
│ ├── Slicers
│ ├── Drillthrough
│ ├── Tooltips
│ ├── Conditional_Formatting
│ ├── Bookmarks
│ ├── Buttons_and_Navigation
│ └── Dashboard_Design_Principles
│
├── 09_Report_Design_and_UX/
│ ├── Storytelling_with_Data
│ ├── Color_Theory
│ ├── Layout_Design
│ ├── Executive_Dashboard_Design
│ ├── Mobile_Layout
│ ├── User_Experience
│ ├── Accessibility
│ └── Performance_Friendly_Design
│
├── 10_Advanced_Modeling_and_Performance/
│ ├── Query_Performance
│ ├── DAX_Optimization
│ ├── Incremental_Refresh
│ ├── Aggregation_Tables
│ ├── Composite_Models
│ ├── DirectQuery
│ ├── Import_Mode
│ ├── Hybrid_Model
│ └── Performance_Analyzer
│
├── 11_PowerBI_Service_and_Deployment/
│ ├── Publishing_Reports
│ ├── Workspaces
│ ├── Apps
│ ├── Dashboards
│ ├── Scheduled_Refresh
│ ├── Data_Gateway
│ ├── Sharing_and_Permissions
│ ├── Row_Level_Security
│ ├── Deployment_Pipelines
│ └── Governance
│
├── 12_Real_Time_and_AI_Features/
│ ├── Streaming_Datasets
│ ├── Real_Time_Dashboards
│ ├── AI_Visuals
│ ├── Forecasting
│ ├── Key_Influencers
│ ├── Decomposition_Tree
│ ├── Python_in_PowerBI
│ ├── R_in_PowerBI
│ └── Copilot_Features
│
├── 13_Fabric_and_Modern_Data_Platform/
│ ├── Microsoft_Fabric_Overview
│ ├── Lakehouse
│ ├── Warehouse
│ ├── Dataflows_Gen2
│ ├── Notebooks
│ ├── Pipelines
│ ├── OneLake
│ ├── Real_Time_Intelligence
│ └── Fabric_with_PowerBI
2
35
125
4,464

Apr 14
Top 30 Power BI Interview Questions🧠
1. What is Power BI and its key components?
2. Difference between Power BI Desktop, Service, and Mobile
3. What is Power Query and how is it used?
4. Explain DAX and its basic functions
5. What are relationships in Power BI data model?
6. Difference between Import, DirectQuery, and Live Connection
7. What is a dataflow in Power BI?
8. How do you create measures vs calculated columns?
9. What are slicers and how do they work?
10. Explain bookmarks and drill-through
11. What is Row-Level Security (RLS)?
12. Difference between Power BI Pro and Premium
13. What are gateways and when are they needed?
14. How does Direct Lake mode work?
15. What is Copilot in Power BI?
16. Explain composite models
17. What are custom visuals and how to import them?
18. Difference between visuals and cards
19. What is the role of Paginated Reports?
20. How do you handle large datasets in Power BI?
21. What are AI visuals in Power BI?
22. Explain incremental refresh
23. What is the FILTER function in DAX?
24. Difference between ALL and REMOVEFILTERS
25. What are time intelligence functions?
26. How does CALCULATE work?
27. What is a star schema and why use it?
28. Explain Quick Measures
29. What are workspaces and apps?
30. How do you schedule data refresh?
Reshare for wider audience 🤝
2
18
103
2,370

Level hard:
DirectQuery mode in Power BI means?
A) Data is imported into the model
B) Queries are sent live to the source; data is not stored in the model
C) Data is cached daily
D) Data is refreshed manually
5
2
18
2,602

The three Power BI storage modes!
Import, DirectQuery, or Live Connection, each shapes performance, features, and user experience differently.
Which storage mode do you use most, and how do you decide when it’s the best choice? 👇
#PowerBI

2
10
258
Mar 25
Power BI Scenario-Based Questions
1. Scenario: You have been given a dataset in Power BI that contains sales data for a company. Your task is to create a report that shows the total sales by product category and region.
Expected Answer:
- Load the dataset into Power BI.
- Create relationships if necessary.
- Use the "Fields" pane to select the necessary fields (Product Category, Region, Sales).
- Drag these fields into the "Values" area of a new visualization (e.g., a table or bar chart).
- Use the "Filters" pane to filter data as needed.
- Format the visualization to enhance clarity and readability.
2. Scenario: You have been asked to create a Power BI dashboard that displays real-time stock prices for a set of companies. The stock prices are available through an API.
Expected Answer:
- Use Power BI Desktop to connect to the API.
- Go to "Get Data" > "Web" and enter the API URL.
- Configure the data refresh settings to ensure real-time updates (e.g., setting up a scheduled refresh or using DirectQuery if supported).
- Create visualizations using the imported data.
- Publish the report to the Power BI service and set up a data gateway if needed for continuous refresh.
3. Scenario: You have been given a Power BI report that contains multiple visualizations. The report is taking a long time to load and is impacting the performance of the application.
Expected Answer:
- Analyze the current performance using Performance Analyzer.
- Optimize data model by reducing the number of columns and rows, and removing unnecessary calculations.
- Use aggregated tables to pre-compute results.
- Simplify DAX calculations.
- Optimize visualizations by reducing the number of visuals per page and avoiding complex custom visuals.
- Ensure proper indexing on the data source.
2
5
1,627
Mar 22
🚀 Top 50 Data Analyst Interview Questions 📊💼
▎📊 EXCEL Questions
1. Can you show me how you'd clean this messy dataset in Excel? What functions like TRIM or Remove Duplicates would you use?
2. What's the difference between absolute ($A$1) and relative (A1) references? When do you use each?
3. Walk me through creating a PivotTable to analyze sales by region and product. What are the exact steps?
4. Write a VLOOKUP formula right now. What if you get #N/A? How do you fix it?
5. Why use INDEX-MATCH over VLOOKUP? Show me both formulas for this lookup.
6. What's COUNTIF vs SUMIF vs COUNTIFS? Write formulas for conditional sales totals.
7. How does Goal Seek work? Demo target revenue scenario on this data.
8. Apply conditional formatting to highlight top 10% sales performers. Which rule?
9. Build me a dynamic dashboard. How do slicers and timelines work together?
10. Explain SUMPRODUCT. Write formula for multi-condition sales sum.
11. What's Power Query? Show basic ETL steps for cleaning data.
12. Freeze panes vs split panes—when do you use each?
13. XLOOKUP vs VLOOKUP advantages? Write both for this example.
14. How do you find and fix circular references in formulas?
15. Create data validation dropdown named ranges. Demo it.
▎🗄️ SQL Questions
16. Write query for 2nd highest salary from Employee table. Use subquery OR window function.
17. INNER JOIN vs LEFT JOIN vs FULL JOIN? Write examples for employees departments.
18. Find and remove duplicate records. Use CTE ROW_NUMBER() or GROUP BY.
19. WHERE vs HAVING with GROUP BY? Show department-wise avg salary > 50k.
20. RANK() vs DENSE_RANK() vs ROW_NUMBER()? Partition by dept, order by salary.
21. Top 5 products by total sales. Write complete query with GROUP BY LIMIT.
22. Self-join for employee-manager hierarchy. Show employee name manager name.
23. Handle NULL salaries. Use COALESCE, IS NULL, IFNULL examples.
24. Pivot sales data by month using CASE statements. Write query.
25. Subquery vs JOIN—which is faster for this scenario? Why?
26. Recursive CTE for company hierarchy (CEO → managers → employees).
27. Clustered vs non-clustered indexes? When does each improve performance?
▎🎨 Tableau Questions
28. {FIXED [Region]: SUM([Sales])}—what's this LOD doing? Write region total ignoring filters.
29. Create dual-axis chart comparing sales vs profit trends. Exact steps?
30. Data blending vs joining? When do you use each approach?
31. Parameters vs filters? Write calculated field using parameter.
32. Build dashboard with filter action highlight action. Demo flow.
33. % of total calculated field? Write formula for region sales %.
34. FIXED vs INCLUDE vs EXCLUDE LOD? Give 3 examples.
35. Tableau Extracts vs Live connection? Performance refresh differences?
▎⚡ Power BI Questions
36. CALCULATE(SUM(Sales), SAMEPERIODLASTYEAR())—explain this DAX. YoY growth?
37. Measures vs Calculated Columns? When do you use each? Write both.
38. Star schema vs Snowflake? Draw relationships for sales → products → customers.
39. Power Query: Write M code for custom column parsing dates.
40. Implement Row-Level Security (RLS). Show DAX for region manager filter.
41. DirectQuery vs Import mode? Pros/cons when to choose each?
42. TOTALYTD(SUM(Sales))—explain time intelligence DAX.
43. Dashboard loads slow. Optimization steps? Aggregations query folding?
▎🐍 Python/Pandas Questions
44. Group sales by region and sum: write pandas code. .reset_index()
45. pd.merge(df1, df2, on='ID', how='inner')—explain all merge types.
46. Three ways to handle NaN values: fillna(), dropna(), interpolate().
47. loc[] vs iloc[]? Filter sales > 1000 by region vs first 5 rows.
48. pivot_table() vs groupby()? Reshape sales by month/product.
49. Read 1GB CSV without crashing: chunksize=10000 example.
50. df['New'] = df['Sales'].apply(lambda x: x*1.1)—alternatives to apply?
Double Tap ♥️ For More
2
16
1,674
Mar 22
🚀 Top 50 Data Analyst Interview Questions 📊💼
▎📊 EXCEL Questions
1. Can you show me how you'd clean this messy dataset in Excel? What functions like TRIM or Remove Duplicates would you use?
2. What's the difference between absolute ($A$1) and relative (A1) references? When do you use each?
3. Walk me through creating a PivotTable to analyze sales by region and product. What are the exact steps?
4. Write a VLOOKUP formula right now. What if you get #N/A? How do you fix it?
5. Why use INDEX-MATCH over VLOOKUP? Show me both formulas for this lookup.
6. What's COUNTIF vs SUMIF vs COUNTIFS? Write formulas for conditional sales totals.
7. How does Goal Seek work? Demo target revenue scenario on this data.
8. Apply conditional formatting to highlight top 10% sales performers. Which rule?
9. Build me a dynamic dashboard. How do slicers and timelines work together?
10. Explain SUMPRODUCT. Write formula for multi-condition sales sum.
11. What's Power Query? Show basic ETL steps for cleaning data.
12. Freeze panes vs split panes—when do you use each?
13. XLOOKUP vs VLOOKUP advantages? Write both for this example.
14. How do you find and fix circular references in formulas?
15. Create data validation dropdown named ranges. Demo it.
▎🗄️ SQL Questions
16. Write query for 2nd highest salary from Employee table. Use subquery OR window function.
17. INNER JOIN vs LEFT JOIN vs FULL JOIN? Write examples for employees departments.
18. Find and remove duplicate records. Use CTE ROW_NUMBER() or GROUP BY.
19. WHERE vs HAVING with GROUP BY? Show department-wise avg salary > 50k.
20. RANK() vs DENSE_RANK() vs ROW_NUMBER()? Partition by dept, order by salary.
21. Top 5 products by total sales. Write complete query with GROUP BY LIMIT.
22. Self-join for employee-manager hierarchy. Show employee name manager name.
23. Handle NULL salaries. Use COALESCE, IS NULL, IFNULL examples.
24. Pivot sales data by month using CASE statements. Write query.
25. Subquery vs JOIN—which is faster for this scenario? Why?
26. Recursive CTE for company hierarchy (CEO → managers → employees).
27. Clustered vs non-clustered indexes? When does each improve performance?
▎🎨 Tableau Questions
28. {FIXED [Region]: SUM([Sales])}—what's this LOD doing? Write region total ignoring filters.
29. Create dual-axis chart comparing sales vs profit trends. Exact steps?
30. Data blending vs joining? When do you use each approach?
31. Parameters vs filters? Write calculated field using parameter.
32. Build dashboard with filter action highlight action. Demo flow.
33. % of total calculated field? Write formula for region sales %.
34. FIXED vs INCLUDE vs EXCLUDE LOD? Give 3 examples.
35. Tableau Extracts vs Live connection? Performance refresh differences?
▎⚡ Power BI Questions
36. CALCULATE(SUM(Sales), SAMEPERIODLASTYEAR())—explain this DAX. YoY growth?
37. Measures vs Calculated Columns? When do you use each? Write both.
38. Star schema vs Snowflake? Draw relationships for sales → products → customers.
39. Power Query: Write M code for custom column parsing dates.
40. Implement Row-Level Security (RLS). Show DAX for region manager filter.
41. DirectQuery vs Import mode? Pros/cons when to choose each?
42. TOTALYTD(SUM(Sales))—explain time intelligence DAX.
43. Dashboard loads slow. Optimization steps? Aggregations query folding?
▎🐍 Python/Pandas Questions
44. Group sales by region and sum: write pandas code. .reset_index()
45. pd.merge(df1, df2, on='ID', how='inner')—explain all merge types.
46. Three ways to handle NaN values: fillna(), dropna(), interpolate().
47. loc[] vs iloc[]? Filter sales > 1000 by region vs first 5 rows.
48. pivot_table() vs groupby()? Reshape sales by month/product.
49. Read 1GB CSV without crashing: chunksize=10000 example.
50. df['New'] = df['Sales'].apply(lambda x: x*1.1)—alternatives to apply?
Double Tap ♥️ For More
1
21
99
5,225

Mar 21
Data Engineering lessons 👇
• Shuffling = real bottleneck
• Broadcast joins: powerful but risky
• More executors ≠ faster jobs
• DirectQuery = latency trade-off
• Small files = silent killer
Shift: stop just coding → start understanding execution
#DataEngineering #Spark
3
55