

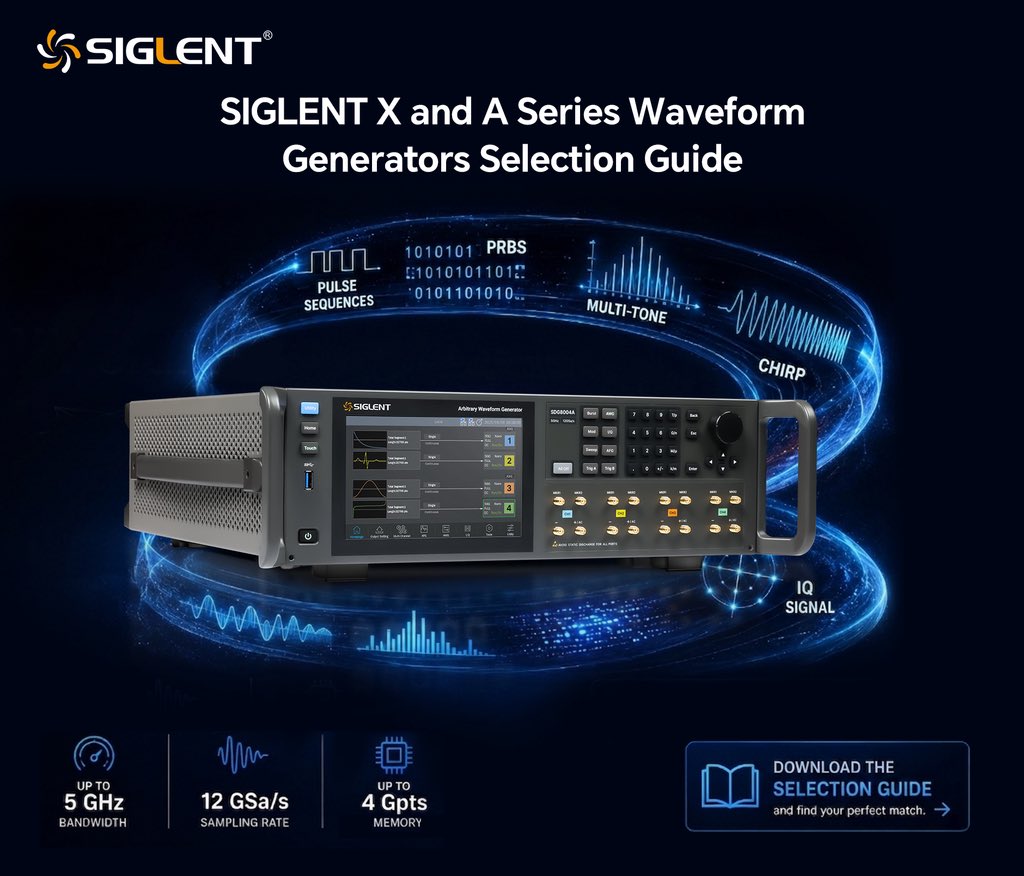
Looking for high-performance waveform generation for RF, digital comms, or IQ testing?
SIGLENT X & A Series deliver:
• Up to 5 GHz 12 GSa/s
• TrueArb with 4 Gpts memory
• Advanced IQ, PRBS & pulse sequencing
📘 Download the Selection Guide and find your match:
bit.ly/4ehw3Xv
#Siglent #WaveformGenerators #SignalGeneration #EngineeringTools #AWG
1
3
77

Jun 12
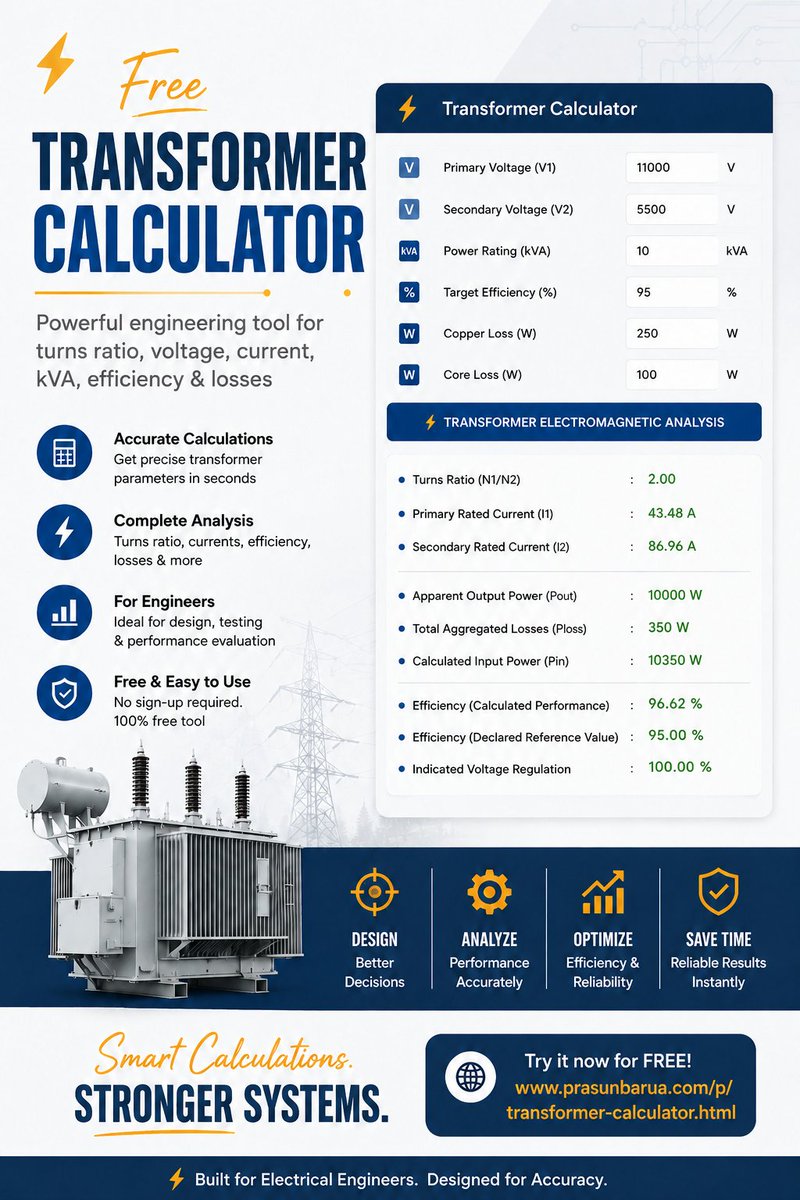
⚡ Free Transformer Calculator for electrical engineering applications enabling quick calculation of turns ratio, efficiency, currents, kVA, and losses for design and analysis tasks.
🔗 prasunbarua.com/p/transforme…
#ElectricalEngineering #Transformer #EngineeringTools
1
6

Jun 11
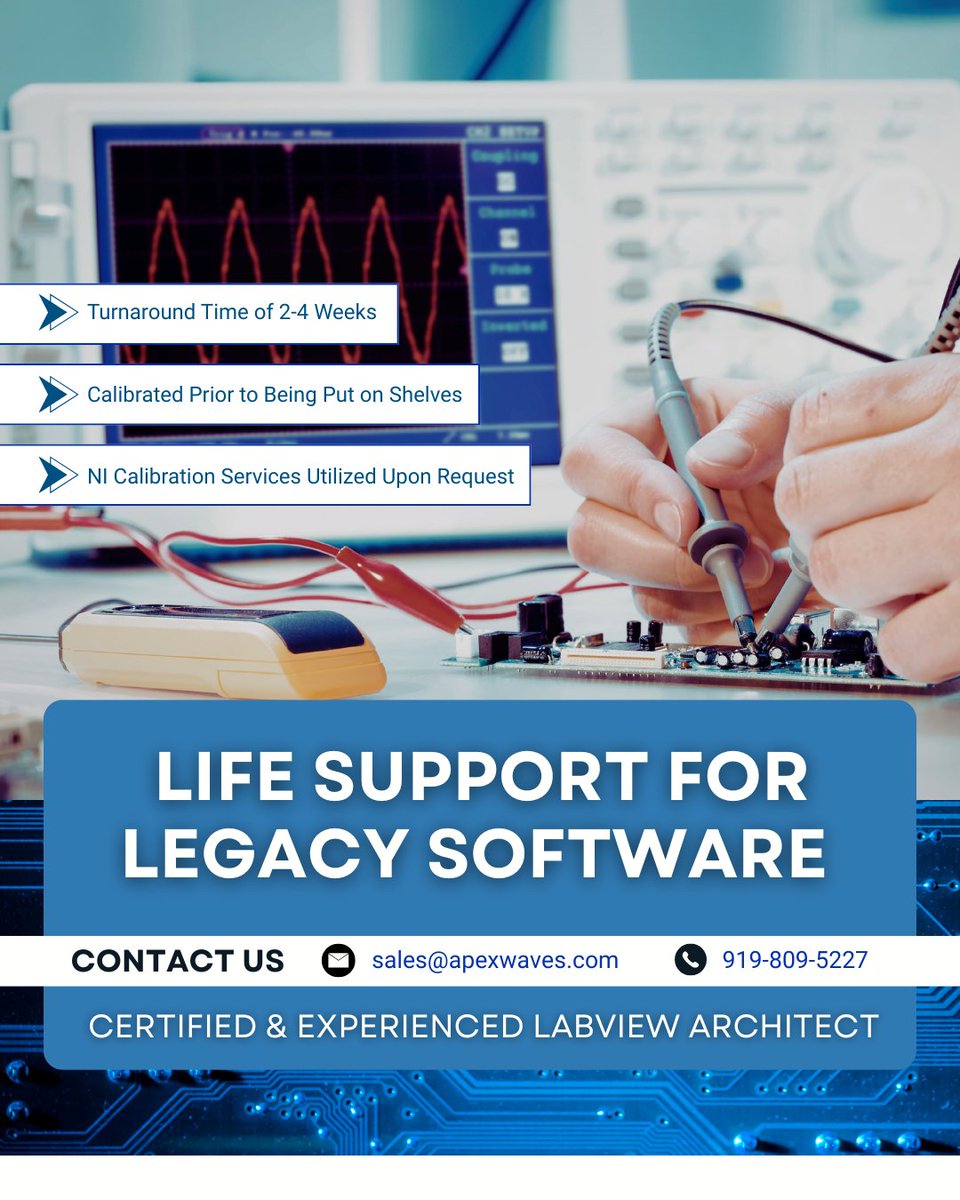
🛠️ Legacy hardware still has a job to do—and Apex Waves is here to keep it running.
We provide complete “life support” for legacy NI equipment, including repair services, replacement hardware, and calibration options through both NI and trusted certified labs. We also offer support from a Certified LabVIEW Architect to help customers maintain and optimize long-running systems.
Because obsolete doesn’t mean unsupported.
#ApexWaves #LegacyHardware #LabVIEW #PXI #NIHardware #Calibration #TestEquipment #EngineeringTools
1
17

Jun 11
We supply high-quality engineering tools, industrial equipment, safety gear, electrical materials, and construction accessories at competitive prices, built to support efficiency, safety, and performance across every project.
Send Us a DM to Get Started. ✉️
#EngineeringTools

1
8

Jun 11
Corca Raises $7.8M in Funding
#AI #MathTech #CollaborativeSoftware #EngineeringTools #ScientificComputing #Mathematics #ProductDevelopment
#Innovation #SaaS #Funding #Corca
thesaasnews.com/news/corca-r…
16
Jun 10
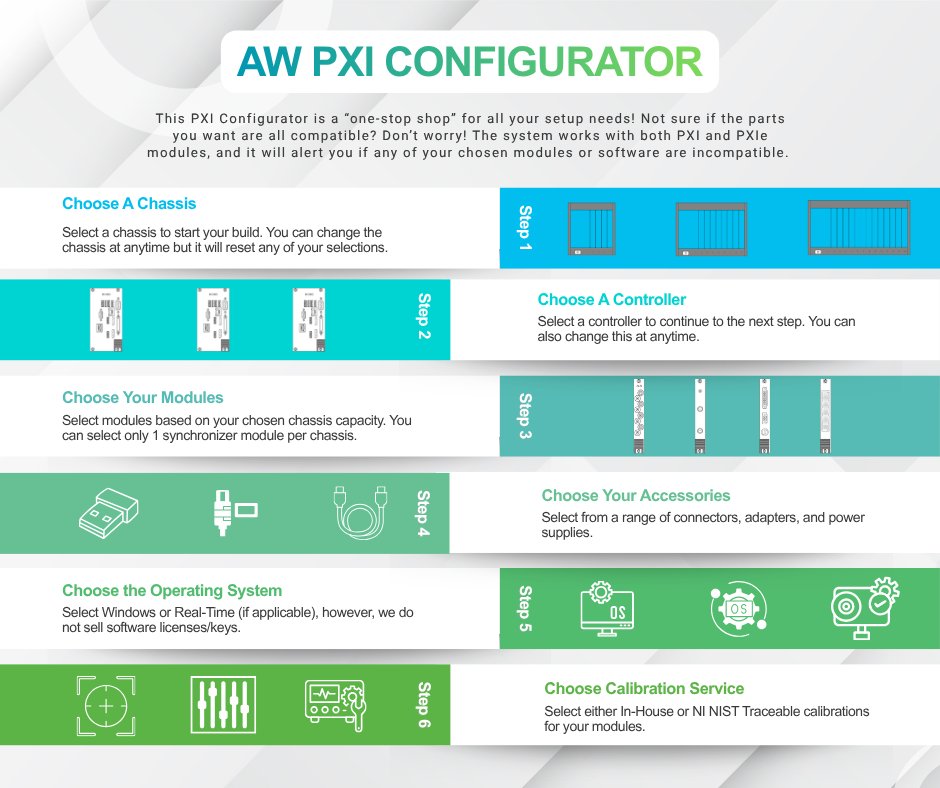
🛠️ Build your ideal PXI system with confidence using the Apex Waves PXI Configurator.
Choose your chassis, controller, modules, operating system, and more—all in one easy-to-use tool designed to help you create a fully compatible system tailored to your application.
No guesswork. No compatibility headaches. Just the right PXI system for the job.
👉 Try it today at apexwaves.com
#ApexWaves #PXI #PXIConfigurator #NIHardware #TestEquipment #EngineeringTools #SystemIntegration
19

Jun 10
TAELSS Feature Demo#02 | Reserve Factors and Failure Modes by Load Case
youtu.be/uHk7kHHK_Fc
#TAELSS #TAELCO #AerospaceEngineering #StructuralAnalysis #FEM #Nastran #EngineeringTools #AeronauticalEngineering #AerospaceDesign
1
1
23

Jun 10
Brand New XCMG GR165 Motor Grader | Spot Goods Available
Rated Power: 132kW (179HP)
Operating Weight: 15,000kg
Blade Size: 3660×610mm
1-year warranty, fast shipment, contact us now!
#XCMGMachinery #GR165Grader #RoadConstruction #HeavyEquipment #ChineseMachinery #EngineeringTools
1
Jun 9
Quickly calculate Voltage, Current, Resistance, and Power with our free Ohm’s Law Calculator. Designed for students, technicians, and engineers for fast and accurate electrical calculations.
🔗 prasunbarua.com/p/ohms-law-c…
#ElectricalEngineering #OhmsLaw #EngineeringTools
1
2

🔥 Summer Savings on Fluke Instruments! 🔥
Get exclusive deals on selected Fluke products for a limited time.
📞 Contact Us :- E : Sales@haris.com , T : 971 42734005
Get yours before the season ends!
#Fluke #SummerSale #EngineeringTools #Maintenance #ElectricalTesting #UAE

12
Jun 8
⚡ Simplify electrical calculations and power system analysis with the Power System Analyzer. A practical tool for engineers, technicians, and students. Explore it here: prasunbarua.com/p/power-syst…
#ElectricalEngineering #PowerSystems #EngineeringTools
1
3

Meet Engichat; your AI Engineering Copilot. 🚀
Civil engineer?
Type: "Design a simply supported beam for a 15kN/m load, 6m span."
Done in seconds.
Electrical engineer?
Ask: "Help me size a cable for a 45kW motor on a 415V supply."
No textbook needed.
Mechanical engineer?
Say: "Calculate the stress on a 20mm steel shaft transmitting 5kW at 1450rpm."
Instant answer.
That's Engichat, not another generic AI.
It is an engineering brain built for your daily workflow.
✅ Structural analysis
✅ Code compliance (IS, AISC, ACI, BS)
✅ Image & sketch interpretation
✅ Unit conversions
✅ Voice input for on-site use
Free to start. 7 prompts/day. No credit card.
👇 Download now through the website at Engichat.com
#Engichat #AICopilot #CivilEngineering #MechanicalEngineering #ElectricalEngineering #EngineeringTools #AutoCAD #ProductLaunch

1
3
37
May 18
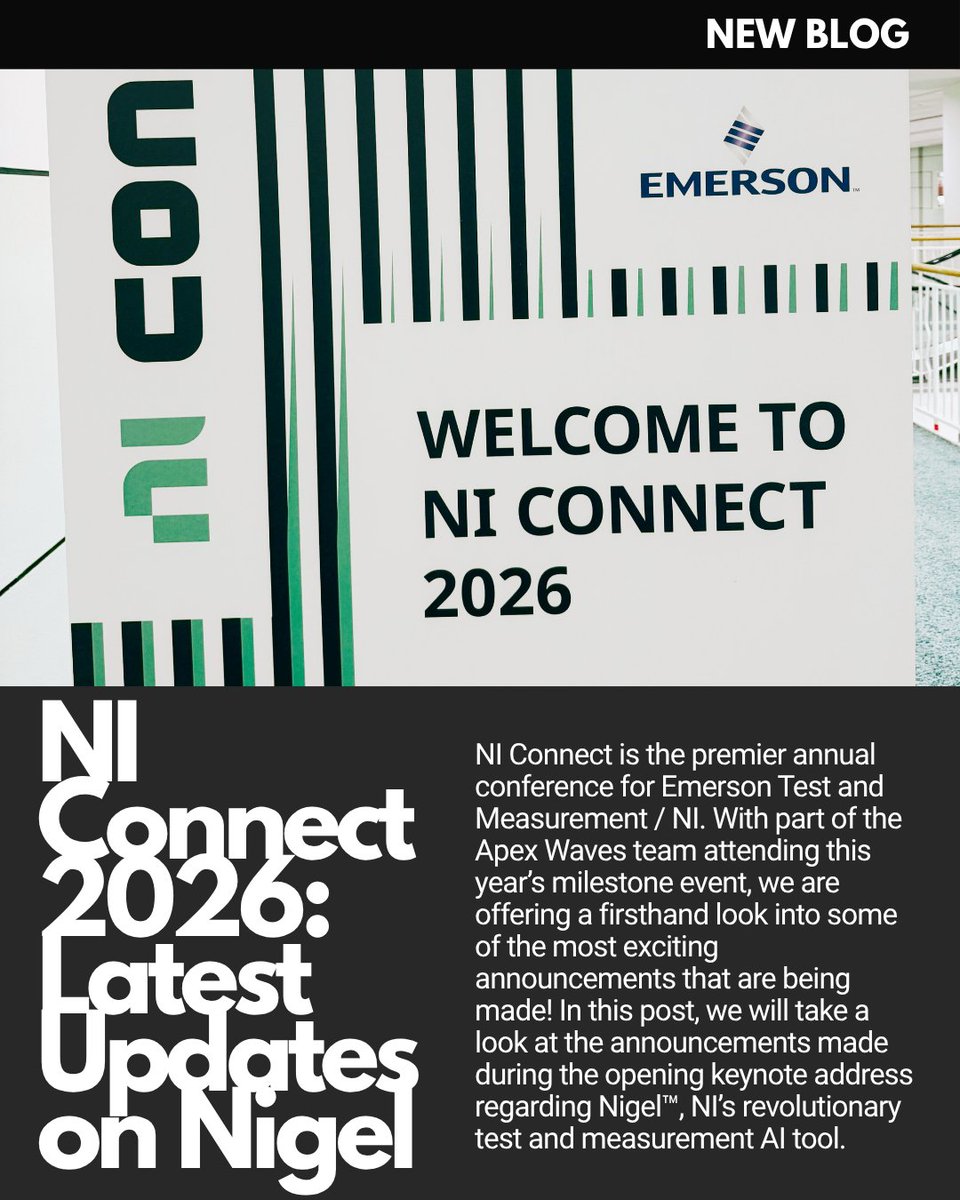
🚀 Fresh from NI Connect 2026!
Our latest blog recaps some of the biggest announcements from this year’s conference in Fort Worth, including exciting updates on Nigel™, NI’s AI-powered advisor for test and measurement. With Apex Waves attending the event in person, we’re giving you a firsthand look at how AI is shaping the future of engineering, PXI, and LabVIEW.
📖 Read the full recap now → apexwaves.com/blog/ni-connec…
#ApexWaves #NIConnect2026 #NigelAI #LabVIEW #PXI #NIHardware #TestEquipment #EngineeringTools #ArtificialIntelligence
1
3
60

Apr 24
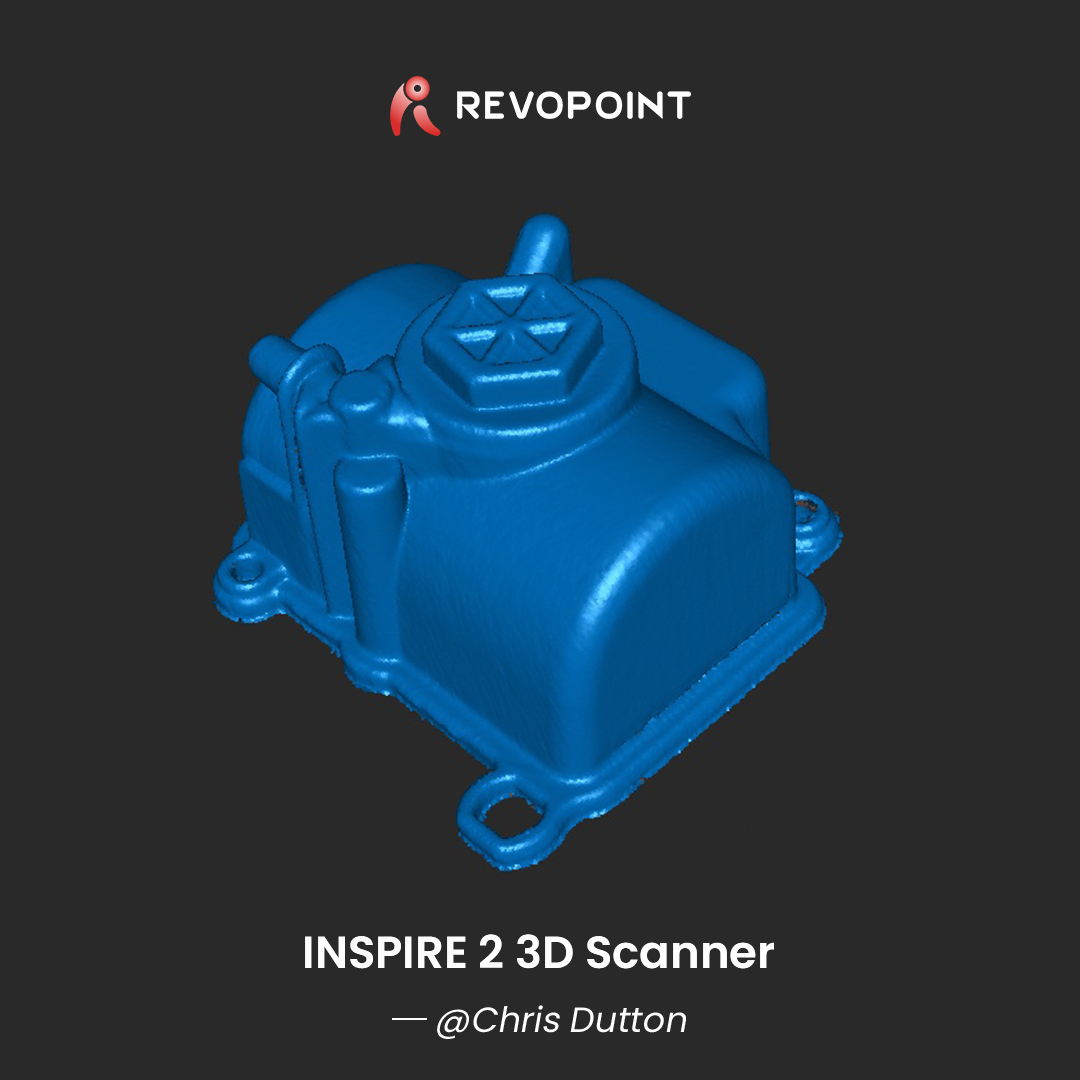
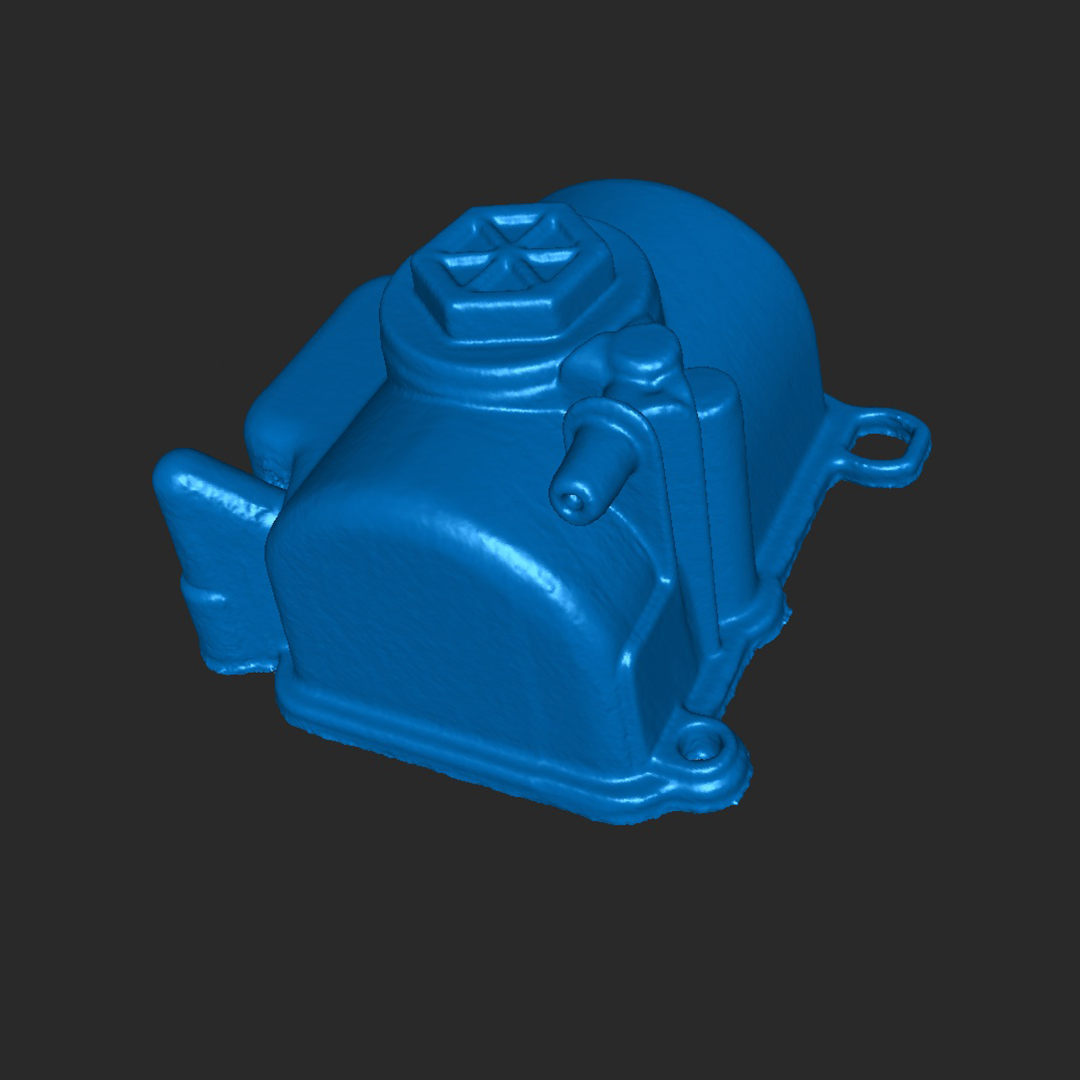
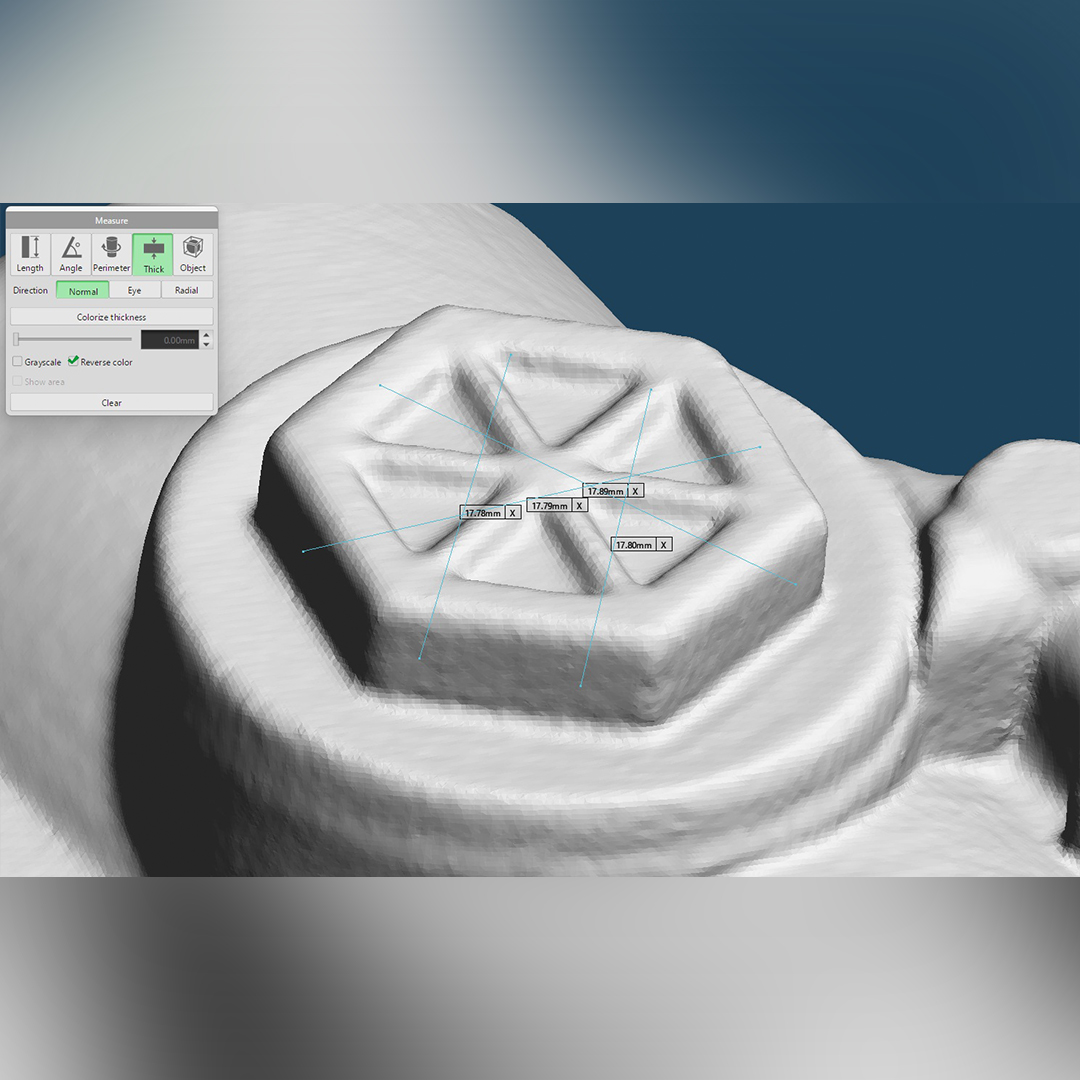
Unlocking Fine Detail: Scanning a Shiny Machine Part with INSPIRE 2
Chris put the INSPIRE 2’s infrared laser mode to the test by scanning a highly shiny mechanical part. He captured roughly 40,000 frames, resulting in an impressively sharp, detailed 3D model.
Thinking of scanning complex, shiny objects? INSPIRE 2 delivers results you can rely on!
Ready to upgrade your workflow?
Use code [MEDIAIN2X2] for a special discount!
US Store: revo.ink/4lHzoRf | Global Store: revo.ink/45Bb7Yt
#Revopoint #INSPIRE2 #3DScanning #EngineeringTools

1
1
4
240
Apr 20
⚠️ NI Obsolescence Alert – April 29th
NI is declaring several modules obsolete on April 29th—is your system affected? Don’t get caught off guard when parts you rely on are no longer available.
At Apex Waves, we don’t believe in last orderable dates. We continue to stock, test, and ship legacy NI hardware long after it’s discontinued.
📦 Need a part? We’ve got you covered → apexwaves.com/fast-quote.php
#ApexWaves #NIObsolete #LegacyHardware #PXI #NIHardware #NationalInstruments #TestEquipment #EngineeringTools
3
24

Apr 17
📐💾 Every engineer & site professional needs this construction conversion table handy.
.
Hey @grok, which construction conversion do engineers get wrong most often on site? 🤔👷
.
#ConstructionTips #CivilEngineering #SiteEngineer #EngineeringTools

1
3
41


From direct DUT connection to DTF and time domain analysis, Copper Mountain Technologies 1-port reflectometers are built for speed, simplicity, and real-world applications: youtube.com/watch?v=2PoFO5zb…
#VNA #RFEngineering #EngineeringTools #VectorNetworkAnalyzer #SignalIntegrity
1
4
71

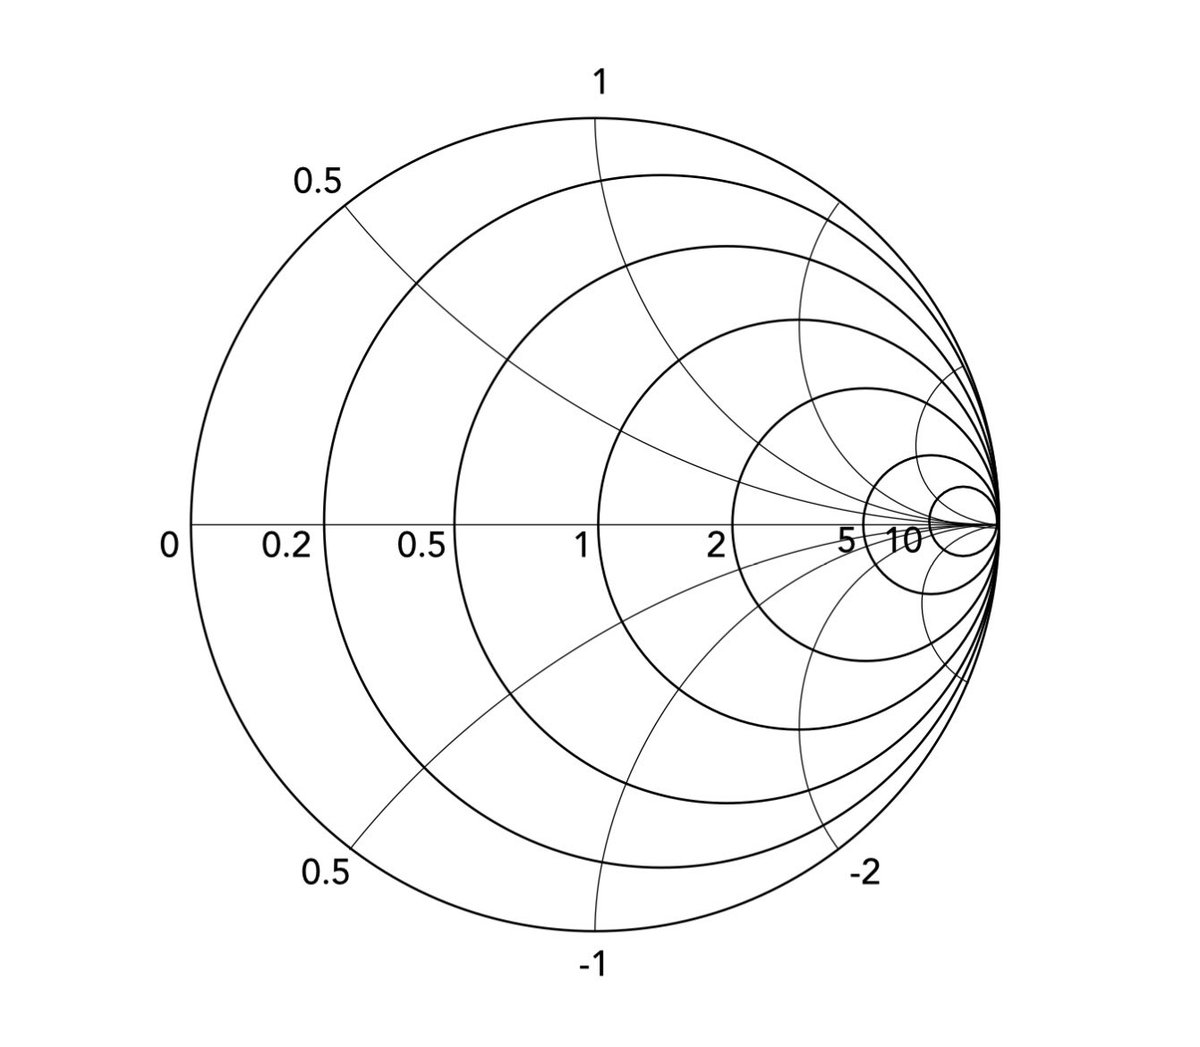
Do You Have Trouble Understanding Smith Charts?
The Smith Chart is probably one of the most useful tools for RF design engineers.
While it may look like a complex web of circles to the uninitiated, it is actually a brilliant graphical calculator that simplifies the way we visualize and solve problems involving complex impedance. It’s also used on VNAs as one of their display modes.
Based on the fundamentals shared on Electronics-Notes, here is a breakdown of what makes this tool indispensable for anyone working with radio frequencies.
What is a Smith Chart?
At its core, a Smith Chart is a polar plot of the complex reflection coefficient. It maps the rectangular world of impedance (Resistance Reactance) into a circular format.
Key features include:
🔹 The Horizontal Axis: Represents pure resistance (the "real" part).
🔹 The Circles: Represent constant resistance.
🔹 The Arcs: Represent constant reactance (Inductive on the top half, Capacitive on the bottom).
🔹 Normalization: To make the chart universal, values are typically "normalized" to the system impedance (usually 50 ohms).
How is it Used Today?
Even in the age of high-speed computing, the Smith Chart remains the "language" of RF. It isn't just a paper tool anymore; it is the primary display format for Vector Network Analyzers (VNAs) and simulation software.
Here are its primary applications:
1️⃣ Impedance Matching: This is perhaps its most common use. By plotting a load, engineers can visually determine what combination of capacitors or inductors is needed to transform that load to match the system’s characteristic impedance, ensuring maximum power transfer.
2️⃣ Visualizing Reflections: The chart allows you to see the reflection coefficient (Γ) and Standing Wave Ratio (SWR) at a glance. The closer you are to the center of the chart, the better your match.
3️⃣ Transmission Line Analysis: It helps visualize how impedance changes as you move along a transmission line. This is vital for understanding standing wave patterns and input impedances.
4️⃣ Antenna and Filter Design: Engineers use the chart to analyze antenna performance and fine-tune networks like filters and amplifiers to ensure they operate efficiently across specific frequency ranges.
Why does it matter?
The beauty of the Smith Chart is that it provides a visual intuition that a simple number cannot. It shows you not just that a system is mismatched, but how it is mismatched and exactly what direction you need to take to fix it.
Whether you are a student or a seasoned RF professional, mastering the Smith Chart is like gaining X-ray vision for circuitry.
For more information check out the link in the comments.
#RFEngineering #Electronics #Wireless #SmithChart #RadioFrequency #ElectricalEngineering #EngineeringTools
5
35
208
9,797