
Jun 12
Strategic sales of Indian startups: ~$65M in 2024.
~$1B in 2025, Roughly 15x in twelve months.
Kinara to NXP, Axio to Amazon, Fisdom to Groww & Minimalist to HUL.
Four deals did ~75% of it.
The rest was small cheques that finally found a buyer.
Everyone waits for the IPO bell.
Most founders will get bought, not listed.
The exit you plan for is rarely the exit you take.

100

Apr 26
Valuation: What You're Paying For
• At CMP, Groww trades at ~65x trailing P/E.
The market is already paying for the platform narrative.
• For this premium to hold, FY27 needs to show 30% revenue growth. Anything below that triggers de-rating.
Re-rating, when Groww: (1) drives further margin expansion, and (2) establishes a credible presence in wealth management.
What to Watch:
The next 4 quarters are critical monitorables:
→ Q1 FY27: First clean update on wealth scale-up post-Fisdom integration
→ Revenue Growth and Margin Quality
→ Competitor initiatives & Groww’s strategic response
Groww has built the foundation.
The next decade tests whether it can capture most of the profit pool in the coming decade & become the next HDFC Bank of fintech - or if it just stays as a well-priced platform play.

3
5
684
Apr 26
The Risks (Real Ones):
• 55% of revenue from equity derivatives - SEBI tightening risk
• Wealth/AMC still loss-making: Fisdom break-even expected only by FY28
• Jio Financial Services entry into broking - competitive threat that can't be dismissed.
And if Zerodha or Angel One get more aggressive on free brokerage / lower MTF rates as their growth slows, Groww's "cost to grow" line currently parked at 9% - is the first to break.
The model implicitly assumes competitive intensity stays at FY25 levels.
1
5
341
Apr 26
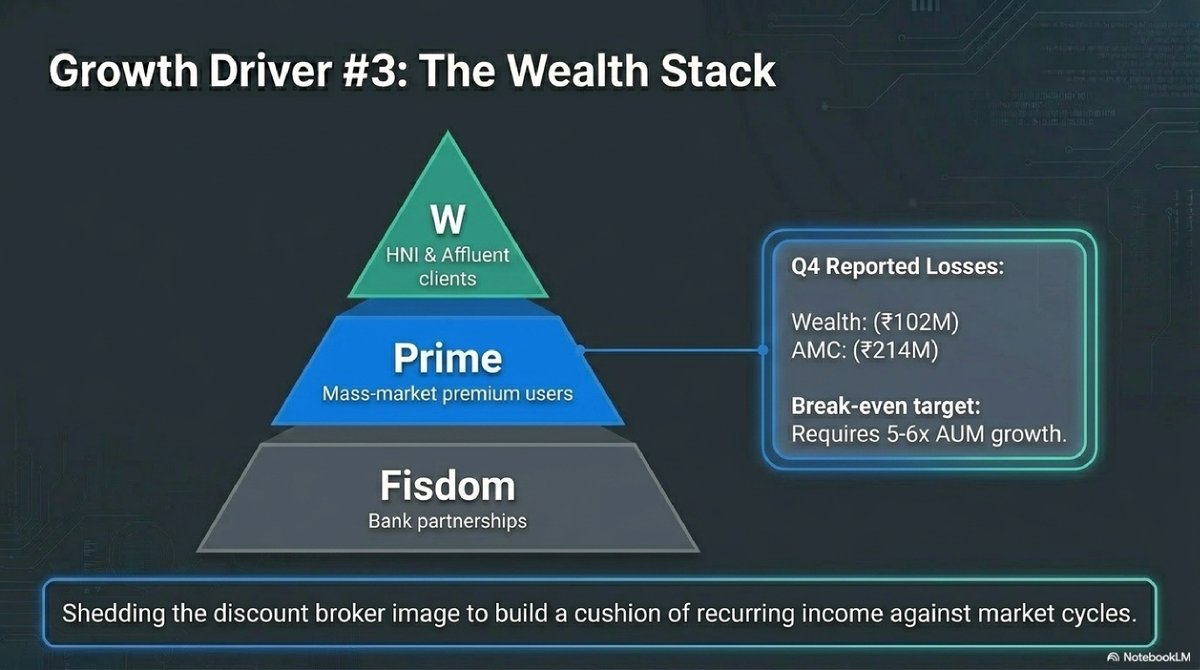
Growth Driver #3: The "Wealth Stack"
Groww is shedding the "discount broker" image.
Post-Fisdom acquisition, Groww has segmented the market
• Fisdom - bank partnerships
• "W" - HNI/affluent (Wealth Management platform)
• "Prime" - mass-market premium
While the wealth arm and AMC (Growwmf) currently reported Q4 losses of ₹10cr and ₹21cr respectively, they are building recurring income to cushion against market cycles.
To hit break-even in the:
• AMC: they need to grow AUM by 5-6x &
• Fidsom: is expected to turn profitable by FY28.
1
5
322

Apr 22
Groww - Q4 FY26 concall analysis and all important updates :
1. Customer acquisition :
Only 10% of the total population who have an active internet connection have a demat account, so there is still huge scope left to grow. Management says that most of the people have entered the stock market through the Mutual Funds & ETFs route in the past few months, rather than direct equity investing and trading.
2. New product launches :
They have launched commodities and bonds in the last financial year. Apart from that, they have acquired FISDOM, a company which will help them to enter into the wealth management field. Groww's AUM business also grew by 2.5x in the past one year.
3. Equity derivatives section :
Their market share in equity derivatives increased from 18% to 21% in the past one quarter. Active customers in this segment grew from 14 lakh to 17 lakh. However, the penetration of F&O in the platform has decreased from 18% to 10% in one quarter.
4. Usage of AI :
They are using AI to improve customer experiences and increase employees' productivity.
5. Costs :
Due to expansion in new fields, employee cost is expected to rise. Marketing cost will also rise but will remain lower than the growth in revenue.
2
185

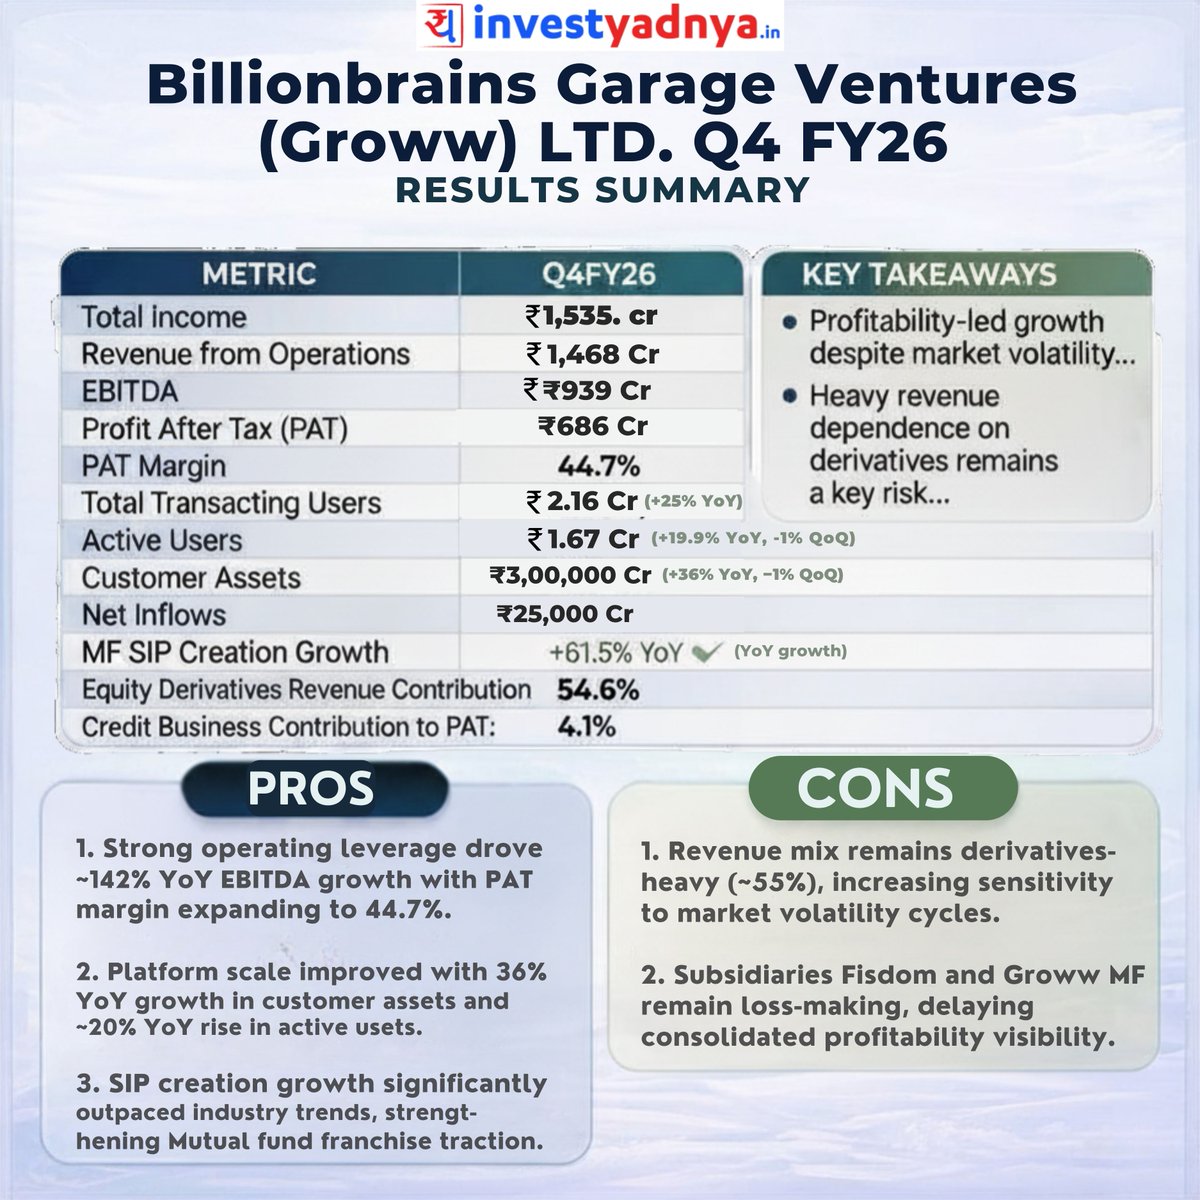
Groww Q4 FY26: Record Profits vs. Revenue Risks
Groww shows massive scaling and profitability, though a heavy reliance on derivatives remains a key watchpoint.
Key Highlights:
Record Profits: ₹686 Cr PAT with a strong 44.7% margin.
Operating Leverage: EBITDA surged ~142% YoY to ₹939 Cr.
Massive Scale: Customer assets hit ₹3 Lakh Cr ( 36% YoY).
SIP Growth: New SIP registrations jumped 61.5% YoY.
Risk Factor: Over 54% of revenue comes from equity derivatives.
Profitability Drag: Subsidiaries like Fisdom remain loss-making.
Share this with your fellow investors and let us know: Is Groww’s derivative-heavy model a risk or a reward
#Groww #Q4Results #Investors #Growth #RiskVsReward
ALT Groww Q4 FY26: Record Profits vs. Revenue Risks Groww shows massive scaling and profitability, though a heavy reliance on derivatives remains a key watchpoint. Key Highlights: Record Profits: ₹686 Cr PAT with a strong 44.7% margin. Operating Leverage: EBITDA surged ~142% YoY to ₹939 Cr. Massive Scale: Customer assets hit ₹3 Lakh Cr ( 36% YoY). SIP Growth: New SIP registrations jumped 61.5% YoY. Risk Factor: Over 54% of revenue comes from equity derivatives. Profitability Drag: Subsidiaries like Fisdom remain loss-making. Share this with your fellow investors and let us know: Is Groww’s derivative-heavy model a risk or a reward #Groww #Q4Results #Investors #Growth #RiskVsReward
1
2
17
1,704

Apr 21
GROWW Ltd Concall Summary for Q4FY26
TRANSITIONING FROM DISCOUNT BROKER TO AI-LED WEALTH PLATFORM
CORE HIGHLIGHT
- Evolving into a full-stack wealth management platform with strong market share gains, AI-driven efficiency, and long-term structural growth opportunity
MANAGEMENT COMMENTARY
- Company still in early innings despite being public for three quarters
- Strong focus on long-term compounding and platform building
- Clear segmentation across Wisdom, Wealth, and Prime verticals post Fisdom acquisition
- High confidence in gaining market share even during volatile cycles
- Impact: Positive — long-term vision with execution clarity
FUTURE OUTLOOK & GUIDANCE
- Margin expansion expected if revenue growth exceeds ~15%; stronger expansion at ~30% growth
- Costs (serve growth) expected to grow slower than revenue
- Fisdom projected to achieve profitability by FY28
- Industry expected to grow at ~10–15% CAGR, with cyclical spikes
- Impact: Positive — scalable model with operating leverage
INDUSTRY & MACRO TRENDS
- Massive underpenetration: ~70–80M investors vs ~500–600M internet users
- Industry growth highly cyclical, driven by bull markets
- FII flows remain key indicator for next growth phase
- Impact: Positive — long-term structural tailwinds intact
COMPETITIVE POSITIONING
- Market share in equity derivatives increased from 9.12% → 10.6%
- Differentiation through technology, product innovation, and user experience
- Value-based pricing vs zero-fee competitors
- Impact: Positive — gaining share with strong product moat
RISKS & CONCERNS
- Regulatory uncertainty in algo trading
- One-off risk costs due to volatility (commodities & geopolitical events)
- Market slowdown impacting equity participation
- Dependence on market cycles for growth acceleration
- Impact: Monitorable — cyclical regulatory risks
GROWTH DRIVERS & STRATEGY
WEALTH MANAGEMENT SCALE-UP
- Three-tier strategy:
• Wisdom (bank partnerships)
• Wealth (HNI/affluent)
• Prime (mass affluent)
- Integration of Fisdom expanding capabilities
- Impact: Positive — diversification beyond broking
AI-LED TRANSFORMATION
- GR1 research co-pilot for users
- AI-driven customer support
- AI integration in software development lifecycle
- Impact: Strong — productivity scalability driver
PRODUCT EXPANSION
- Scaling Margin Trading Facility (MTF)
- Entry into bonds (primary & secondary markets)
- Expansion in commodities segment
- Impact: Positive — deeper monetization per user
FINANCIAL & OPERATING METRICS
COST STRUCTURE
- Cost to operate expected to remain stable post Q1 FY27 normalization
- Employee costs increased due to investments in AI, AMC, and wealth segments
HEADCOUNT & PRODUCTIVITY
- Headcount ~1,800
- Focus on non-linear growth using AI (revenue growth > headcount growth)
MARKETING SPEND
- ~₹450–500 Cr annually
- Slight spike expected in Q1 due to IPL season
- Impact: Positive — controlled cost structure with scalability
PRODUCT MIX & USER BEHAVIOR
- Shift towards Mutual Funds, ETFs, SIPs due to market correction
- MTF book growing, driven by positional trading
- Active derivatives users increased from 14L → 17L
- Impact: Positive — diversified engagement across segments
MOAT CHARACTERISTICS
- Strong technology backbone and user experience
- AI integration across customer and internal workflows
- Multi-product ecosystem increasing user stickiness
- Growing market share in key segments
- Impact: Strengthening — platform-led advantage
KEY INSIGHT
- Groww is shifting from a transaction-led broking model to a platform-driven, AI-powered wealth ecosystem with multiple monetization levers
OUTLOOK
- Near-term growth tied to market conditions and FII flows
- Long-term growth driven by penetration, product expansion, and AI-led efficiency
- Wealth management vertical to play a key role in next phase
IMPACT
- Positive — strong long-term compounding story with cyclical near-term headwinds
#groww #concall #stockmarket #jiofinanial #q4fy26 #q4results @ThetaVegaCap @AToMCapital @thechartist26
1
7
2,926

Groww's first full-year numbers since listing last November tell a pretty striking story. It’s main rival Zerodha actually shrank last year revenue dropped 23% to ₹8,847 Cr as retail trading activity cooled across the industry. Groww went the other way: revenue up 19% to ₹4,645 Cr for the full year, with the latest quarter running even hotter. The bigger surprise is efficiency. Groww now earns almost as much profit per rupee of revenue as Zerodha does, at roughly half the size. On top of that, it has bought wealth app Finwizard (Fisdom) to expand beyond stocks and mutual funds, and global giant State Street is buying a stake in Groww's mutual fund business. For years, Zerodha was the clear leader everyone chased. That gap is now visibly closing.
#BillionbrainsGarageVentures #Q4FY26 #Fintech #FinancialServices $GROWW
1
6
140

Apr 21
🧵 GROWW
Q4 FY26 CONCALL DEEP DIVE
A Story of Resilience, Operating Leverage, and a Platform
Being Built for Hundreds of Quarters
Read Time: ~18 Minutes
━━━━━━━━━━━━━━━━━━━━━━━━━━━━━━━━━━━━━━━━━━━━━━━━
Let me tell you a story about a company that just delivered
its best-ever quarterly numbers inside what was genuinely
one of the most hostile operating environments Indian
broking has seen in a decade.
A SEBI regulatory
gut-punch that halved their core product's user base.
A sustained equity market correction since September 2024.
Massive FII outflows.
A commodity price spike in February.
An Iran war escalation in March.
US tariff wars rattling global sentiment.
And yet.
Revenue up 87.9% year on year (YoY).
Profit After Tax (PAT) up 122.1% YoY.
Earnings Before Interest Tax Depreciation and Amortisation
(EBITDA) margins at 62.4% consolidated and 66.93% platform.
National Stock Exchange (NSE) retail market share at 28.3%,
a new all-time high.
This is Groww's Q4 Financial Year 2026 (FY26) story.
━━━━━━━━━━━━━━━━━━━━━━━━━━━━━━━━━━━━━━━━━━━━━━━━
PART 1: THE NUMBERS THAT MATTER
━━━━━━━━━━━━━━━━━━━━━━━━━━━━━━━━━━━━━━━━━━━━━━━━
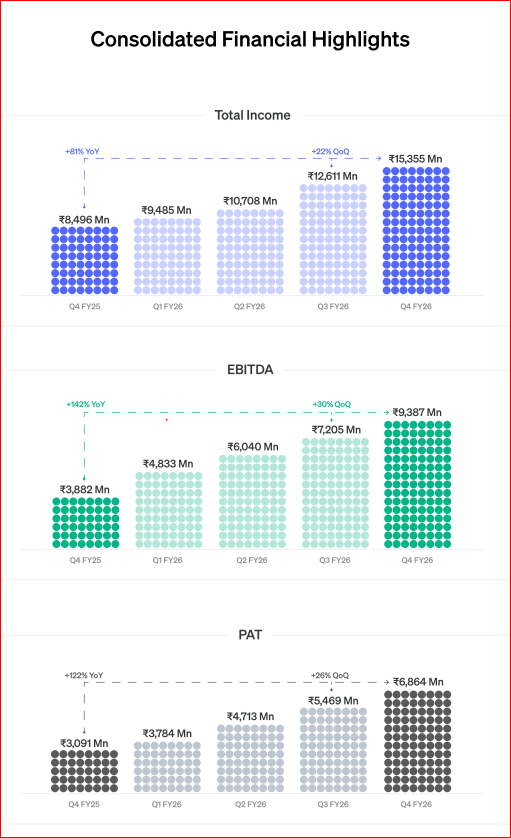
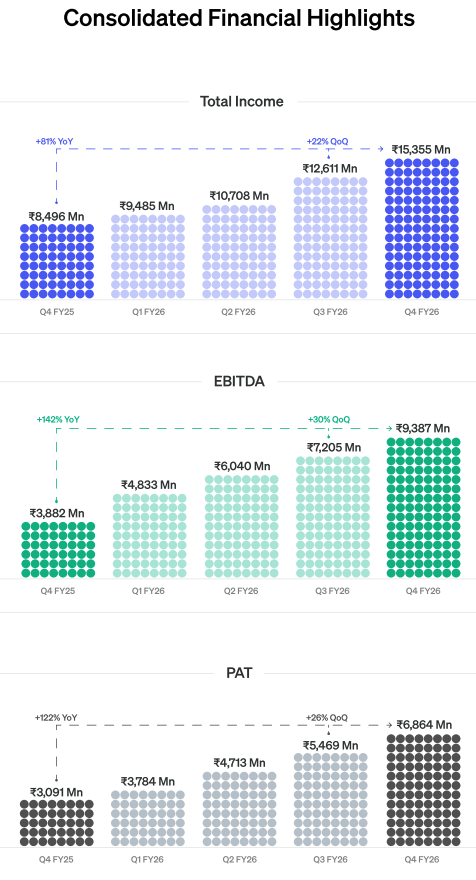
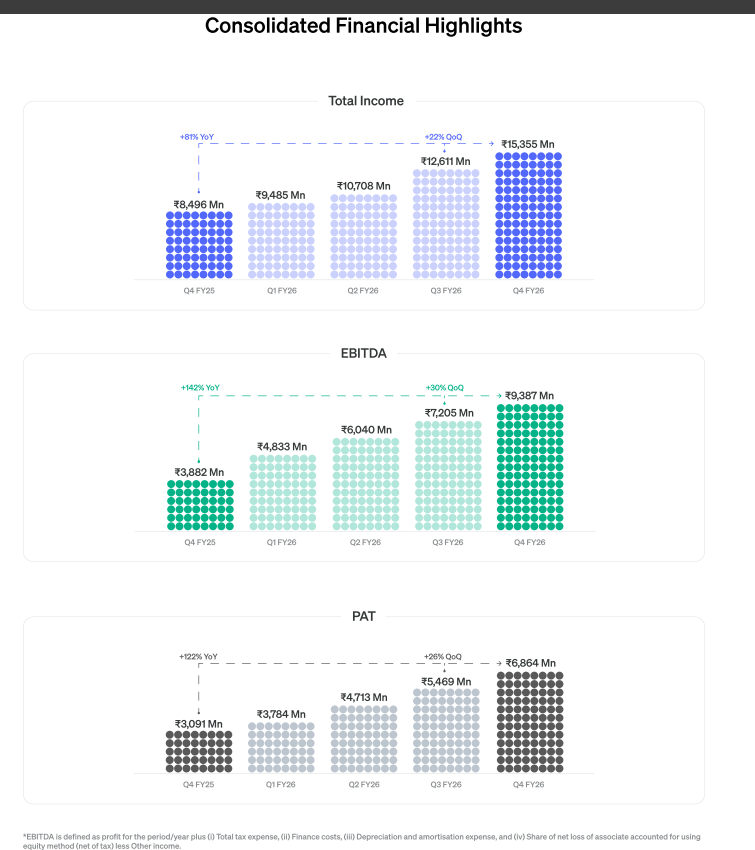
Q4 FY26 Headline Financials:
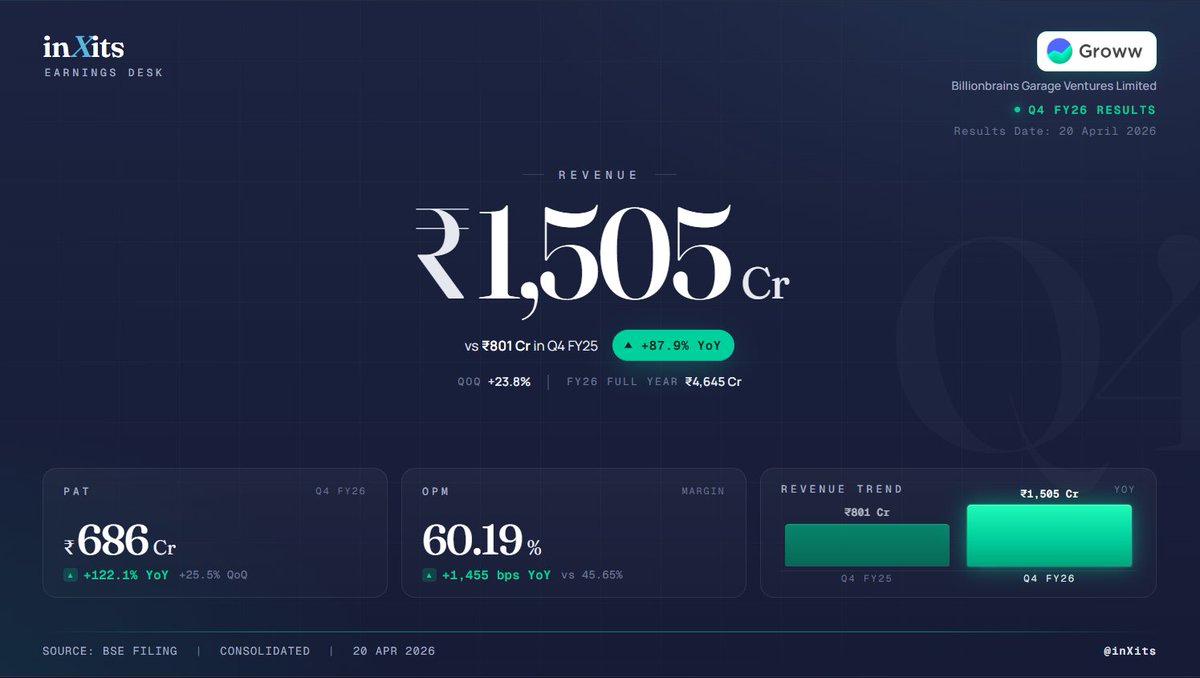
💰 Revenue from Operations: ₹1,505 crore ( 87.9% YoY)
💰 Total Income: ₹1,536 crore ( 80.7% YoY)
💰 Profit Before Tax (PBT): ₹936 crore ( 126.2% YoY)
💰 PAT: ₹686 crore ( 122.1% YoY, 25.5% quarter on quarter)
💰 EBITDA: ~₹939 crore ( 141.8% YoY)
💰 EBITDA Margin Consolidated: 62.4% vs 48.5% last year
💰 EBITDA Margin Platform Only: 66.93%
💰 PAT Margin: ~44.7% vs ~36.4% last year
Full Year FY26:
💰 Revenue: ₹4,645 crore ( 19% YoY)
💰 PAT: ₹2,083 crore ( 14.2% YoY)
💰 Total Assets: ₹18,541 crore vs ₹10,077 crore FY25
Operational Highlights:
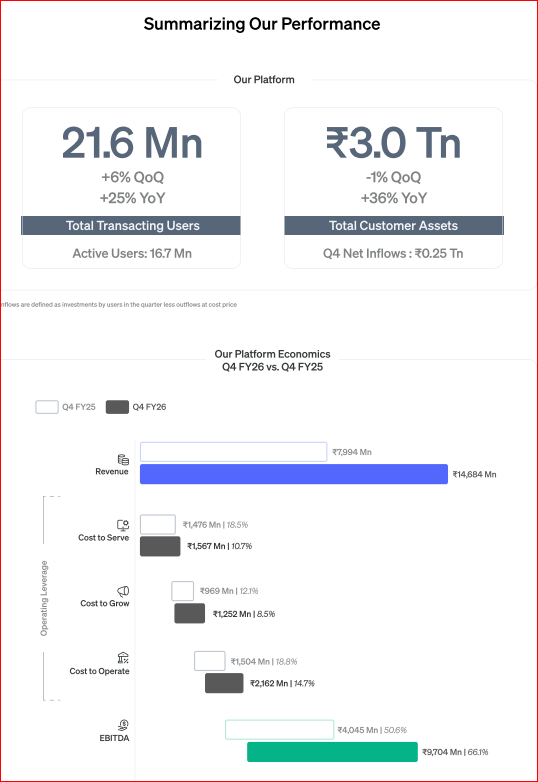
📊 Active Transacting Users: 2.16 crore ( 19.9% YoY)
📊 Total Customer Assets: ~₹3 lakh crore ( 35% YoY)
📊 Mutual Fund (MF) Systematic Investment Plan (SIP)
Inflows: 34.85% YoY
📊 MF Assets Under Management (AUM): 38.91% YoY
📊 NSE Retail Market Share: 28.3% (new all-time high)
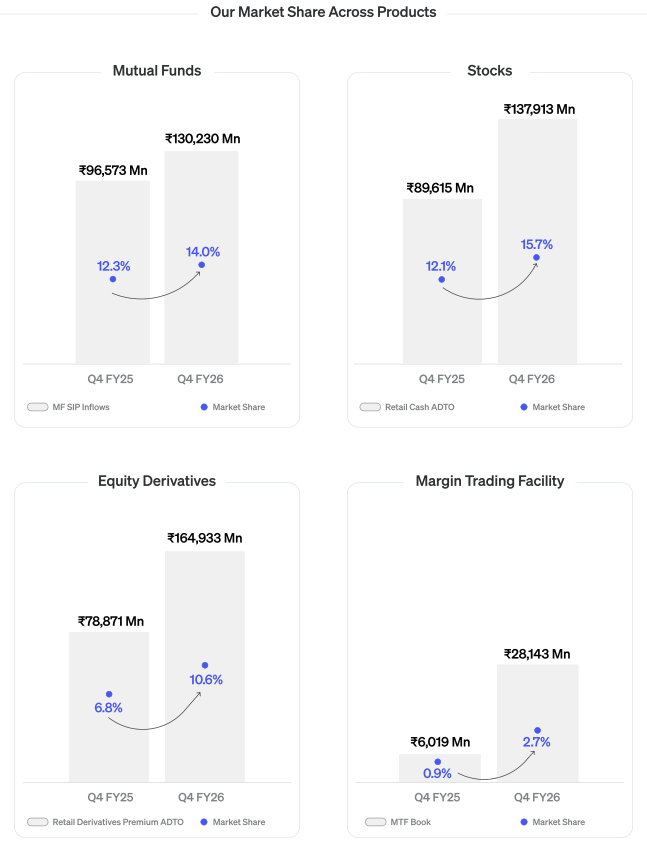
📊 Futures and Options (F&O) Market Share: 9.1% to 10.6%
in a single quarter ( 150 basis points)
📊 F&O Quarterly Active Customers: 14 lakh to 17 lakh
📊 Groww Asset Management Company (AMC) AUM: 2.5x in FY26
━━━━━━━━━━━━━━━━━━━━━━━━━━━━━━━━━━━━━━━━━━━━━━━━
PART 2: THE SEBI F&O SHOCK AND WHAT IT REVEALED
━━━━━━━━━━━━━━━━━━━━━━━━━━━━━━━━━━━━━━━━━━━━━━━━
In November 2024, SEBI issued its "True to Label" circular
restricting retail F&O access. The reason was blunt: SEBI's
own data showed 90% of retail F&O traders lose money over
any 3-year window.
The restrictions:
📌 Weekly expiries reduced to ONE contract per exchange
📌 Contract sizes increased, making options more capital
intensive for small retail traders
📌 Enhanced margin requirements introduced
📌 Intraday position monitoring tightened
Impact on Groww: F&O user penetration fell from ~18% to
~10% of all active users. Nearly halved. Permanently.
Here is what makes the Q4 FY26 story remarkable.
Despite F&O penetration being structurally at 10%, Average
Revenue Per User (ARPU) in Q4 FY26 is fully BACK to
pre-November 2024 levels.
Half the F&O users. Same ARPU.
The Chief Financial Officer (CFO) Ishan Bansal explained:
Margin Trading Facility (MTF) stepped up to fill the gap.
Commodities grew to 4% of revenue in under one year.
Average equity order value went up 66% YoY.
But here is the crucial nuance: The recovered ARPU is
BETTER QUALITY than the ARPU that was lost.
F&O brokerage is episodic. You earn when trades happen.
MTF income is daily interest on the outstanding loan book,
like Net Interest Margin (NIM) in a bank. It earns every
single day regardless of market volatility.
Groww did not just recover ARPU.
They recovered it through a more stable, more predictable
revenue stream. That is the most underappreciated
development in this entire result.
━━━━━━━━━━━━━━━━━━━━━━━━━━━━━━━━━━━━━━━━━━━━━━━━
PART 3: THE MTF STORY
━━━━━━━━━━━━━━━━━━━━━━━━━━━━━━━━━━━━━━━━━━━━━━━━
MTF is a SEBI-regulated product where a broker's Non-Banking
Financial Company (NBFC) arm lends money to clients to buy
more stock than their cash allows.
Simple example:
📌 You want ₹1,00,000 of Reliance. You have ₹50,000.
📌 MTF: You put up ₹50,000 as margin (50% required)
📌 Groww's NBFC (Creditserv) lends you ₹50,000
📌 You hold ₹1,00,000 of Reliance on leverage
📌 Groww charges 14-18% per annum on the loan daily
📌 If Reliance falls below Loan to Value (LTV) threshold,
Groww squares off to recover the loan
Revenue: Daily interest on outstanding book.
Every ₹1,000 crore of MTF book at 15% yield =
~₹150 crore annual income.
The MTF loan book grew from ₹1,055 crore (FY25) to
₹3,510 crore (FY26). 3.3x in ONE year.
And it grew organically. CFO Ishan Bansal confirmed most
MTF customers were already doing intraday trading and
simply started holding positions overnight via MTF.
Zero incremental Customer Acquisition Cost (CAC).
Zero marketing spend. Pure organic product graduation.
Two risk events flagged: February gold/silver spike caused
commodity client forced square-offs. March Iran war caused
MTF negative client balances. Both absorbed in Cost-to-
Operate (CTO). Both called one-time by management. But
two credit events in ONE quarter signals that as the book
scales toward ₹10,000-15,000 crore, absolute credit loss
magnitude will scale proportionally.
April 2026 MTF book: Above March levels. Recovery intact.
₹235 crore undeployed IPO capital ready to scale further.
━━━━━━━━━━━━━━━━━━━━━━━━━━━━━━━━━━━━━━━━━━━━━━━━
PART 4: THE RETENTION MOAT
━━━━━━━━━━━━━━━━━━━━━━━━━━━━━━━━━━━━━━━━━━━━━━━━
F&O user penetration is at 10%. Half of pre-November 2024.
Yet F&O market share went from 9.1% to 10.6% in Q4 FY26.
And F&O active customers grew from 14 lakh to 17 lakh.
How? CFO Ishan Bansal's answer is the most important thing
said on this entire call:
"Customers who were doing stocks and mutual funds last
quarter came BACK to derivatives because of the volatility
in January, February, March."
They never left Groww.
They were right there doing MF and stocks, waiting.
In calm markets: MF, SIP, stocks.
In volatile markets: F&O, commodities.
In rising markets with conviction: MTF.
One acquisition. Multiple product cycles. Near-zero churn.
In the NEXT BULL RUN: Groww at 28.3% market share will
disproportionately capture the surge in new investors AND
the reactivation of its entire dormant user base.
That is a non-linear revenue event current numbers cannot
fully price in.
━━━━━━━━━━━━━━━━━━━━━━━━━━━━━━━━━━━━━━━━━━━━━━━━
PART 5: THE COST STRUCTURE AND MARGIN FORMULA
━━━━━━━━━━━━━━━━━━━━━━━━━━━━━━━━━━━━━━━━━━━━━━━━
62.4% EBITDA margin for a business this scale is
extraordinary. Most Indian brokers operate at 25-35%.
Three cost buckets explained by CFO Ishan Bansal:
Cost to Serve (CTS): Tech infrastructure. Cost per
transaction FALLS as volumes scale. AI adds marginal
incremental cost but not proportional to revenue.
Direction: Declining as % of revenue.
Cost to Grow (CTG): Marketing and acquisition.
~₹450-500 crore annually. FIXED. Not scaling linearly.
Q1 FY27 slightly higher due to Indian Premier League (IPL).
Direction: Declining as % of revenue.
Cost to Operate (CTO): Employees, compliance, risk costs.
Q1 FY27 one-time appraisal bump. Post that: STABLE in
absolute for core Groww platform.
Direction: Core stable. Consolidated grows with Fisdom/AMC.
The CFO's explicit margin formula:
📌 Revenue growth above 15% = MARGINS EXPAND
📌 Revenue growth around 30% = MARGINS EXPAND SIGNIFICANTLY
📌 Revenue growth below 15% = MARGINS DO NOT EXPAND
Q4 FY26 revenue annualised: ₹1,505 crore x 4 = ₹6,020 crore
FY26 full year: ₹4,645 crore
Q4 exit rate is already 30% above the full year average.
Even with zero sequential growth: FY27 = 30% YoY.
Which per the formula means: margins expand significantly.
━━━━━━━━━━━━━━━━━━━━━━━━━━━━━━━━━━━━━━━━━━━━━━━━
PART 6: THREE STRATEGIC PILLARS
━━━━━━━━━━━━━━━━━━━━━━━━━━━━━━━━━━━━━━━━━━━━━━━━
PILLAR 1: COMPOUND THE CORE
📌 915 (Nine Fifteen): Sub-brand for professional active
traders. Named after NSE's 9:15 AM market open.
Advanced charting, F&O tools. Contributed to F&O
share gain in Q4. Dedicated FY27 marketing budget.
📌 Bonds Secondary Market: Just launched. Full fixed income
universe now available on platform.
📌 MTF Scaling: ₹235 crore undeployed capital ready.
📌 Commodities: 4% of revenue under one year. Growing.
PILLAR 2: SCALE WEALTH (THE ₹961 CRORE BET)
Groww acquired Fisdom (Finwizard Technology Private Limited)
in October 2025 for ₹961 crore. The accounting reality:
95.7% of that was goodwill. The acquired entity had NET
LIABILITIES of ₹60 crore. Groww paid for:
📌 HNI customer relationships: ₹63 crore assigned
📌 Retail customer relationships: ₹37 crore assigned
📌 Bank distribution partnership access and optionality:
₹920 crore goodwill
Three products activated:
FISDOM: Sells MFs and investments via bank tie-up channels.
W BY GROWW: HNI wealth advisory, Portfolio Management
Services (PMS), curated MF, structured products.
GROWW PRIME: Mass affluent tier. Launched January 2026.
Limited rollout only. Three months old at time of call.
The customer journey being built:
New investor via SIP → builds ₹5-10 lakh → Groww Prime
→ builds ₹25-50 lakh → W by Groww → HNI → Fisdom RM
CAC at every step = near zero. Customer is already on
the platform. Already built their wealth on Groww.
The honest assessment: After ₹961 crore and 2 full quarters,
both the CEO and CFO could not recall Fisdom and AMC
revenue on results day. CFO's exact words: "Sorry, I don't
remember." This means the revenue is immaterial enough
that neither founder tracks it mentally. Deep investment
phase. Fisdom profitability target: FY28.
PILLAR 3: AI INFLECTION POINT
📌 GR1 live: Consumer-facing Artificial Intelligence (AI)
research copilot within the app
📌 AI in Software Development Life Cycle (SDLC): Faster
product shipping with same headcount
📌 4 years ago: 3-4 products. Today: 12 products.
Headcount: ~1,800. Roughly stable across this period.
📌 CEO Lalit Keshre: "With the same strength we shipped
from 3-4 products to 12 products."
📌 FY27 called explicitly the inflection year for AI.
━━━━━━━━━━━━━━━━━━━━━━━━━━━━━━━━━━━━━━━━━━━━━━━━
PART 7: KEY RISKS
━━━━━━━━━━━━━━━━━━━━━━━━━━━━━━━━━━━━━━━━━━━━━━━━
🔴 RISK 1: FURTHER F&O REGULATION (THE BINARY RISK)
F&O is still 55% of Groww's revenue. SEBI's own data shows
90% of retail F&O traders lose money. Phase 2 curbs
(banning weekly expiries, adding position limits, mandatory
tests) could drop F&O penetration from 10% to 5%.
MTF and commodities cannot offset this in the short term.
An analyst asked: "What if it gets banned like a gaming app?"
Management deflected diplomatically. That is not a hedge.
This is the single binary risk in this investment case.
🔴 RISK 2: FISDOM GOODWILL IMPAIRMENT
₹920 crore goodwill on balance sheet. If FY28 breakeven
is missed, Indian Accounting Standards require impairment
testing. A 50% write-down = ₹460 crore non-cash PAT hit.
~22% of FY26 PAT in the year of impairment.
🟠 RISK 3: MTF CREDIT RISK AT SCALE
Two credit events in Q4 FY26. As book scales to
₹10,000-15,000 crore, absolute credit loss magnitude
in dislocation events scales proportionally.
🟠 RISK 4: T 0 SETTLEMENT FLOAT INCOME RISK
Groww holds ₹7,173 crore in settlement pool balances.
Estimated float income: ~₹360 crore annually.
If SEBI mandates real-time T 0 settlement, this disappears.
~17% hit to FY26 PAT. Full management answer not captured
on the call. Critical Investor Relations (IR) follow-up.
🔴 RISK 5: LOCK-IN EXPIRY OVERHANG
Pre-IPO investor lock-in expires approximately May 2026.
Major global Private Equity (PE) and Venture Capital (VC)
funds sitting on massive gains may sell simultaneously.
Concentrated supply event regardless of fundamentals.
━━━━━━━━━━━━━━━━━━━━━━━━━━━━━━━━━━━━━━━━━━━━━━━━
PART 8: BULL, BASE AND BEAR CASE SCENARIOS
━━━━━━━━━━━━━━━━━━━━━━━━━━━━━━━━━━━━━━━━━━━━━━━━
Starting Point — FY26 Actuals:
📌 Revenue: ₹4,645 crore | PAT: ₹2,083 crore
📌 EBITDA Margin: 62.4% | Market Cap: ~₹1,00,000 crore
📌 Price to Earnings (P/E) on FY26 PAT: ~48x
━━━━━━━━━━━━━━━━━━━━
🐂 BULL CASE
FIIs return by Q2 FY27. No further F&O curbs. MTF scales
to ₹8,000 crore book. Fisdom on FY28 breakeven track.
Stock advisory launches H2 FY27. AI productivity visible.
Key Assumptions:
📌 Revenue growth: 35-40% FY27, 30-35% FY28
📌 EBITDA margin expands to 68-70% by FY28
📌 Commodities reaches 8-10% of revenue
📌 AMC AUM compounds to ₹60,000-70,000 crore by FY28
FY27 Bull: Revenue ~₹6,300-6,500 Cr | PAT ~₹3,000-3,200 Cr
FY28 Bull: Revenue ~₹8,500-9,000 Cr | PAT ~₹4,500-5,000 Cr
Fair Value: 45-50x FY28 PAT
Implied Market Cap: ₹2,00,000-2,50,000 crore
📈 Upside from current: 100-150% over 2 years
━━━━━━━━━━━━━━━━━━━━
🎯 BASE CASE
FIIs return gradually Q3-Q4 FY27. Markets range-bound
H1 FY27. No further F&O curbs. Fisdom slow but steady.
No advisory or algo revenue in the period.
Key Assumptions:
📌 Revenue growth: 25-28% FY27, 22-25% FY28
📌 MTF book reaches ₹5,500-6,000 crore by FY27 end
📌 EBITDA margin expands modestly to 63-65% by FY28
📌 F&O penetration stable at 10%
FY27 Base: Revenue ~₹5,800-5,950 Cr | PAT ~₹2,650-2,800 Cr
FY28 Base: Revenue ~₹7,200-7,500 Cr | PAT ~₹3,400-3,700 Cr
Fair Value: 35-38x FY28 PAT
Implied Market Cap: ₹1,19,000-1,40,000 crore
📈 Upside from current: 19-40% over 2 years
━━━━━━━━━━━━━━━━━━━━
🐻 BEAR CASE
SEBI Phase 2 F&O curbs in FY27. FIIs remain negative.
T 0 settlement mandated. MTF credit event materialises.
Fisdom goodwill impairment triggered in FY28.
Key Assumptions:
📌 Revenue growth: 8-12% FY27, 10-15% FY28
📌 F&O penetration falls 10% to 5% on Phase 2 curbs
📌 T 0 eliminates ~₹360 crore float income
📌 MTF one-time credit charge: ₹200-300 crore
📌 Fisdom goodwill write-down: ₹300-460 crore in FY28
📌 EBITDA margin compresses to 55-58%
FY27 Bear: Revenue ~₹5,000-5,200 Cr | PAT ~₹1,700-1,900 Cr
FY28 Bear: Multiple compresses to 30-35x on missed growth
Implied Market Cap: ₹51,000-66,500 crore
📉 Downside from current: 33-49%
━━━━━━━━━━━━━━━━━━━━━━━━━━━━━━━━━━━━━━━━━━━━━━━━
PART 9: UNPRICED OPTIONALITIES
━━━━━━━━━━━━━━━━━━━━━━━━━━━━━━━━━━━━━━━━━━━━━━━━
These are revenues in NONE of the scenarios above.
Each is a separate call option on the stock.
🎰 STOCK ADVISORY SUBSCRIPTION
Most-requested product per Groww's own Voice of Customer
(VoC) data. Not launched yet. SEBI Investment Adviser (IA)
regulations being navigated.
At ₹500-1,000/month for 1-3% of active users:
Revenue potential: ₹130-650 crore annually.
Near-100% EBITDA margin product. Zero infrastructure cost.
🎰 ALGO TRADING (POST-SEBI FRAMEWORK)
SEBI retail algo trading framework final circular pending.
Zero algo revenue today.
Algo clients generate 50-100x order flow vs manual retail.
At 28% market share: Every 1 lakh algo clients =
₹200-400 crore incremental annual brokerage.
🎰 INSURANCE DISTRIBUTION
Groww Insurance Broking Private Limited already exists.
2.16 crore active investors, most underinsured.
Term life, health, vehicle at 10-15% commission =
₹200-500 crore revenue potential from existing users.
🎰 AMC AT SCALE
At ₹1 lakh crore AUM (achievable in 3-5 years):
Total Expense Ratio (TER) at 0.25-0.40% =
₹250-400 crore annual recurring income.
🎰 LOANS AGAINST SECURITIES (LAS)
Borrowing against stocks already owned.
Even 5% of users at ₹5 lakh average =
₹5,400 crore book = ~₹700-800 crore annual NIM.
Product not yet live. Natural MTF adjacency.
━━━━━━━━━━━━━━━━━━━━━━━━━━━━━━━━━━━━━━━━━━━━━━━━
PART 10: VALUATION USING MULTIPLE APPROACHES
━━━━━━━━━━━━━━━━━━━━━━━━━━━━━━━━━━━━━━━━━━━━━━━━
Current Market Cap: ~₹1,00,000 crore
FY26 PAT: ₹2,083 crore | FY26 Revenue: ₹4,645 crore
P/E VALUATION:
📌 Current: 48x FY26 PAT
📌 Base FY28: 35-40x on ₹3,500 crore PAT
= ₹1,22,500-1,40,000 crore ( 22-40% upside)
📌 Bull FY28: 45-50x on ₹4,750 crore PAT
= ₹2,13,750-2,37,500 crore ( 113-137% upside)
PRICE TO SALES (P/S) VALUATION:
📌 Current: ~21.5x FY26 revenue
📌 At base FY28 revenue ₹7,300 crore:
20x P/S = ₹1,46,000 crore ( 46% upside)
25x P/S = ₹1,82,500 crore ( 82% upside)
SUM OF THE PARTS (SOTP) VALUATION:
Core Broking (FY28):
40-50x PAT ~₹3,000 crore = ₹1,20,000-1,50,000 crore
MTF/NBFC Business:
₹8,000-10,000 crore book x 3x = ₹24,000-30,000 crore
Groww AMC:
₹50,000-70,000 crore AUM x 4.5% = ₹2,250-3,150 crore
Wealth (W, Prime, Fisdom at breakeven):
Optionality value: ₹5,000-8,000 crore
Undeployed Cash: ~₹644 crore
SOTP Bull FY28 Total: ~₹1,52,000-1,92,000 crore
Upside from current: 52-92%
DISCOUNTED CASH FLOW (DCF) SANITY CHECK:
Free Cash Flow (FCF) FY27E: ~₹2,700 crore
FCF FY28E: ~₹3,500 crore
Growth years 3-7: 20% per annum
Terminal growth rate: 8%
Weighted Average Cost of Capital (WACC): 13%
DCF Implied Value: ~₹95,000-1,10,000 crore
Confirms: Current price is FAIRLY VALUED on base case
with ZERO optionality credit.
VALUATION CONCLUSION:
📌 Current price = fair value for the known business
📌 BUY if you believe in even 1-2 of the 5 optionalities
📌 FAIRLY VALUED if base case only, no optionalities
📌 EXPENSIVE if SEBI F&O Phase 2 wealth disappointment
happen simultaneously
Risk-reward over 2 years:
Bull upside: 100-150% | Bear downside: 33-49%
Skews positive IF FII flows return to India in 2-4
quarters AND F&O regulation stays stable.
The single most important variable to watch:
SEBI's next communication on F&O regulations.
Everything else is secondary.
━━━━━━━━━━━━━━━━━━━━━━━━━━━━━━━━━━━━━━━━━━━━━━━━
━━━━━━━━━━━━━━━━━━━━━━━━━━━━━━━━━━━━━━━━━━━━━━━━
PART 11: THE Q&A MOMENTS THAT MATTER MOST
━━━━━━━━━━━━━━━━━━━━━━━━━━━━━━━━━━━━━━━━━━━━━━━━
Seven analysts from India's top institutional desks were
on this call. Here are the exchanges that reveal the most
about where this business is really heading.
THE MOST IMPORTANT ANSWER ON THE CALL:
Analyst Abhijeet Mundhra from Nuvama Institutional asked:
"What do your mature customers most want that Groww does
not yet offer?"
CFO Ishan Bansal's response:
"Stock advisory and MF advisory. This is probably one of
the highest asked questions on our Voice of Customer data.
It is a top request from mature customers. We will launch
it when we have the right product and the timing is right."
Let that register.
2.16 crore active users.
The most-requested product confirmed by management.
Not yet launched.
At even 1% subscription at ₹1,000 per month =
₹259 crore annual recurring revenue.
At 5% = ₹1,296 crore annually.
Near 100% EBITDA margin.
Zero customer acquisition cost.
This is the single largest unpriced optionality
in the entire Groww investment case sitting right there
in plain sight. Every quarter it stays unlaunched is
₹100-300 crore of foregone high-margin revenue.
THE MOST REVEALING MISS ON THE CALL:
Analyst Madhur Sharma from ICICI Securities asked for the
revenue breakdown between Fisdom and Groww AMC.
CFO Ishan Bansal: "Sorry, I don't remember the exact split."
CEO Lalit Keshre also could not recall.
Both deferred to IR offline.
After a ₹961 crore acquisition completed 6 months ago,
neither the CEO nor CFO could recall the revenue on
results day. This tells you everything. The combined
Fisdom and AMC revenue contribution is so immaterial
that it does not appear on either founder's mental
dashboard. Confirmed investment phase. Confirmed years
away from meaningful contribution.
THE MOST HONEST MACRO COMMENT:
CFO Ishan Bansal on the industry growth cycle:
"We might need to wait for a few more quarters to say
that we are in the next cycle of growth. As of now it
does not look like it is obvious. We are wary of
macroeconomic factors. We are waiting for FIIs to start
putting money back into India."
This is unusually direct for a management team on a
quarterly results call where the numbers were excellent.
The message: Do not extrapolate Q4 FY26's exceptional
performance into Q1 and Q2 FY27 linearly. The macro
environment is genuinely uncertain. H1 FY27 may be softer
before the next cycle begins.
THE PARADOX QUESTION:
Analyst Sanketh Godha from Avendus Spark asked how F&O
market share jumped 150 basis points despite F&O user
penetration being structurally lower.
CFO Ishan Bansal's explanation revealed the retention
moat perfectly: "Customers who were doing stocks and MFs
came back to derivatives because of the volatility. From
14 lakh to 17 lakh derivative customers in one quarter.
That is a good indication of what happened."
The volatility reactivation of dormant users is powerful.
But it also means the 10.6% share may moderate in calm
quarters. It is not necessarily a permanent new floor.
Watch Q1 FY27 F&O share as the first test of this.
THE COMPETITIVE QUESTION DEFLECTED GRACEFULLY:
Goldman Sachs analyst Vivek Gautam asked Lalit directly
what differentiates 915 from Zerodha for active traders.
Lalit's response named zero features, zero specific
advantages, and never once mentioned Zerodha by name.
Instead: "Our differentiator is the experience we give
customers. We have not seen excessive attrition from
this customer base despite multiple other entrants."
That last line is the most important part. If Zerodha
were genuinely winning active traders from Groww at scale,
management could not say this with confidence on a
recorded investor call. The non-attrition data point is
the real competitive signal buried in a diplomatic answer.
━━━━━━━━━━━━━━━━━━━━━━━━━━━━━━━━━━━━━━━━━━━━━━━━
PART 12: PEER COMPARISON IN 60 SECONDS
━━━━━━━━━━━━━━━━━━━━━━━━━━━━━━━━━━━━━━━━━━━━━━━━
GROWW vs ANGEL ONE (primary listed peer):
📊 NSE Market Share: Groww 28.3% vs Angel ~15-16%
📊 EBITDA Margin: Groww 62.4% vs Angel ~27-35%
📊 Q4 FY26 PAT: Groww ₹686 crore vs Angel ~₹212 crore
📊 Active Users: Groww 2.16 crore vs Angel ~0.78 crore
📊 MTF Book: Groww ₹3,510 crore vs Angel ~₹5,310 crore
(Angel ahead on MTF — Groww has clear catch-up runway)
📊 Valuation: Groww ~48x FY26 PAT vs Angel ~16-18x
Groww leads on: Margins, market share, user scale,
product breadth, MF/SIP growth, brand strength.
Angel leads on: MTF book size, cheaper valuation,
longer wealth management track record.
GROWW vs ZERODHA (unlisted):
📊 NSE Market Share: Groww 28.3% vs Zerodha ~22-24%
Groww has crossed Zerodha. A landmark.
📊 Zerodha has no AMC, no HNI wealth product, no
commodities platform at Groww's scale.
📊 Zerodha caters to sophisticated traders.
Groww is mass-market AND active trader via 915.
📊 Groww's multi-product ecosystem has no comparable
in the listed Indian broking universe.
THE BIG PICTURE
CEO Lalit Keshre's framing to anchor on:
"70 to 80 million investors versus 500 to 600 million
people who use the internet and transact on it. It feels
like we can continue working for hundreds of more quarters."
India has barely 13-16% financial penetration of its
digitally active population. Groww has built the platform
that will capture this generation of investors.
What FY26 proved: Even in an adversarial environment,
Groww can maintain 28% market share, recover ARPU via
product diversification, hold 62% EBITDA margins,
generate ₹686 crore PAT in a single quarter, grow active
users 20% YoY, and launch 4-5 new products with 1,800
people.
FY27 and FY28 are not about whether Groww can maintain
the platform. They clearly can. The question is whether
the wealth bet delivers, whether stock advisory unlocks,
and whether FIIs return to India to ignite the next cycle.
This is a company being built for hundreds of quarters.
Not the next one.
2
3
15
2,804

GROWW – MANAGEMENT COMMENTARY 🟢
• Options volumes unchanged post STT hike
• Slight impact observed on futures volumes
• IPL spend ₹50–60 Cr in Q1FY27
• Annual marketing cost guided at ₹450–500 Cr
• Fisdom expected to turn profitable by FY28
• Engaging regulator to ease MTF restrictions
• Revenue growth guidance at 25–30% annually
• Growth contingent on supportive bull market conditions
#Groww #groww #swingtrading #Markets #NiftyBank

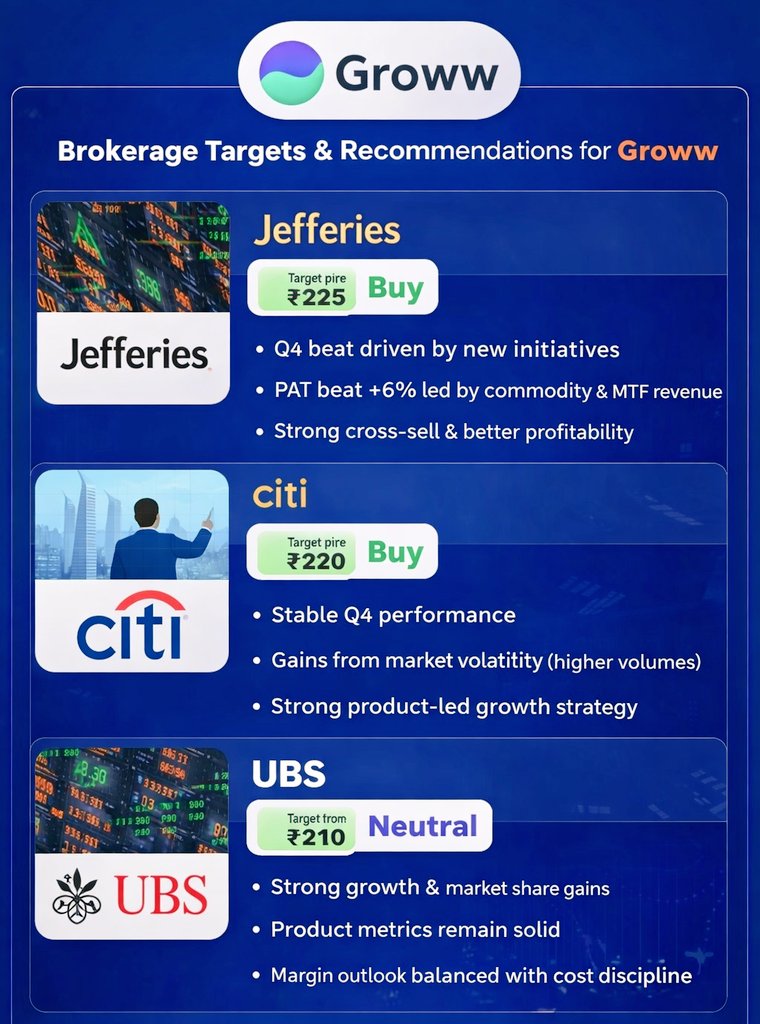
📊 Stock Radar: Groww 🔥🔥
🔹 Jefferies 🎯 Target: ₹225 (↑ from ₹210)
✅ Recommendation: Buy
• Q4 beat driven by new initiatives
• PAT beat 6% led by commodity & MTF revenue
• Strong cross-sell better profitability
🔹 Citi 🎯 Target: ₹230 (↑ from ₹225)
✅ Recommendation: Buy
• Stable Q4 performance
• Gains from market volatility (higher volumes)
• Strong product-led growth strategy
🔹 UBS 🎯 Target: ₹210 (↑ from ₹185)
⚖️ Recommendation: Neutral
• Strong growth & market share gains
• Product metrics remain solid
• Margin outlook balanced with cost discipline
💡 Summary: Multiple brokerages remain positive on Groww with improving targets, strong growth drivers, and expanding product ecosystem.
#StockMarket #Investing #Groww #BrokerageViews #Nifty #Markets
#Stockmarketindia
4
140

Apr 21
Billionbrains Garage Ventures / Groww hits a fresh high
Management sounds optimistic
1⃣ Revenue growth expectation of 25-30% in FY27, outpacing FY26
2⃣ Target market share in MTF should be as much as cash market share
3⃣ Fisdom to be profitable by FY28
youtu.be/gIOV4-pvnBI

7
70
15,740

Apr 21
Some guidance from Groww
Wealth management biz Fisdom, acquired last year for over $100 mn, will be profitable in FY28.
Added that the asset management unit Groww MF will break even when AUM scales up 5-6x of the current number, which is Rs 3,800 crore.
Apr 20

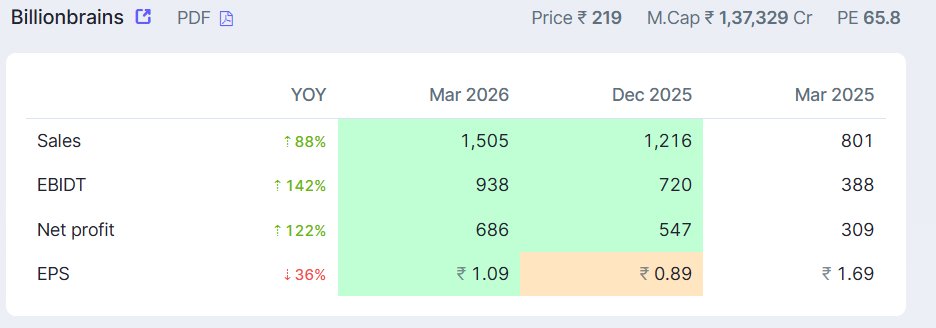
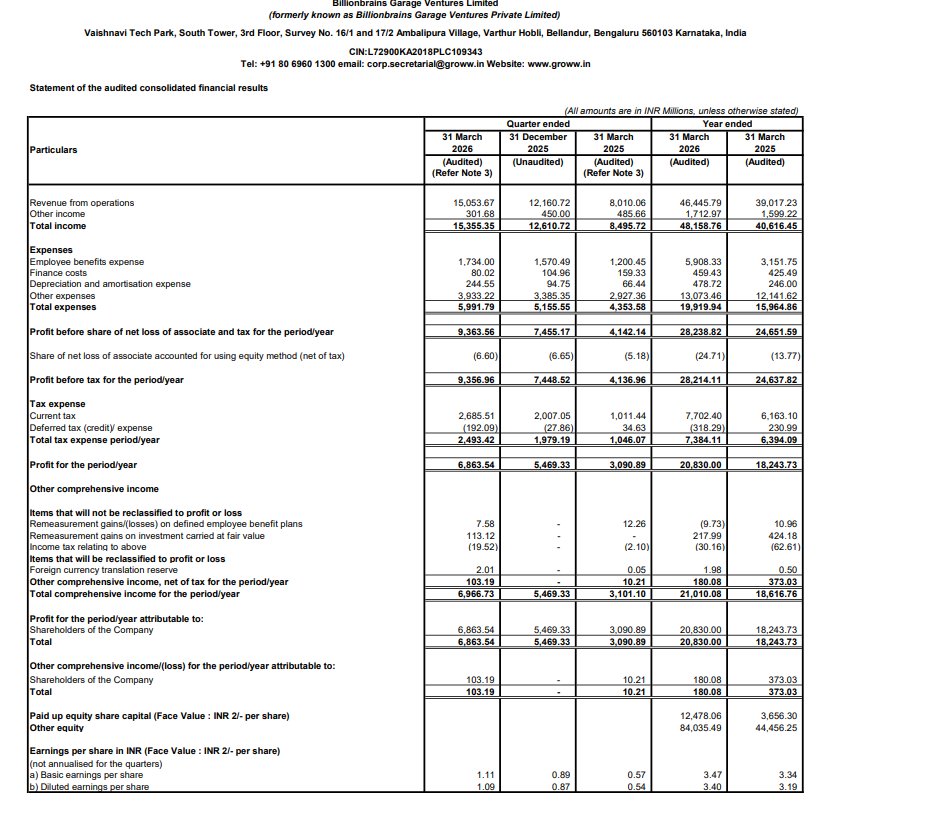
🚨 Groww has reported 88% YoY increase in operating revenues to Rs 1,505 crore.
Profit after tax up 122% YoY to Rs 686 crore.
Says market share in equity derivatives now stands at 10.6% from 6.8% last year.
2
25
6,209

Apr 21
Billionbrains Garage Ventures: Guidance - Fisdom, a wealth management acquisition, is projected to be profitable by FY28.- Concall Update
Billionbrains Garage Ventures: Guidance - AI is expected to improve customer experience and internal team productivity, enabling faster and better shipping.- Concall Update
Billionbrains Garage Ventures: Guidance - Cost to serve is expected to decrease as a percentage of revenue, despite absolute increases due to AI-related tech costs.- Concall Update
Billionbrains Garage Ventures: Guidance - Cost to grow will increase slightly but at a rate lower than revenue growth, supporting new brands like W and 915.- Concall Update
Billionbrains Garage Ventures: Guidance - Cost to operate for the Groww platform will increase in Q1 due to appraisals, then stabilize for the rest of the year.- Concall Update
Billionbrains Garage Ventures: Guidance - Margin expansion is correlated with revenue growth; if revenue grows beyond 15%, margins will expand.- Concall Update
Billionbrains Garage Ventures: Guidance - Marketing spend in Q1 is generally higher, and this year's spend will likely exceed last year's.- Concall Update
Billionbrains Garage Ventures: Guidance - The industry's growth rate is significantly higher during bull runs, with a long-term CAGR of 10% to 15%.- Concall Update
5
7
152
24,543

Apr 20
📊 Billionbrains Garage Ventures (GROWW) Q4 FY26 concall - Wealth Scale & Margin Levers
🚀 Strategic Initiatives & Outlook
- Public listing milestone achieved strengthening brand credibility and growth runway
- Wealth expansion via Fisdom acquisition and launch of W and Prime offerings
- AMC AUM surged 2.5x YoY indicating strong traction in asset management
📈 Broking Business Momentum
- Equity derivatives market share rose to 10.6% from 9.1% QoQ
- Active derivatives traders grew to 1.7M vs 1.4M QoQ
- MTF scaling strong driven by existing users boosting engagement and monetization
- Customer acquisition shifting towards mutual funds and ETFs for long term AUM build
💼 Wealth & New Businesses
- Fisdom integration underway profitability targeted by FY28
- Groww Prime in pilot phase focusing on premium experience before scale rollout
📊 Financials & Margins
- Cost to grow stable at ₹450-500 Cr annually, expected to grow slower than revenue
- Margin expansion linked to revenue growth above 15% threshold
- ARPU recovery driven by MTF and commodities offsetting lower F&O mix
🤖 Tech & Efficiency
- AI deployment across development lifecycle improving speed and efficiency
- Goal to scale output without increasing headcount significantly
🎯 Market Outlook
- Long term industry growth intact with 10-15% CAGR and strong upside in bull cycles
📊 Source: concall.in?utm_source=tii
🚫 No Recommendation
#GROWW #Q4FY26 #Concall

2
4
21
2,483

Apr 20
Groww (Billionbrains Garage Ventures) – Scale is turning into dominance.
#Q4FY26 #Nifty #GROWW
This wasn’t just a good quarter.
It was a market share grab across almost every segment.
Q4FY26 Snapshot
• Total Income: ₹1,535.5 Cr ( 81% YoY, 22% QoQ)
• EBITDA: ₹938.7 Cr ( 142% YoY)
• PAT: ₹686.4 Cr ( 122% YoY)
Operating leverage is massive.
User Engine Keeps Expanding
• Transacting Users: 2.16 Cr ( 25%)
• Active Users: 1.67 Cr ( 20%)
• Customer Assets: ₹3 Lakh Cr ( 36% YoY)
• Net Inflows (Q4): ₹25,000 Cr
Even with markets correcting ~16–17%, engagement stayed strong.
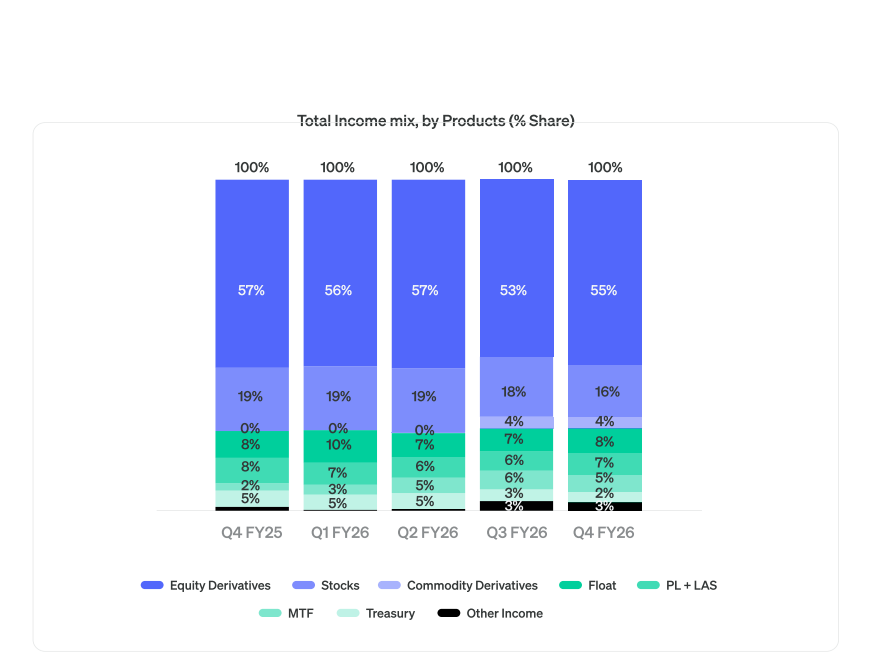
Revenue Mix → Still derivative-heavy
• Equity Derivatives: 54.6%
• Stocks: 16%
• MTF: 5%
• Commodities: 4%
• Float LAS Others: 20–25% combined
New segments like MTF commodities are scaling fast.
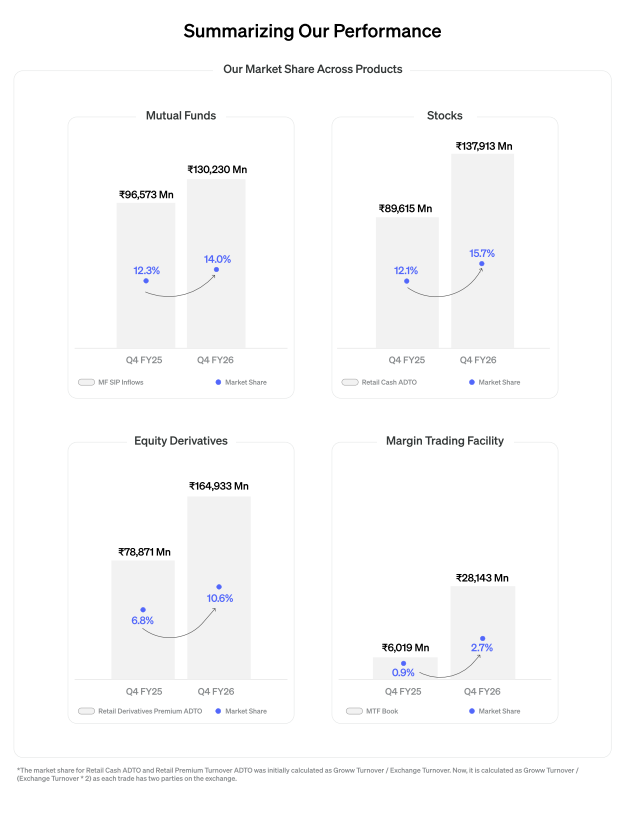
Where market share jumped
1. Mutual Funds
• SIP Inflows: ₹13,023 Cr ( 34.9%)
• Market Share: 14.0% (vs 12.3%)
SIPs created on platform: 61.5% YoY
2. Stocks
• Retail Cash ADTO: ₹13,791 Cr ( 53.9%)
• Market Share: 15.7% (vs 12.1%)
Turnover per user: 25.4%
3. Equity Derivatives
• Premium ADTO: ₹16,493 Cr ( 109.1%)
• Market Share: 10.6% (vs 6.8%)
Orders per user: 43.1%
4. Margin Trading (MTF)
• Book: ₹2,814 Cr ( 4.67x YoY)
• Market Share: 2.7% (vs 0.9%)
• Q4 Growth: 22% QoQ
This while industry MTF contracted ~7%.
That’s real share capture.
Early Investments (still loss-making)
• Fisdom Loss: ₹10.2 Cr
• Groww AMC Loss: ₹21.4 Cr
Fisdom expected to turn profitable by FY28.
Bottom Line
Groww is no longer just a discount broker.
It’s becoming a full financial platform, broking MF MTF AMC wealth stack.
And right now, it’s taking share faster than most incumbents can react.
1
2
574

Groww Q4FY26: Solid Set with market share gains across key products
Q4FY26
Total Inc🔼81% - 1,536 Cr
EBITDA 🔼142% - 939 Cr
PAT 🔼122% - 686 Cr
(QoQ growth of 26%)
PAT margin expanded meaningfully to 45% vs 37% last year driven by strong operating leverage
Platform scale improving steadily
Total transacting users 🔼25% - 21.6 Mn
Active users 🔼20% - 16.7 Mn
Customer assets 🔼36% - 3.0 Tn
Market share improving across segments
MF SIP inflow share increased to 15.7% vs 12.1% YoY
MTF market share increased to 2.7% vs 0.9%
Retail derivatives premium ADTO share increased to 10.6%
MF business showing strong traction vs industry
New SIPs created 🔼62% YoY
SIP inflows 🔼35% vs industry growth of 19%
Equity derivatives scaling rapidly
Orders per user 🔼43%, Active users 🔼22%
Revenue mix still derivatives heavy but diversified gradually
Equity derivatives contribution increased to 55% of revenue
MTF & commodities gaining share sequentially
Consumer credit contributed 4% to PAT in Q4
Balance sheet lending scaling via
• MTF book • LAS • Personal loans
MTF book scaling faster than industry despite weak markets
MTF book 🔼22% QoQ while industry declined 7% QoQ
Platform EBITDA reached 970 Cr before subsidiary losses adjustment
Subsidiary investments still early stage
Fisdom loss - 10 Cr
Groww MF loss - 21 Cr
Both expected to turn profitable over medium term
Operating leverage now clearly visible
Market share gains across MF, derivatives & MTF
Credit vertical emerging as next earnings driver
Positioned structurally strong among digital brokers & will continue to outperform the sector

2
63
24,613

Apr 20
Billionbrains Garage Ventures (Groww) Q4FY26
#Q4FY26 #Stockmarket #Nifty #groww
➤ Total Income ₹1,535.50 Cr ( 81% YoY & 22% QoQ)
➤ EBITDA ₹938.70 Cr ( 142% YoY & 30% QoQ)
➤ PAT ₹686.40 Cr ( 122% YoY & 26% QoQ)
➤ Transacting Users 2.16 Cr ( 25% YoY & 6% QoQ)
➤ Active users 1.67 Cr
Active Users ( 19.9% YoY & 4.7% QoQ)
➤ Customer Assets ₹3 lakh Cr ( 36% YoY & -1% QoQ)
➤ Q4 Net Inflows ₹25,000 Cr
➤ Revenue Mix
✓ Equity Derivatives 54.6% (↑ from 53.5%)
✓ Stocks 16% (declining share trend)
✓ MTF (Margin Trading Facility) 5%
✓ Commodity Derivatives 4%
✓ Float Income PL/LAS Others 20–25% combined
➤ Newly launched product segments, namely MTF & commodities, witnessed strong traction, with their share increasing meaningfully, driven by higher penetration and user adoption
Market Share Gains
➤ Mutual Funds
✓ MF SIP Inflows ₹13,023 Cr ( 34.85% YoY)
✓ Market Share 14.0% (↑ from 12.3% YoY)
➤ Stocks
✓ Retail Cash ADTO ₹13,791 Cr ( 53.89% YoY)
✓ Market Share 15.7% (↑ from 12.1% YoY)
➤ Equity Derivatives
✓ Retail Derivatives Premium ADTO ₹16,493 Cr ( 109.12% YoY)
✓ Market Share 10.6% (↑ from 6.8% YoY)
➤ Margin Trading Book ₹2,814 crore ( 4.67x YoY)
✓ Market Share 2.7% (↑ from 0.9% YoY)
➤ MTF Book
✓ Growth 22% QoQ in Q4
✓ Markets declined ~16–17% during Q4
✓ Industry MTF book contracted ~7% QoQ
✓ Increased market share in MTF
➤ Mutual Funds
✓ SIPs created on Groww ( 61.5% YoY & 10.4% QoQ) (well above industry)
✓ Inflows ( 34.8% YoY & 5.6% QoQ)
➤ Stocks
✓ Turnover per user ( 25.4% YoY & 13.8% QoQ)
✓ Active users ( 18.8% YoY & 3.5% QoQ)
➤ Derivatives
✓ Orders per user ( 43.1% YoY & 8.7% QoQ)
✓ Active users ( 21.7% YoY & 14.7% QoQ)
➤ Fisdom Loss ₹10.2 crore (early stage)
➤ Groww MF (AMC) Loss ₹21.4 crore
➤ Fisdom, acquired in October 2025, is in early stages of integration and scale. We expect it to be profitable in FY28.

Apr 20

Billionbrains Garage Ventures (Groww) Q4FY26 Results:-
#Q4Results #Q4FY26 #Stockmarket #Nifty #groww
Revenue 1505.37 Cr vs 801.01 Cr
( 87.93% YoY┃ 23.79% QoQ)
EBITDA 938.65 Cr vs 388.23 Cr
( 141.78% YoY ┃ 30.28% QoQ)
EBITDA Margin 62.35% vs 48.47% YoY & 59.25% QoQ
PBT 935.70 Cr vs 413.70 Cr
( 126.18% YoY┃ 25.62% QoQ)
PAT 686.35 Cr vs 309.09 Cr
( 122.06% YoY┃ 25.49% QoQ)
Other Income 30.16 Cr vs 48.56 Cr YoY & 45 Cr QoQ
4
29
3,420

Apr 1
🚨🚨More consolidation in the fintech space..
Dhan in talks to acquire Elevation Capital-based Infinyte Club in cash and equity deal estimated to be around $10 million in size, according to people in the know.
Founded in 2023 by Ankita Tandon and Joylita Saldanha, Infinyte Club offers wealth management tools targeted at startup employees and operators.
Publicly listed Groww acquired wealthtech startup Fisdom last year in a $150 million all-cash deal.
In August 2024, Infinyte Club raised $3.6 million in a funding round led by Elevation Capital, with participation from angel investors including Kunal Shah, Vidit Aatrey, Gaurav Munjal, Harshil Mathur and others.
@TanishkaDubey2 @ETtech
1
5
32
5,413

Mar 20
Dalal Street saw its worst day in more than 20 months on Thursday, as equity benchmarks plunged over 3% in a broad sell-off led by financial sector stocks. Sentiment darkened particularly in private banks, driven by stock-specific concerns as well as a wider risk-off mood.
According to BSE provisional data, FIIs were net sellers of ₹7,558 crore, while DIIs bought shares worth ₹3,864 crore.
The escalation in West Asia, marked by strikes on critical energy assets across countries, has triggered an oil price shock, raising the risk of a prolonged period of elevated energy prices, said Nirav Karkera, head of research and fund manager of PMS division at Fisdom.
1
1
2
361

Mar 11
#Closingbell
Live: Sensex, Nifty slip over 1% as volatility inches up; Brent back above $90/bbl | Closing Bell. Catch @lovishadarad in conversation with Ashish Bahety, ProfitMart Securities and Nirav R Karkera, Fisdom
x.com/i/broadcasts/1RKjpzNmB…
2
1,455