
Apr 8
Creating well-formatted, publication-ready tables in R is easy with the right packages. Whether you need simple summaries, detailed regression outputs, or interactive tables, these packages can help you present your data professionally and clearly.
✔️ gt: Ideal for creating beautiful summary tables with a range of formatting options. It allows you to add captions, footnotes, and custom styles effortlessly.
✔️ gtsummary: Great for descriptive statistics and regression results. With functions like tbl_summary() and tbl_regression(), it simplifies reporting with clear and organized tables.
✔️ stargazer: Perfect for exporting summary and regression tables to LaTeX, HTML, or plain text with minimal code. Highly useful for academic papers and presentations.
✔️ kableExtra: Enhances knitr::kable() tables with custom styling, footnotes, and cell highlighting, making it a powerful tool for creating attractive tables in R Markdown.
✔️ flextable: Best for Word and PowerPoint outputs, allowing you to style tables with themes, colors, and borders directly in R.
✔️ reactable: Useful for creating interactive and sortable tables for Shiny apps or HTML reports. Offers a range of customization options for a dynamic user experience.
Choosing the right package depends on your reporting needs and the output format you prefer. Each package has strengths, whether it’s creating static tables for PDFs or interactive ones for web-based reports.
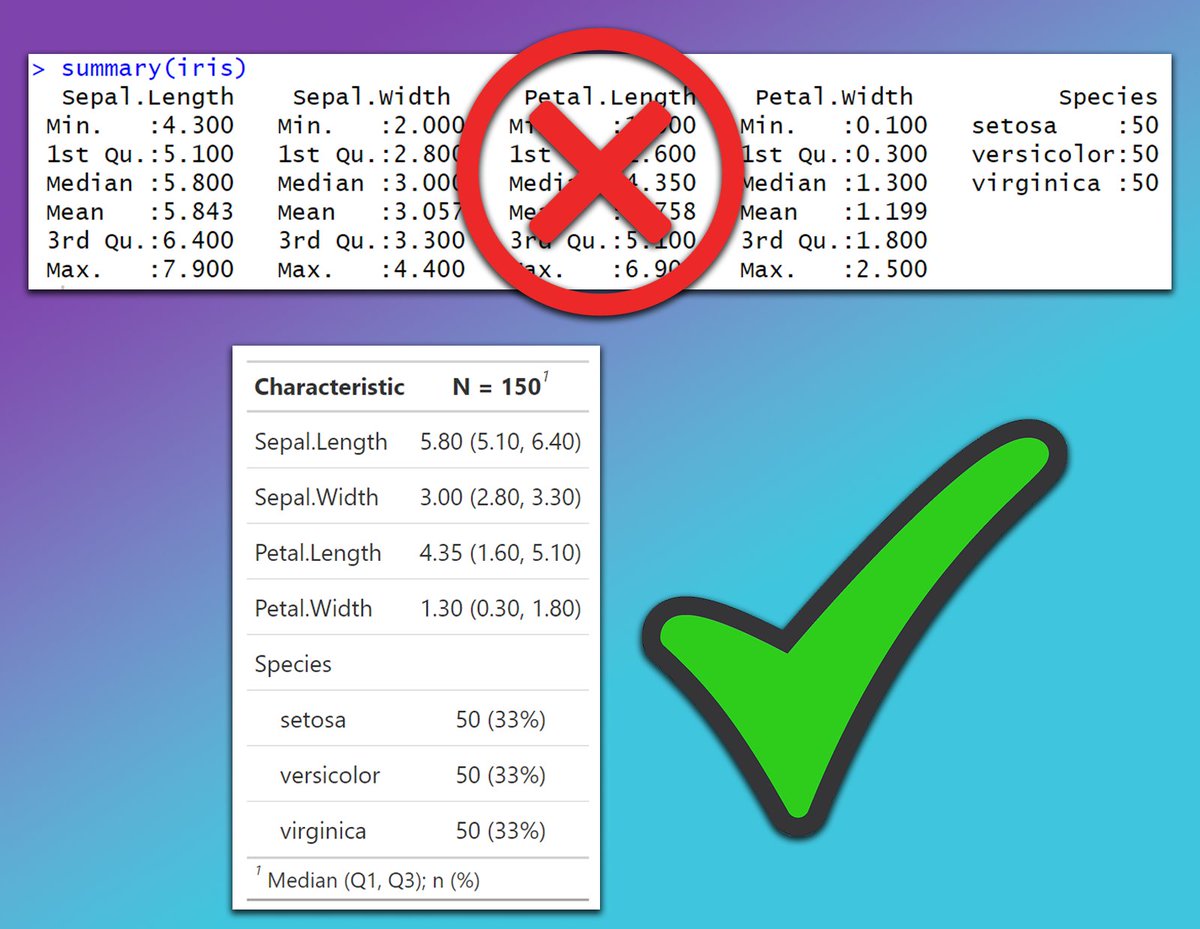
The image below compares the default output of the summary() function in R with a table generated using the gtsummary package. The summary() function produces basic and cluttered outputs that can be hard to interpret in reports or presentations. In contrast, the gtsummary package creates clean, well-organized, and publication-ready tables with descriptive statistics, making it easier to understand and present data effectively.
Want to learn more about creating beautiful tables and reports in R? Subscribe to my email newsletter! Check out this link for more details: statisticsglobe.com/newslett…
#RStats #database #Data #statisticians

1
14
70
2,885

Mar 28
الخطوة 6: الـ Meta-analysis
دلوقتي R ادالك جدول فيه ال Heterogenity و الموديل المقترح لكل Outcome سواء Random او Fixed. في اغلب الاحيان بتكون اقتراحات مظبوطة ولكن دايمًا راجع وراه.
انت كدا جاهز تعمل الـ Analysis. استخدم الـ Prompt ده 👇
My data is loaded and I have confirmed the model for each outcome.
Now run the full meta-analysis and produce forest plots.
STEP 1 - Run meta-analysis per outcome
For each outcome in my dataset:
- Use the {meta} package
- Apply the model I confirmed (fixed or random) per outcome
- Calculate:
· Pooled effect size with 95% CI
· p-value for the overall effect
· I², Cochran's Q, p-heterogeneity
- Store each outcome's result as a separate object (e.g., ma_outcome1, ma_outcome2)
STEP 2 - Summary results table
Create a clean dataframe combining all outcomes with these columns:
Outcome | Model Used | Pooled ES | 95% CI | p-value | I² | Heterogeneity interpretation
Print it using flextable() so it's publication-ready
STEP 3 - Confirm before moving on
After running everything, print a checklist:
✅ Outcomes analyzed: [list them]
✅ Forest plots exported: [list filenames]
❓ Ready for publication bias and sensitivity analysis? (yes/no)
Do not run publication bias or sensitivity analysis yet.
1
1
209
Mar 28
الخطوة 4: دلوقتي ال AI ادالك فايل الاكسيل جاهز بعد المراجعة، دايمًا محتاج تراجع ورا الـ AI وتتأكد ان الداتا سليمة ومطابقة للفايل الاساسي بتاعك.
الخطوة 5: هتحتاج تنزل ال Packages اللي هتستخدمها في الاناليسيس، استخدم الـ Prompt ده 👇
Write clean, well-commented R code that installs and loads all packages required for a complete meta-analysis workflow in R. The code should cover:
- Core meta-analysis: {meta}, {metafor}, {dmetar} (note: dmetar installs from GitHub via remotes)
- Network meta-analysis: {netmeta}
- Reading Excel files: {readxl}
- Data wrangling: {dplyr}, {tidyr}
- Plot production: {ggplot2}, {gridExtra}
- Manuscript output: {officer}, {flextable}
Requirements:
- Use if (!require()) pattern so packages only install if not already installed
- Load all packages with library() after installation
- Add a brief inline comment next to each package explaining what it's used for
- Group packages by purpose with a section header comment
- At the end, print a confirmation message: "All packages loaded successfully"
1
1
261
24 Oct 2025
Creating well-formatted, publication-ready tables in R is easy with the right packages. Whether you need simple summaries, detailed regression outputs, or interactive tables, these packages can help you present your data professionally and clearly.
✔️ gt: Ideal for creating beautiful summary tables with a range of formatting options. It allows you to add captions, footnotes, and custom styles effortlessly.
✔️ gtsummary: Great for descriptive statistics and regression results. With functions like tbl_summary() and tbl_regression(), it simplifies reporting with clear and organized tables.
✔️ stargazer: Perfect for exporting summary and regression tables to LaTeX, HTML, or plain text with minimal code. Highly useful for academic papers and presentations.
✔️ kableExtra: Enhances knitr::kable() tables with custom styling, footnotes, and cell highlighting, making it a powerful tool for creating attractive tables in R Markdown.
✔️ flextable: Best for Word and PowerPoint outputs, allowing you to style tables with themes, colors, and borders directly in R.
✔️ reactable: Useful for creating interactive and sortable tables for Shiny apps or HTML reports. Offers a range of customization options for a dynamic user experience.
Choosing the right package depends on your reporting needs and the output format you prefer. Each package has strengths, whether it’s creating static tables for PDFs or interactive ones for web-based reports.
The image below compares the default output of the summary() function in R with a table generated using the gtsummary package. The summary() function produces basic and cluttered outputs that can be hard to interpret in reports or presentations. In contrast, the gtsummary package creates clean, well-organized, and publication-ready tables with descriptive statistics, making it easier to understand and present data effectively.
Want to learn more about creating beautiful tables and reports in R? Subscribe to my email newsletter!
Check out this link for more details: eepurl.com/gH6myT
#DataScientist #Data #Python #datastructure #RStats

2
14
103
5,895

25 Aug 2025
🧩 [R TIP] – Una de las grandes ventajas de los ecosistemas de paquetes en R es que te permiten interactuar con otros softwares sin salir de tu plataforma favorita (RStudio, Positron, VSCode, etc.) y, así, favorecer a un mejor flujo de trabajo, con menos errores manuales y más reproducibilidad.
📖 El paquete {officeverse} es un claro ejemplo de esto.
La suite officeverse (officer, officedown, flextable, rvg, mschart) te permite producir entregables de Microsoft Office desde R de forma reproducible, consistente y automatizable. Ideal para reportes corporativos, entregables y presentaciones ejecutivas que deben respetar plantillas.
Qué aporta cada paquete:
•officer — Generá y editá documentos .docx y .pptx: control fino de slides, textos, imágenes y tablas (perfecto para outputs basados en tablas y gráficos).
•officedown — Integrá lo mejor de R Markdown con officer: secciones, campos y gráficos vectoriales editables en Word/PPT, ideal cuando necesitás mucho texto formato avanzado.
•flextable — Tablas profesionales y formateadas para Word, PPT, HTML o PDF; excelente para reportes que requieren presentaciones de tablas impecables.
•rvg — Exportá ggplots como gráficos vectoriales editables dentro de PowerPoint/Excel (retocables después en Office, sin perder calidad).
•mschart — Creá charts nativos de MS enlazados a datos del documento; si actualizás los datos en el doc, el chart se actualiza.
Por qué usarlo:
✔️ Automatizás entregables periódicos (reportes mensuales, presentaciones ejecutivas).
✔️ Mantenés consistencia visual con plantillas corporativas.
✔️ Evitás errores manuales y ganás reproducibilidad en cada corrida.
💡 Consejo práctico: combiná flextable (tablas) rvg (gráficos vectoriales) dentro de una plantilla officer para generar PPTX/Word listos para revisión y edición final por stakeholders.
🔗 Más info: ardata-fr.github.io/officeve…
#RStats #Rtips #officeverse #Reporting #Reproducibilidad #DataScience


22
128
5,279
4 Jul 2025
Creating well-formatted, publication-ready tables in R is easy with the right packages. Whether you need simple summaries, detailed regression outputs, or interactive tables, these packages can help you present your data professionally and clearly.
✔️ gt: Ideal for creating beautiful summary tables with a range of formatting options. It allows you to add captions, footnotes, and custom styles effortlessly.
✔️ gtsummary: Great for descriptive statistics and regression results. With functions like tbl_summary() and tbl_regression(), it simplifies reporting with clear and organized tables.
✔️ stargazer: Perfect for exporting summary and regression tables to LaTeX, HTML, or plain text with minimal code. Highly useful for academic papers and presentations.
✔️ kableExtra: Enhances knitr::kable() tables with custom styling, footnotes, and cell highlighting, making it a powerful tool for creating attractive tables in R Markdown.
✔️ flextable: Best for Word and PowerPoint outputs, allowing you to style tables with themes, colors, and borders directly in R.
✔️ reactable: Useful for creating interactive and sortable tables for Shiny apps or HTML reports. Offers a range of customization options for a dynamic user experience.
Choosing the right package depends on your reporting needs and the output format you prefer. Each package has strengths, whether it’s creating static tables for PDFs or interactive ones for web-based reports.
The image below compares the default output of the summary() function in R with a table generated using the gtsummary package. The summary() function produces basic and cluttered outputs that can be hard to interpret in reports or presentations. In contrast, the gtsummary package creates clean, well-organized, and publication-ready tables with descriptive statistics, making it easier to understand and present data effectively.
Want to learn more about creating beautiful tables and reports in R? Subscribe to my email newsletter!
Click this link for detailed information: eepurl.com/gH6myT
#Rpackage #RStats #programmer #rstudioglobal #datastructure #Python

12
84
4,129

9 Jun 2025
🔢 ¿Te peleas con las tablas de frecuencia en R?
Hay vida más allá de table() y group_by() summarise(). 😉
📦 La función tabyl() del paquete janitor crea tablas de frecuencia limpias, legibles y listas para presentar. Se integra genial con flextable(), kable() y tidyverse.👇🧵
3
70
345
13,377

17 Apr 2025
From the just concluded #OnitshaInnovationTechQuest 2025, meet the 2 prize winners.
~Flextable
~Queek


4
6
402
6 Apr 2025
Meet the laptop winners.
"Queek" and "Flextable" are the laptop winners for the #OnitshaInnovationTechQuest 2025
Thank you to our sponsor @FunZ_NG for this consolation prize.
Thank you to our supporters
#OnitshaBusinessHangout


10
14
422

5 Apr 2025
Meet our Finalists!😍😍
Thread...
1. Chidera Nwanyemike.
Co-founder & CEO, Flextable.
Flextable is a marketplace that connect remote workers, creators, individuals & businesses to spaces for work, events, meetings & productions making it easy for people to find, book spaces.

1
11
23
1,520

27 Mar 2025
Birşeyi dinamik yapmaya çalışmak angarya geliyorsa biyerlerde hata yapıyorsunuzdur. Çözüm öneriniz oldukça kullanışsız mesela. Excel çıktısının amacını anlamadım ama r için finalfit paketini kullanıp çıktılarınızı flextable ile word e alabilirsiniz.
1
1
268
12 Mar 2025
Creating well-formatted, publication-ready tables in R is easy with the right packages. Whether you need simple summaries, detailed regression outputs, or interactive tables, these packages can help you present your data professionally and clearly.
✔️ gt: Ideal for creating beautiful summary tables with a range of formatting options. It allows you to add captions, footnotes, and custom styles effortlessly.
✔️ gtsummary: Great for descriptive statistics and regression results. With functions like tbl_summary() and tbl_regression(), it simplifies reporting with clear and organized tables.
✔️ stargazer: Perfect for exporting summary and regression tables to LaTeX, HTML, or plain text with minimal code. Highly useful for academic papers and presentations.
✔️ kableExtra: Enhances knitr::kable() tables with custom styling, footnotes, and cell highlighting, making it a powerful tool for creating attractive tables in R Markdown.
✔️ flextable: Best for Word and PowerPoint outputs, allowing you to style tables with themes, colors, and borders directly in R.
✔️ reactable: Useful for creating interactive and sortable tables for Shiny apps or HTML reports. Offers a range of customization options for a dynamic user experience.
Choosing the right package depends on your reporting needs and the output format you prefer. Each package has strengths, whether it’s creating static tables for PDFs or interactive ones for web-based reports.
The image below compares the default output of the summary() function in R with a table generated using the gtsummary package. The summary() function produces basic and cluttered outputs that can be hard to interpret in reports or presentations. In contrast, the gtsummary package creates clean, well-organized, and publication-ready tables with descriptive statistics, making it easier to understand and present data effectively.
Want to learn more about creating beautiful tables and reports in R? Subscribe to my email newsletter! More info: eepurl.com/gH6myT
#Python #Rpackage #DataScience #DataAnalytics #pythonprogramming #RStats #Data
17
88
5,343

1 Mar 2025
People need Spaces.
If you’ve ever helped someone find a space, you should’ve gotten paid for it. Now you can—list spaces on Flextable and earn 2% on every booking.
Get Started: flextable.co/affiliate
1
67
25 Feb 2025
Why let your space sit empty when it can be booked?
Your space could host the next big idea, the next unforgettable memory, or the next great gathering. Someone, somewhere, is looking for it; list it on Flextable and make it happen.
Get Started: flextable.co/listing
1
42
31 Jan 2025
Earn Effortlessly. When you Rent Out Your Space on Flextable.
You can List your space as a: Photoshoot Location, Cowork space, Event Venues, Restaurants, Studio, Warehouses
Send us a Message: flextable.co/listandearn

1
5
83

7 Dec 2024
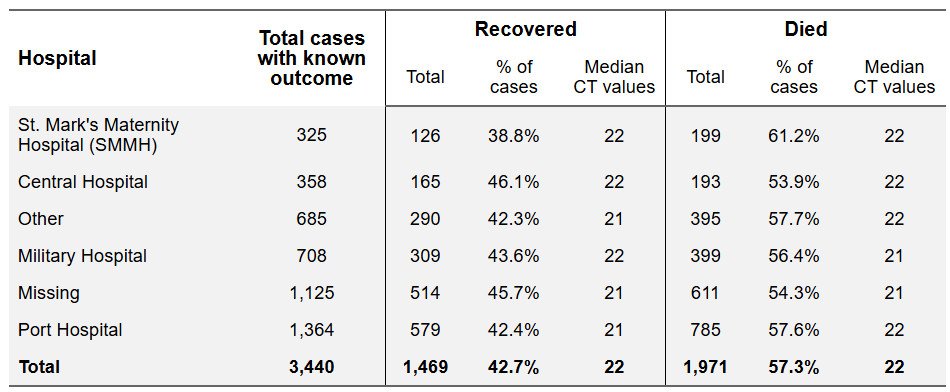
Our personal favourite flextable feature: colour-coding cells to highlight content.
🔴 Values too high?
🟢 Numbers on target?
Ideal for sitreps to quickly draw eyes to key stats!
1
1
5
311
7 Dec 2024
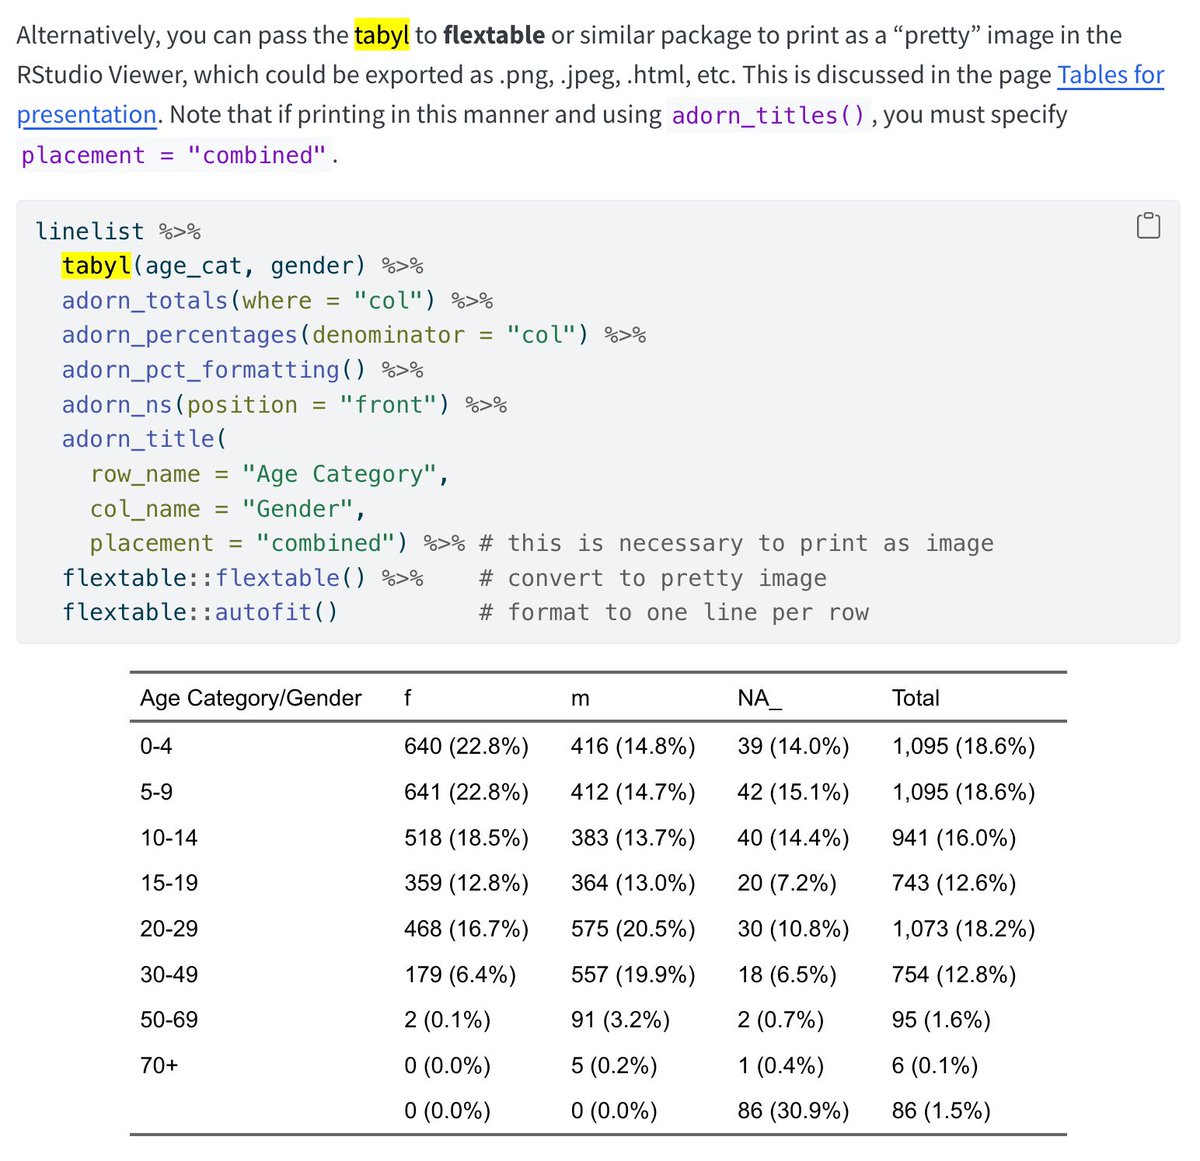
Publication-ready tables! How cool is it to run code and instantly generate a fully formatted table! With flextable, you can:
🖍️ Style fonts
🔗 Merge cells
📑 Add layered headings
📐 Adjust dimensions
Learn more in the EpiRHandbook: epirhandbook.com/en/new_page…...
#rstats #epi
2
9
16
1,210
5 Dec 2024
We pitched Flextable at 3MTT Delta TechForGood Hackathon Cohort 2 & took 2nd place! But the real win? The love & support from creatives & tech enthusiasts! Check us out! flextable.co #TechForGood #coworking


4
120
25 Nov 2024
🔥 EXTRA: También puedes generar documentos de Word en Shiny con Officer, Flextable y Shinyglide. buff.ly/4fyAson Y exportar gráficos editables de ggplot a PowerPoint con Officer y Purrr. buff.ly/40SaAz4
💡Officer buff.ly/2LjnkZk
#PowerPoint #Word
2
7
1,029
