

Jun 17
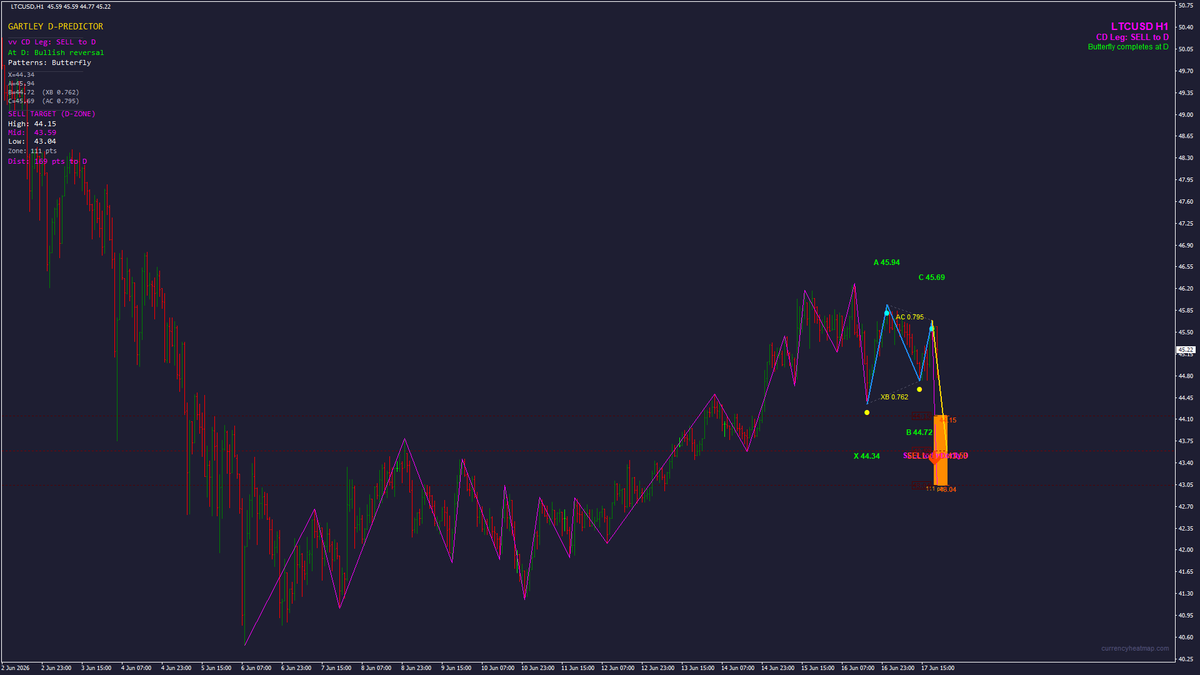
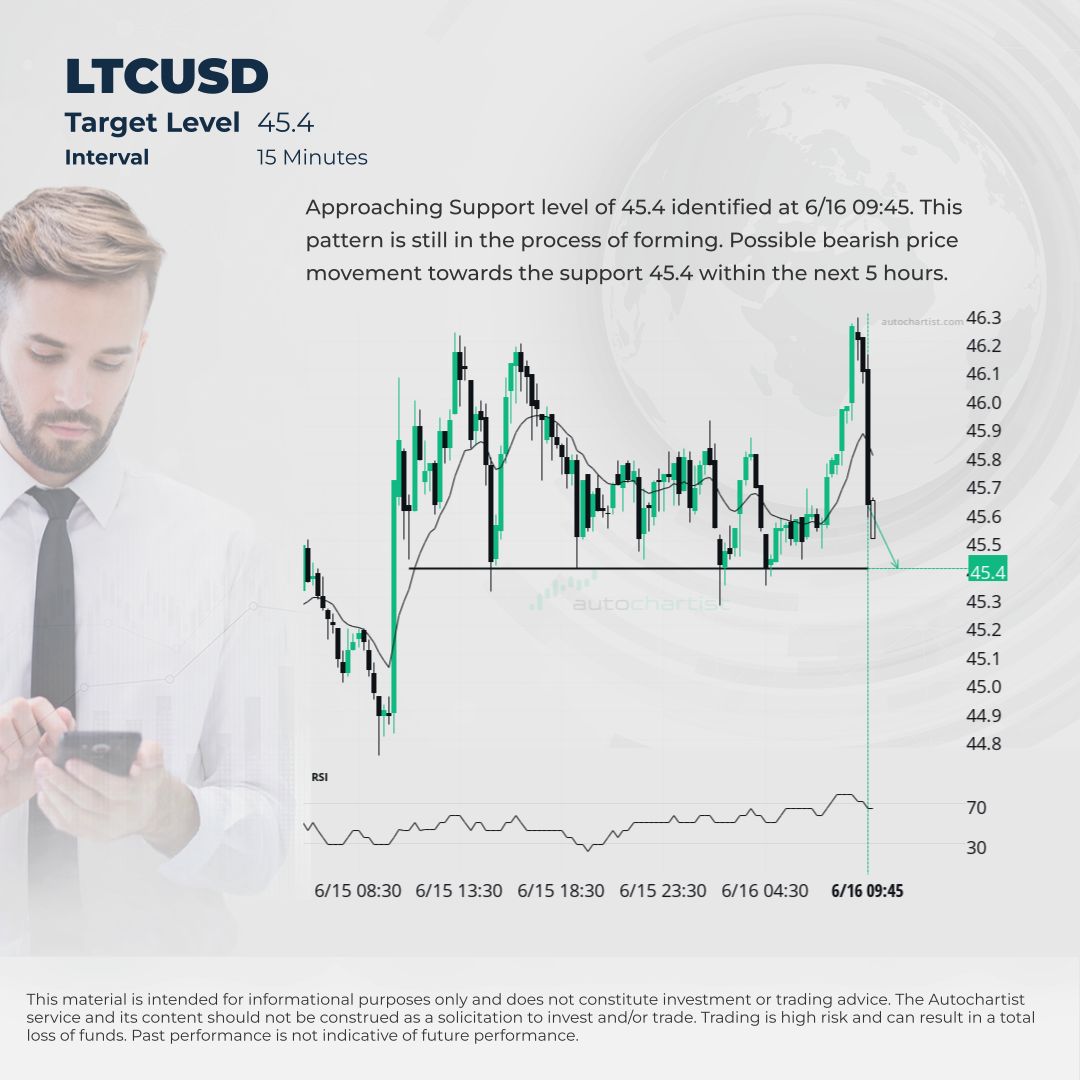
LTCUSD is approaching a resistance level at 45.4.
Tell me more : bit.ly/3uGwQ0V
#vantageplus #technicalanalysis #tradingmarkets #LTCUSD
5

Jun 16
1
523

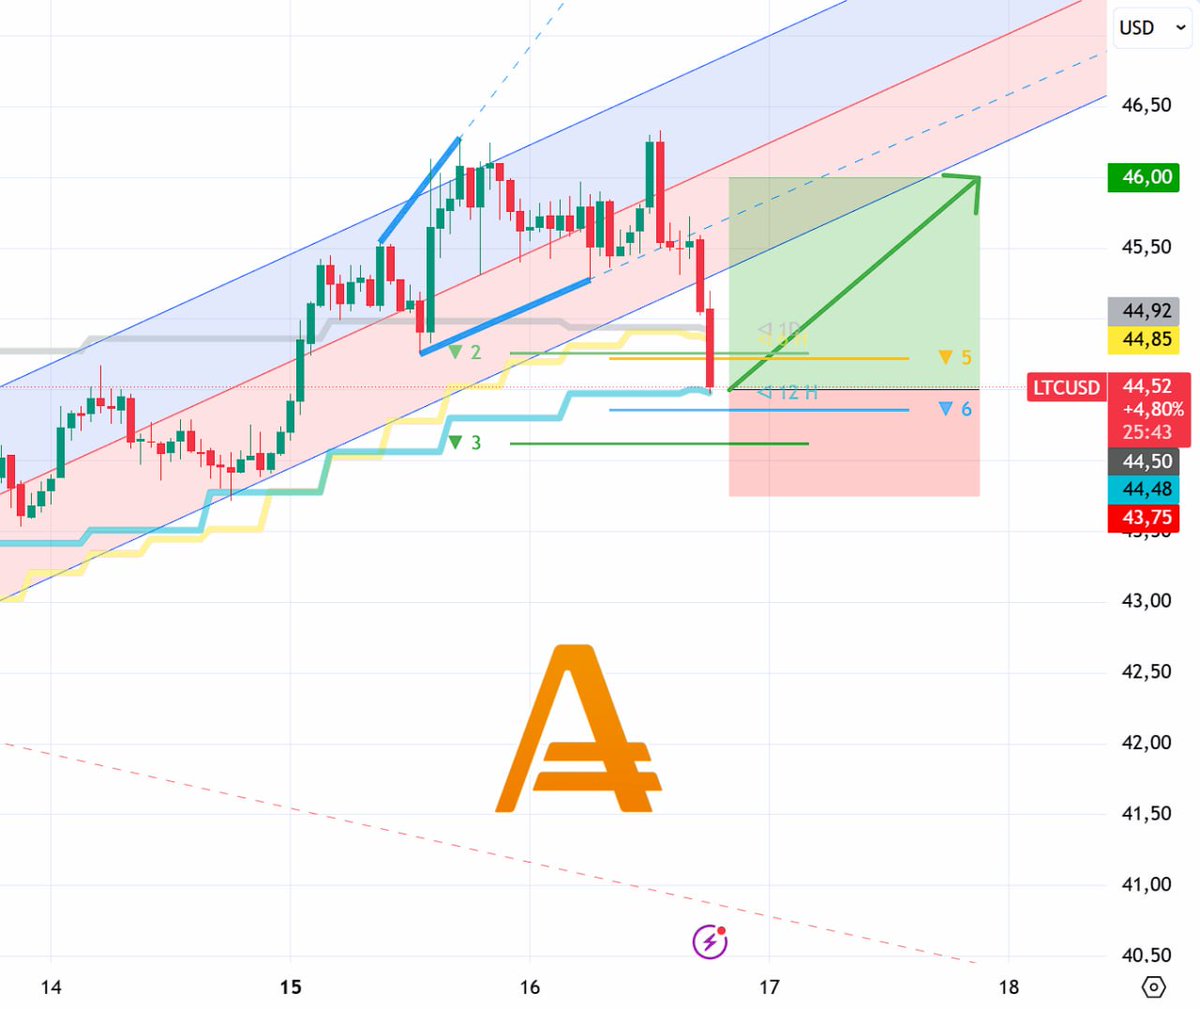
Jun 16
#ltcusd
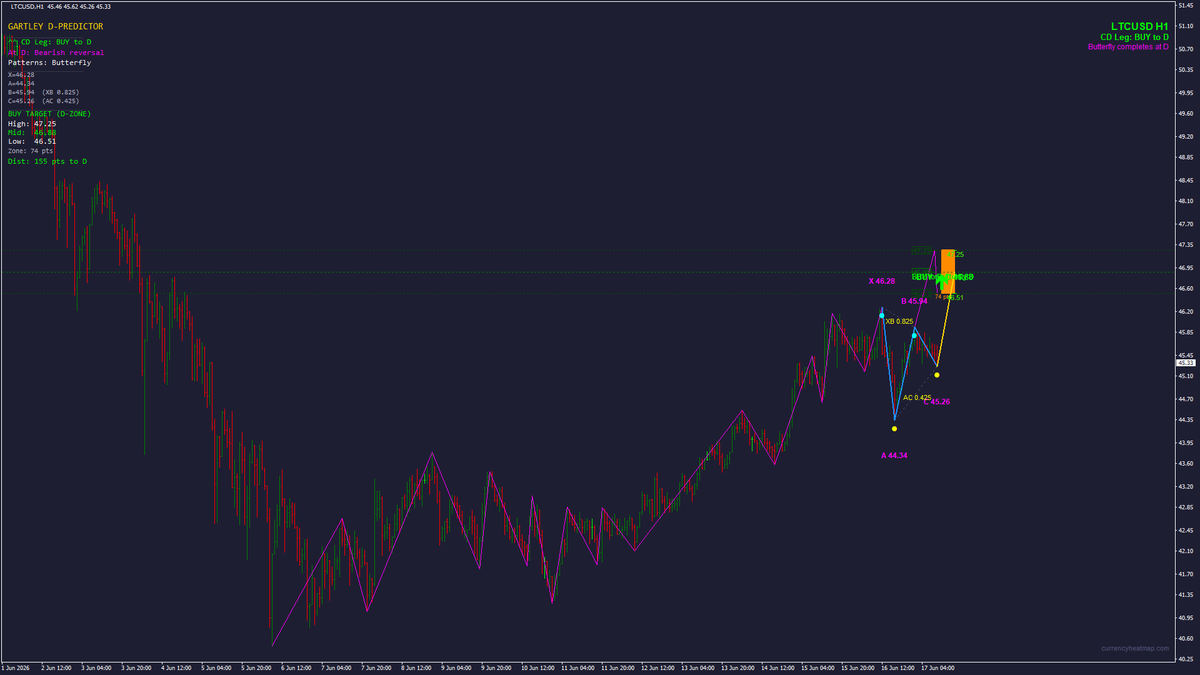
LTC/USD H1 Buy 44.50
SL 43.75
TP 46.00
✅ Daftar Akun - amrkts.club/amarkets-website…
15


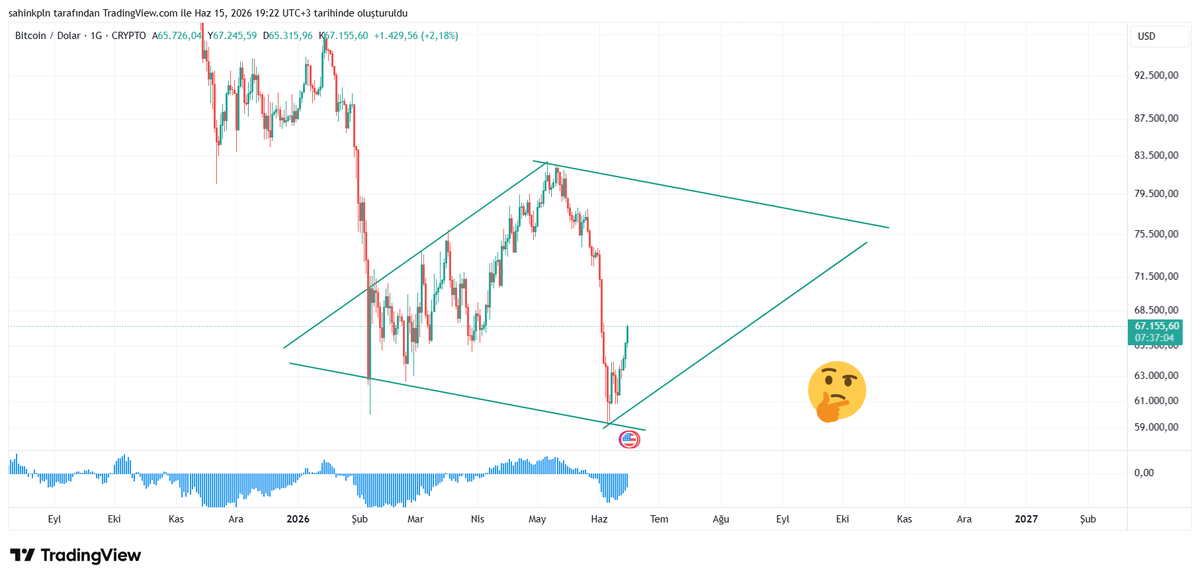
Jun 15
#BTCUSD
#ETHUSD
#FET #RENDER #ARKM #PEPE #WOJAK #POPCAT #APU #PENDLE #FTM #AVAXUSD #DOGEUSD #SHIBUSD #XRPUSD #CHZUSD #EOSUSD #HBARUSD #LTCUSD #LTOUSD #TKOUSD #POPCATUSD
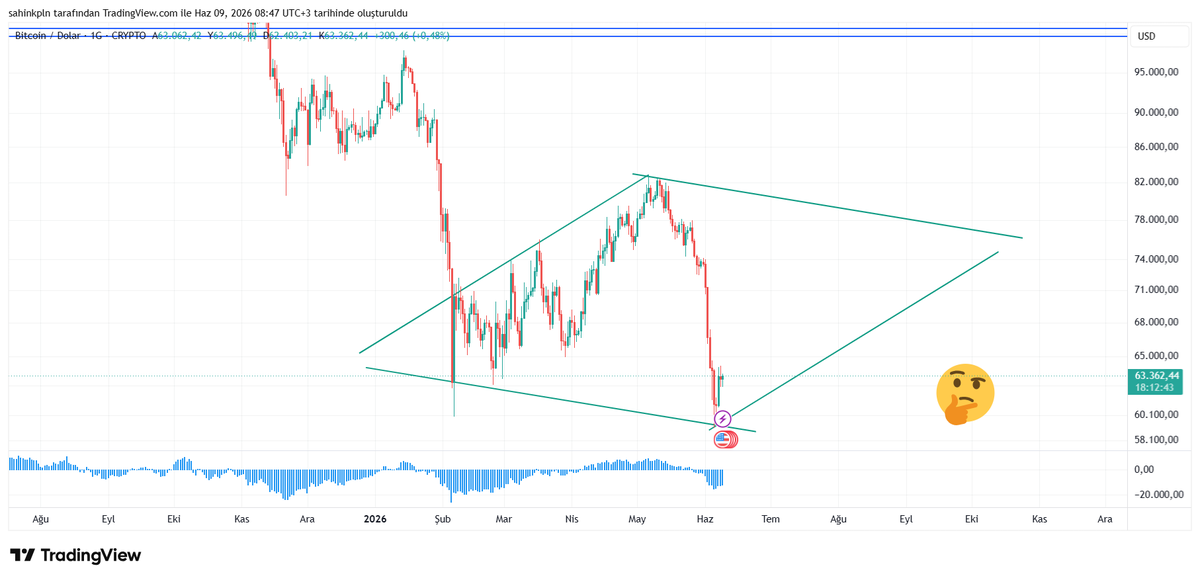
Jun 9

#BTCUSD
#ETHUSD #FET #RENDER #ARKM #PEPE #WOJAK #POPCAT #APU #PENDLE #FTM #AVAXUSD #DOGEUSD #SHIBUSD #XRPUSD #CHZUSD #EOSUSD #HBARUSD #LTCUSD #LTOUSD #TKOUSD #POPCATUSD
150

Jun 14
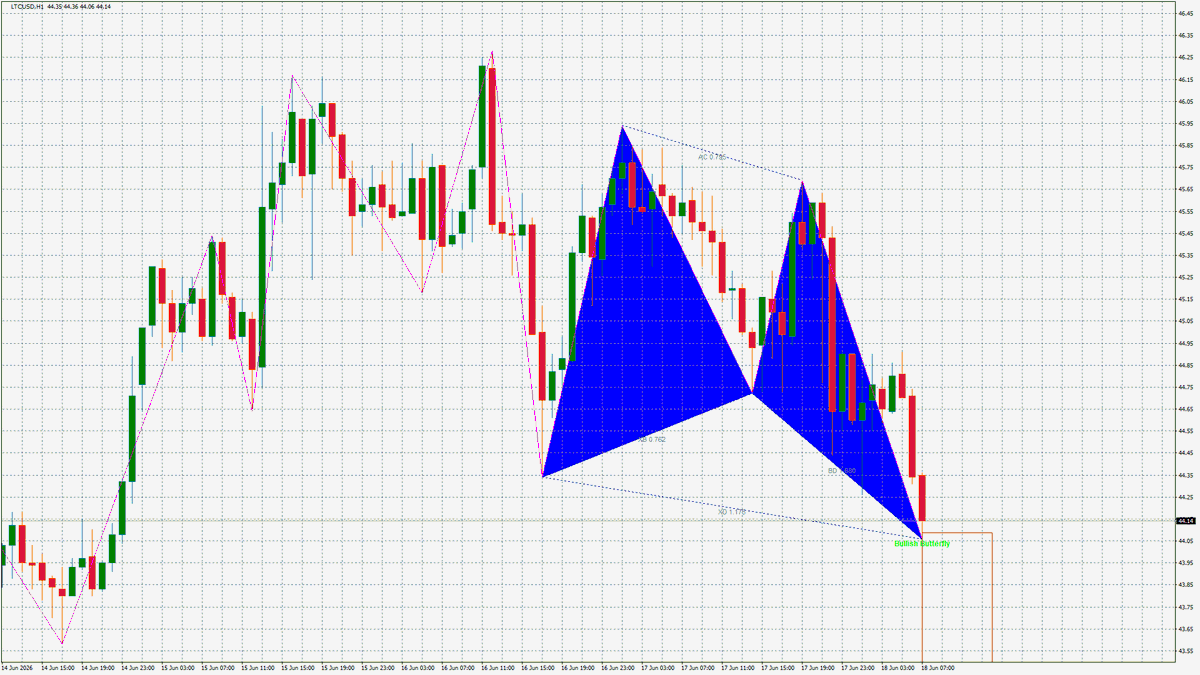
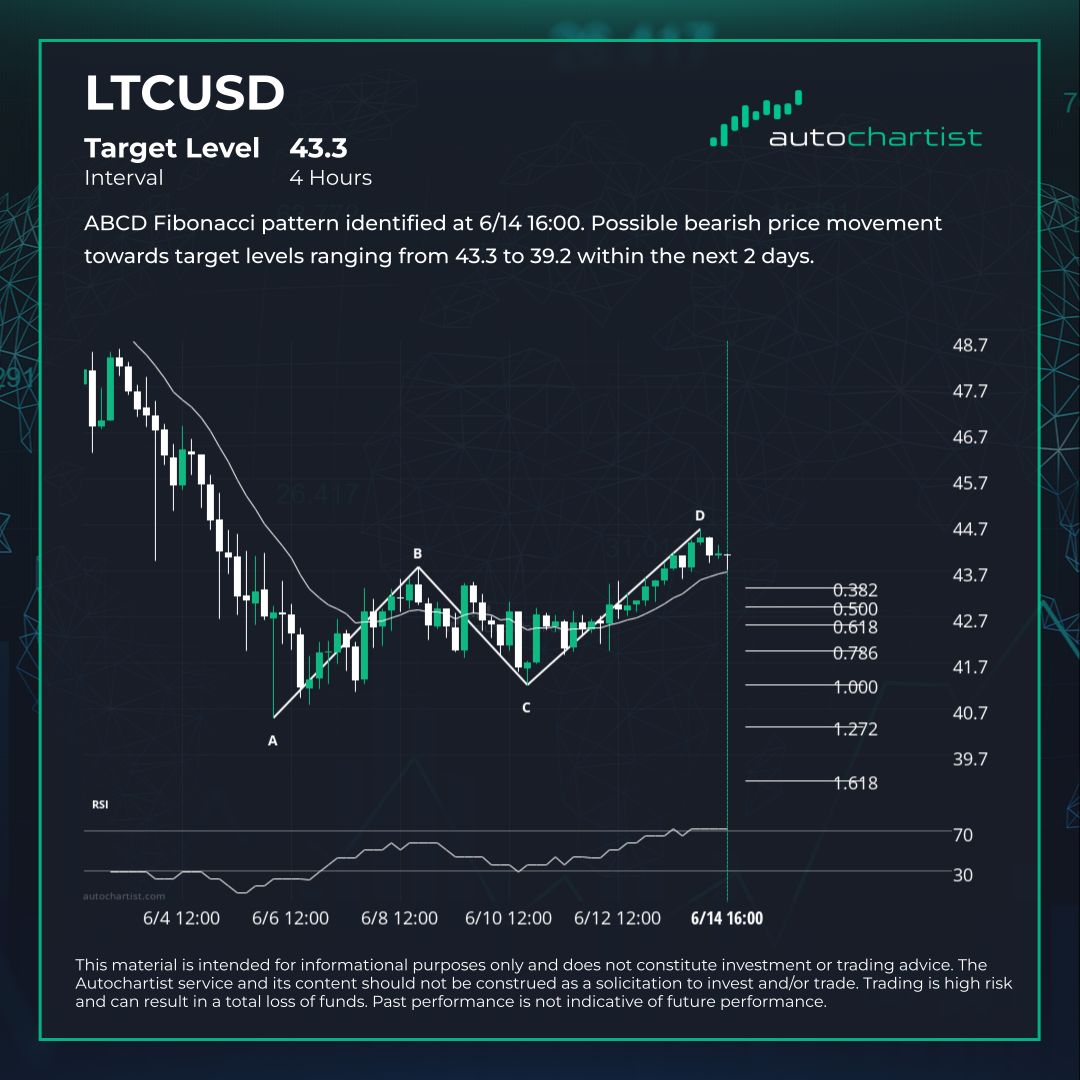
ABCD Fibonacci pattern identified at 6/14 16:00. Possible bearish price movement towards target levels ranging from 43.3 to 39.2 within the next 2 days.
#Autochartist #LTCUSD
63


Jun 13
the charts, not only ltcusd but ltceth ltcbtc and ltcothers
to be fair i think it‘ll be there before eoy 2028
humbly, i think we see $1080 around May/June 2027
1
21

Jun 13
LTC/SILVER was the biggest indicator that we were going to get a brutal 6 - 12 months after october 11th.
I remember frequently charting it live since since last november (till this february).
The retracement and consolidating projection was clear on this pairing, while LTCUSD looked very strong and LTCBTC just looked like a perpetual bleed. Although I was always hoping for a fakeout, the indication was quite clear.
Anyone who fades this pairing doesn't know what they're missing.
1
3
89

Jun 13
It’s very similar to LTCUSD. It’s going to reverse all the way back up over the coming months.

5
145


Macro Observatory Weekly Wrap
The Friday close has delivered a classic, late-cycle structural layout. The mainstream financial columns will look at the green finish on the S&P 500 and the industrial Dow and declare that market stability has been successfully restored. But our telemetry allows us to look behind the scenes at the true balance of forces.
The raw data indicates that the capital extraction we tracked mid-week has shifted gears into a temporary, late-session defensive huddle.
The US Dollar magnet ($DXY) surrendered its near-term daily momentum to close out in a Double Red contraction (🔴|🔴|🟢). However, this did not spark a genuine system-wide risk expansion. Instead, capital trickled back into the primary blue-chip indices to paint a superficial layer of Friday green, while the core global liquidity conduits remained severely constrained.
$US30 (⚪|🟢|🟢). The industrial fuselage closed the week inside an active medium- and long-term expansion phase, acting as the primary anchor for legacy capital.
$SPX500 (🟢|⚪|🟢). The broad-market engine bounced off its short-term daily lines to print an active daily green block, though the weekly backstop remains entirely frozen at Neutral (⚪).
$TLT (🔴|🟢|🟢). Sovereign debt duration was mildly drawn down to Daily Red into the close, signaling that capital was mechanically extracted from paper safety to fund the Friday equity cosmetics.
$LTCUSD (⚪|⚪|🔴). The terminal crypto black hole flatlined into the weekend, logging a neutral stance on the daily and weekly horizons while the long-term monthly horizon remains heavily suppressed.
$AUDUSD (🟢|🟢|🔴). The global growth proxy staged a sharp short-to-medium-term reversal into a Double Green expansion, reacting immediately to the near-term softening of the spot dollar.
The Friday close matrix provides a clean, structural verification of our core playbook thesis, highlighting the limits of the market's current unanchored stance:
The Limit of the equity squeeze: [Fully Conforming]. We predicted that any near-term stock bounce would remain entirely hollow and structurally capped. The Friday numbers show exactly that: while the $SPX500 managed a daily green lift, the tech cockpit ($NASDAQ ⚪|🟢|🟢) remained entirely flatlined at a Daily Neutral. The growth engine is unable to re-ignite an active short-term expansion phase.
The persistent currency chokehold: [Fully Verified]. Despite the nominal spot dollar index slipping into a near-term contraction, the underlying international liquidity channels did not expand. The core safe-haven corridors - most notably $USDCHF (🟢|🟢|🟢) and $USDCAD (🟢|🟢|🟢) finished the week locked in flawless, multi-duration Triple Green supernovas. The global dollar crunch is structurally unyielding.
The exhausted digital frontier: [Fully Conforming]. The crypto periphery remains locked out of the defensive equity flows. Even with a softer Friday dollar, the structural risk proxy $ETHBTC (🔴|🔴|🔴) closed the weekly cycle buried inside a terminal Triple Red Black Hole.
Aggregate Sector States
US Equity Indices (The split fuselage): The data matrix shows a deeply fragmented equity architecture. The $US30 and $SPX500 are leaning on short-to-medium-term green cushions, but the $NASDAQ is stalling out at Neutral and small caps ($RTY 🔴 Daily) remain stuck in a Daily contraction. The core fuselage is out of sync.
Sovereign Credit and FX (The systemic anchor): The fixed-income and currency grids are flashing severe structural tightness. While safe-haven debt duration ($TLT) took a minor tactical daily hit, the multi-duration supernovas in Swiss Franc and Canadian Dollar corridors prove that institutions are maintaining a defensive cash posture over the weekend.
Hard Assets (The battered tangibles): The physical asset complex closed the week under heavy pressure. Global energy remains thoroughly depressed, with $NATGASUSD (🔴|🔴|🔴) locked in a triple red freeze and $UKOILUSD (🔴|🔴|⚪) pinned in contraction. Precious monetary safety also finished in a near-term draw down, with $GOLDUSD (🔴|🟢|🔴) and $XAGUSD (🔴|🟢|🟢) both logging active daily red contractions.
No real, systemic liquidity returned to the risk complex to close out the week. The automated execution blocks simply managed a minor, weekend-hedging counter-rotation. They pulled capital out of sovereign bonds, raided the precious metals trenches, and completely starved the digital frontier - leaving $ETHBTC deeply frozen in a terminal Triple Red black hole, just to preserve a superficial cushion across legacy equities.
The fact that the tech cockpit couldn't even print a daily green block while core international funding channels like $USDCAD and $USDCHF finished the week in absolute Triple Green supernovas tells us everything we need to know. The global liquidity vacuum is not receding; it is consolidating. The unanchored equity hover is flying on depleted reserves, the macro ceilings are clamping down, and the structural plumbing is locked tight heading into the next weekly cycle open.
1
2
98