
recent recovery Which level are you watching today? #Crypto #TechnicalAnalysis


7️⃣ 𝗧𝗲𝗰𝗵𝗻𝗶𝗰𝗮𝗹 𝗔𝗻𝗮𝗹𝘆𝘀𝗶𝘀 & 𝗦𝘁𝗿𝗮𝘁𝗲𝗴𝗶𝗲𝘀 📊
✔️ Price Action 📉📈
✔️ Support & Resistance 🏗
✔️ Candlestick Patterns 🕯
✔️ Moving Averages 📊
Backtest before applying! 🔥
#TechnicalAnalysis #TradingStrategies
1
2

The process is what you control, and consistency in the process is what ultimately shapes the outcome.
#cryptomarketcap
#Crypto #Bitcoin #ETH #Altcoins #CryptoTrading #CryptoTrader #TechnicalAnalysis #PriceAction #RiskManagement #MarketStructure #TradingMindset
May 29

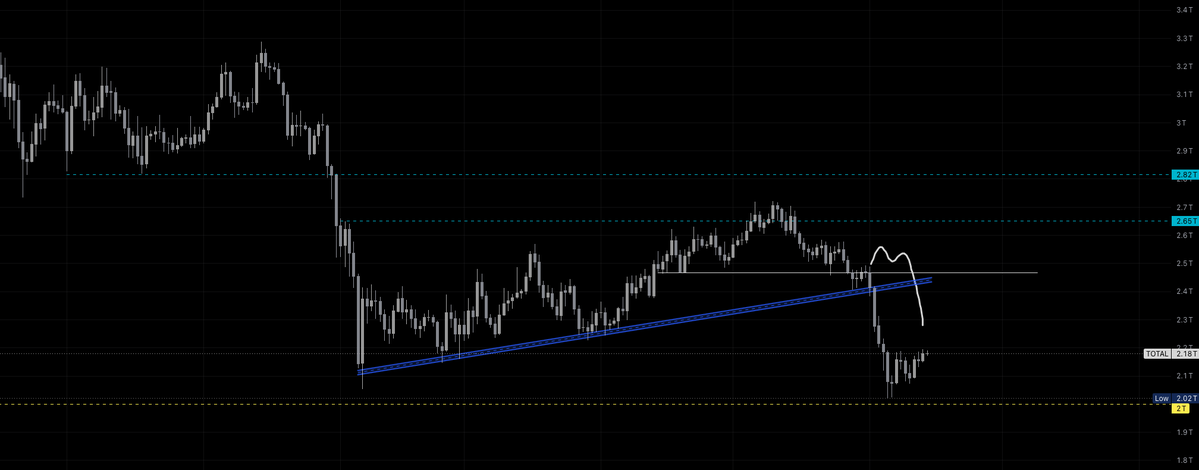
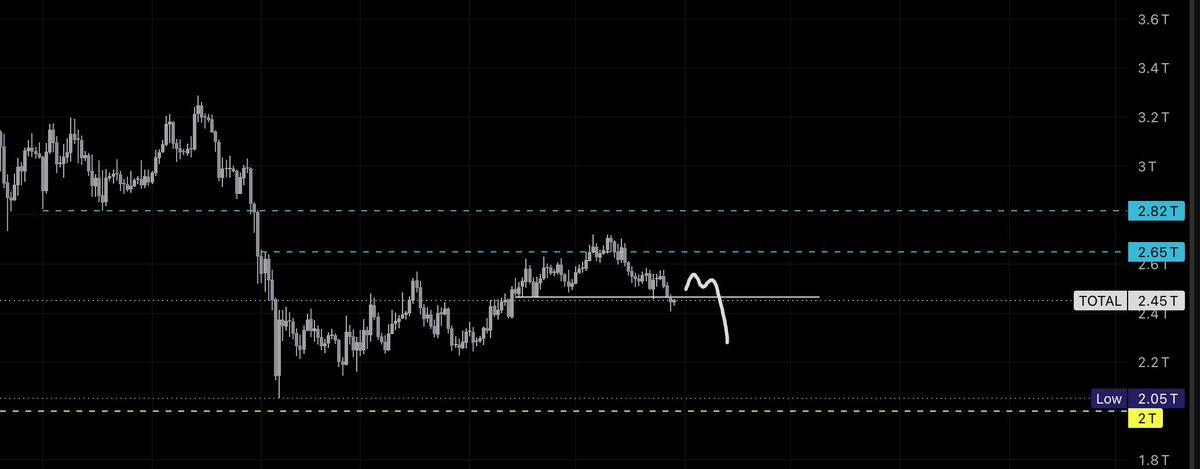
Crypto market cap - if break below $2.45T could send the market toward $2.05T, while reclaiming $2.65T would strengthen the bullish case and open the path to $2.82T.
#Crypto #Bitcoin #Ethereum #Altcoins #TechnicalAnalysis #CryptoTrading #MarketCorrection
16

#EURUSD 4H
Fiyat kritik destek bölgesinden güçlü tepki aldı ve kısa vadeli yapıda yukarı yönlü dönüş sinyalleri oluşmaya başladı.
🎯 Hedef bölge: 1.1730 - 1.1780
🛑 Geçersizlik: 1.1520 altı
Dolar tarafında yeni bir güçlenme hikayesi gelmediği sürece alıcıların kontrolü ele geçirme ihtimali artıyor.
Şimdi izlenecek seviye: 1.1570 üzerindeki kalıcılık.
#Forex #Trading #EURUSD #PriceAction #TechnicalAnalysis #Trader

5

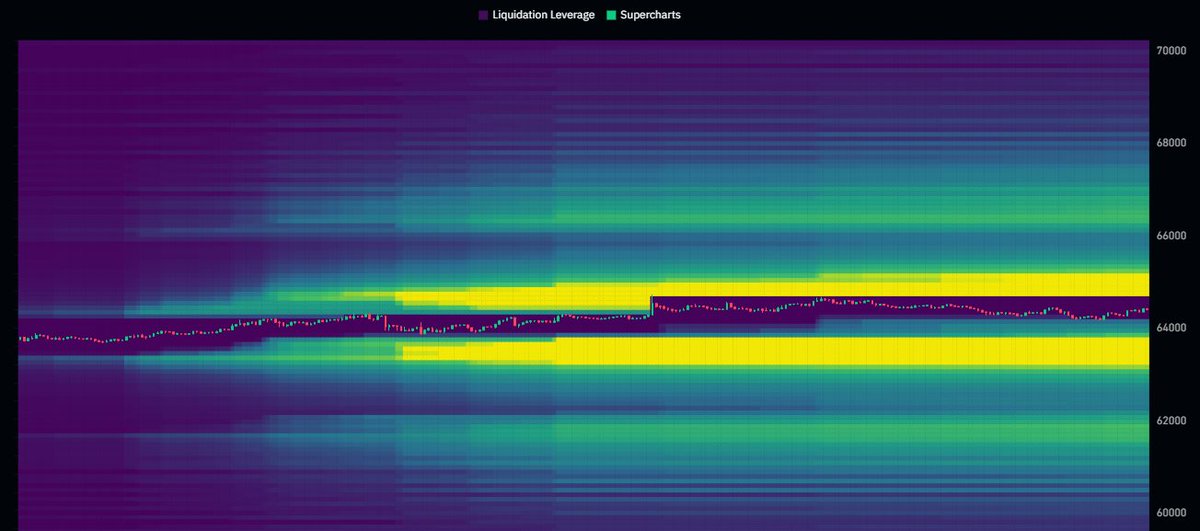
Where do you think bitcoin:native is headed next?
$65K or $63K?
#BTC #BTCUSDT #TechnicalAnalysis #LiquidityHeatmap
8

Master Your Mind Before the Market | Trading Psychology Masterclass (Complete Series)
#Nifty #BankNifty #Sensex #TradingPsychology #StockMarket #IndianStockMarket #OptionsTrading #PriceAction #IntradayTrading #TechnicalAnalysis #RiskManagement #MarketStructure #BongTrader
1
42

33m
#DowJones #DJIA #DowJonesIndustrialAverage #USStocks #WallStreet #StockMarket #Investing #Trading #MarketAnalysis #TechnicalAnalysis #PriceAction #BlueChips #IndustrialStocks #EquityMarket #FinancialMarkets #MarketWatch #GlobalMarkets #Investment #Trader #Investors #Bullish #Bearish #MarketTrends #EconomicOutlook #Finance #Stocks #NYSE #USMarket #LongTermInvesting #WealthBuilding

3

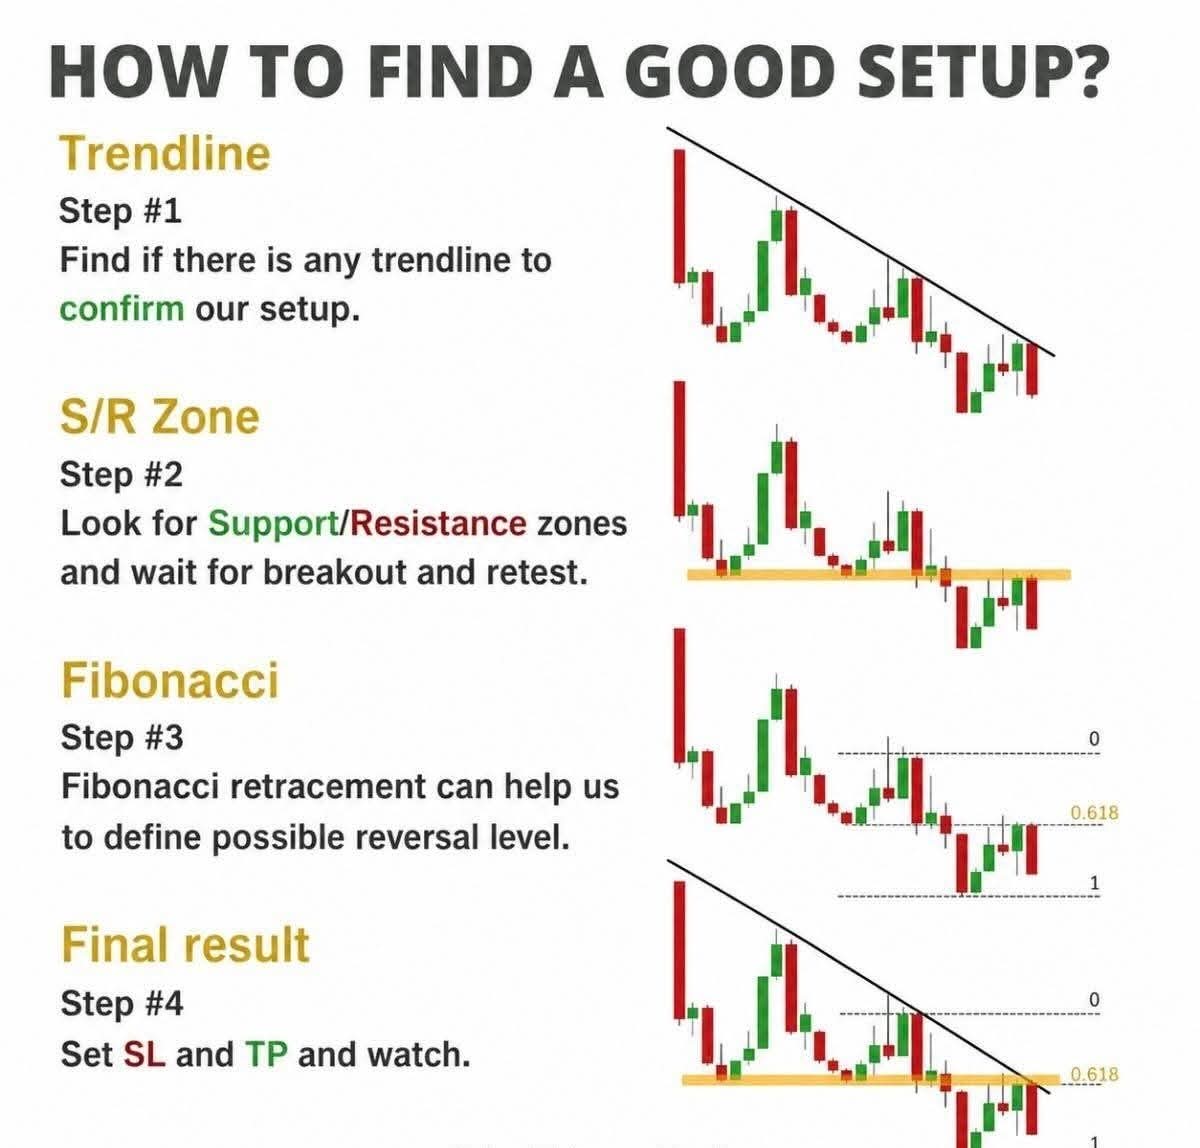
राम्रो ट्रेड सेटअप भाग्यले होइन, Confirmation ले बनाउँछ।
ट्रेन्डलाइन, सपोर्ट तथा रेसिस्टेन्स, र फिबोनाची एउटै क्षेत्रमा मिल्दा सफल ट्रेडको सम्भावना बढ्छ।
धेरै ट्रेड गर्नु भन्दा गुणस्तरीय अवसरको प्रतीक्षा गर्नु राम्रो हुन्छ।
#Trading #StockMarket #PriceAction #TechnicalAnalysis
7

#KEI Weekly Breakout & Retest! 📈
Massive consolidation breakout! 🚀
Crossed major resistance at ₹5039 🎯
Old resistance retested & held as support! 💎
Primary long-term trend is bullish 📊
#TechnicalAnalysis #PriceAction #Nifty50
Educational only, not financial advice
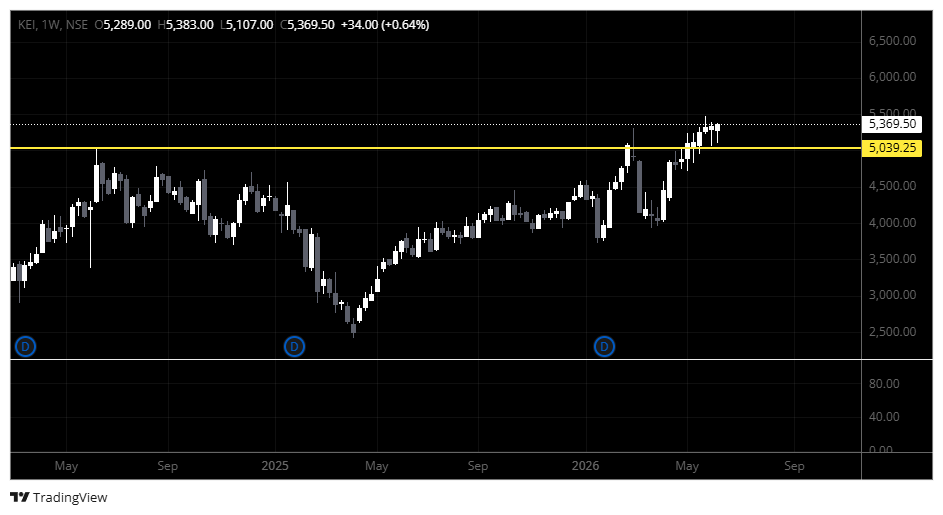
ALT KEI Industries Weekly Chart, WEEKLY BREAKOUT CHART, NIFTY50 , SUPPORT AND RESISTANCE BREAKOUT, SHAREMAKET INDIA, TRADING VIEW
21

#Investing #Investment #Bullish #Nifty #Midcap #StockMarketIndia #Investing #TechnicalAnalysis #Nifty500 #Gold #Silver #Nifty50 #Investing #Commodities #AssetAllocation #MacroEconomics
🧵 Asset Class Performance: Equities Stall, While Gold & Silver Explode into a Mega Bull Run! 🪙🚀
If you are still only tracking equity returns, you are missing out on the real kings of the last 24 months. Between June 2024 and June 2026, precious metals have completely stolen the show while domestic equities remained locked in a tight consolidation.
The multi-asset leaderboard tells a fascinating macro story: 👇
1️⃣ The New Global Performance Leaderboard
🟣 KOSPI (South Korea Equity): 🚀 197.77% (Leading global tech/hardware)
🌸 SILVER (MCX): 🥈 172.19% (Outsized gains — Commodity Super-Cycle)
🟢 KSE 100 (Pakistan): 📈 136.82%
🟢 GOLD (MCX): 🥇 109.15% (Wealth protection turning into a multi-bagger)
🟢 TAIWAN (Taiwan Tech): 💻 107.70%
🔵 NASDAQ (US Tech): 🇺🇸 52.25%
🇮🇳 Indian Equities (Nifty/Nifty 500): 📊 1% to 3% (Completely flatlined).
@DAmmannaya
@drprashantmish6
@DRCHETANLALSETA
@VijayThk
@ADX_Learner
@AmitabhJha3
@TraderHarneet
@garwasanjay
@Rishikesh_ADX
@Investor_Mohit
@jitu_stock

1
69

📊 SPX Wochenchart – Bullisch oder Bärisch? 🤔
✅ Deutlicher Rücksetzer vom Bereich um 7.600
✅ Langer Wick → Käufer haben Schwäche gekauft
✅ Erster Test der wöchentlicher Cloud Support Struktur
❌ Wochenschluss unter dem Hoch
❌ Erste größere rote Wochenkerze nach der starken Rally (in Summe negativ geschlossen)
Die Bullen sagen: 🐂
“Nur ein gesunder Pullback nach einer überdehnten Rally. Die Käufer haben den Dip sofort aufgesammelt.”
Die Bären sagen: 🐻
“Erste Anzeichen von Erschöpfung. Das Hoch könnte bereits stehen und eine größere Korrektur startet.”
Am Ende entscheidet nicht die Kerze allein, sondern was der Markt nächste Woche daraus macht.
📈 Starke Folgekerze → Bullische Fortsetzung Richtung neue Hochs.
📉 Bestätigung nach unten → Die aktuelle Kerze könnte sich als erstes Warnsignal herausstellen.
👇 Eure Einschätzung? Nächste Woche haben wir auch die erste FED Sitzung mit Kevin Warsh und es wird eine kurze Tradingwoche Quadruple Witching (Börsentag, an dem vier verschiedene Arten von Derivaten gleichzeitig verfallen)
Bullisch 🐂 oder Bärisch 🐻?
#SPX #SP500 #Trading #Investing #ElliottWave #StockMarket #TechnicalAnalysis #Optionstrading $SPY

3
125

🔖 BookMark
↘️↗️ 𝗢𝘃𝗲𝗿𝘀𝗼𝗹𝗱 𝗦𝘁𝗼𝗰𝗸𝘀 | 𝗕𝗲𝗹𝗼𝘄 𝗥𝘀. 500 𝗢𝗻𝗹𝘆 ✅
3️⃣ NTPC – 354
𝗖𝗼𝗺𝗺𝘂𝗻𝗶𝘁𝘆 📌
t.me/TechnicalTradesTT
-
#TechnicalAnalysis
#ChartAnalysis

1
1
134

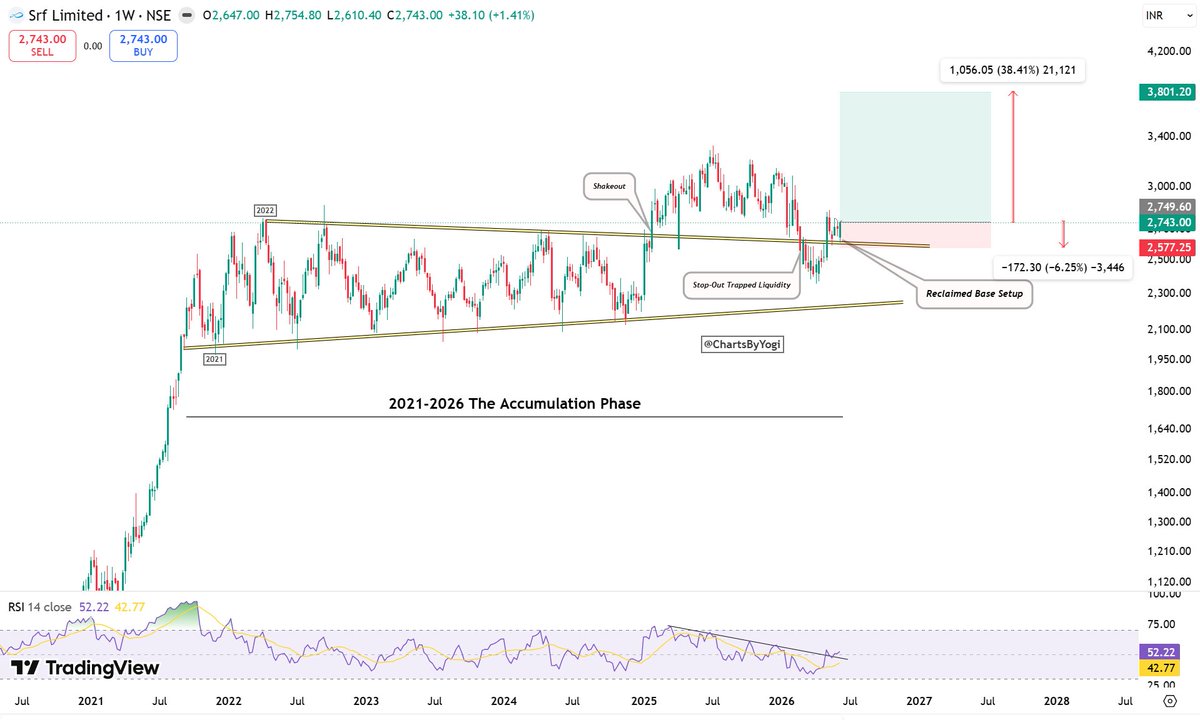
🚀 Before this chart goes viral...
❤️ Like if you see the setup.
🔄 Repost if you believe patience creates wealth.
💬 Comment "SRF" if you're tracking this breakout.
#SRF early 5 years (2021-2026), price has moved inside a massive consolidation range
The longer the base,
The bigger the potential move.
📊 Technical observations:
✅ Weekly structure remains constructive above ₹2,550-2,600 zone
✅ Previous resistance is attempting to flip into support
✅ RSI has recovered from weak levels and is turning higher
✅ Risk-reward remains favorable as downside is clearly defined
🎯 If buyers successfully defend this reclaimed base, the chart suggests a potential move toward the ₹3,800 zone over time.
That's roughly a 38% upside from current levels.
Remember:
Markets transfer shares from impatient participants to patient participants.
After 5 years of accumulation, SRF looks closer to the beginning of a new expansion phase than the end of one. 🚀
Not a recommendation. Manage risk accordingly.
#SRF #StockMarketIndia #NSE #TechnicalAnalysis #SwingTrading #Investing #BreakoutStocks #ChartOfTheDay #IndianStocks #WealthCreation #SmartMoney #PriceAction #StocksToWatch 📈🔥🚀
2
90

💥 Stocks Near 200-EMA 👀
📊 Often a key support/resistance zone where big moves can begin.
🔹 INDOCO
🔹 IDFC First Bank
🔹 AIIL
🔹 TBZ
🔹 Can Fin Homes
🔹 GAIL
🔹 Concord Biotech
🔹 Ramkrishna Forgings
🔹 Religare
🔹 V-Mart
🔹 Kotak Mahindra Bank
🔹 Page Industries
📌 Keep these stocks on your watchlist.
#200EMA #StocksToWatch #TechnicalAnalysis #IDFCFirstBank #KotakBank #GAIL #StockMarketIndia #Trading
2
55
#Silver #XAGUSD #SilverPrice #SilverMarket #SilverTrading #PreciousMetals #Bullion #SilverBullion #MetalsMarket #CommodityMarket #Commodities #Investing #Trading #PriceAction #TechnicalAnalysis #MarketAnalysis #FuturesTrading #GlobalMarkets #SafeHaven #InflationHedge #WealthPreservation #StockMarket #Finance #Markets #Trader #Investors #EconomicOutlook #MacroEconomics #SilverInvesting #PhysicalSilver
17
As long as it holds above ₹128-130, the path of least resistance remains upward.
🎯 Technical projection points towards ₹160 (~20% upside) in the coming months.
#RICOAUTO #AutoAncillary #BreakoutStocks #TechnicalAnalysis #NSE #StocksToWatch #ChartOfTheDay #StockMarketIndia 📊💰🔥

7
282

📊 THE $BTC 6-MONTH PATTERN:
Red candles → then the green reversal. 🔴➡️🟢
Every cycle:
• 2015 → 3 red (the one exception) ✅
• 2018 → 2 red ✅
• 2022 → 2 red ✅
• 2026 → red candle 2 → reversal loading ⏳
History doesn't repeat, but it often rhymes. 🐂
#Bitcoin #BTC #TechnicalAnalysis #CryptoCycle
17

Is your stock in an uptrend?
Is a bull flag forming right now?
What are the last 3 candles saying?
PivChart answers all three — free, for every NSE/BSE stock.
pivchart.com
#NSE #Nifty #StockMarket #TechnicalAnalysis
59

Big-screen analysis. Pocket-sized device. The FxPro App takes serious charting wherever you go.
#FxProApp #TechnicalAnalysis #MobileCharts
