
6 Feb 2025
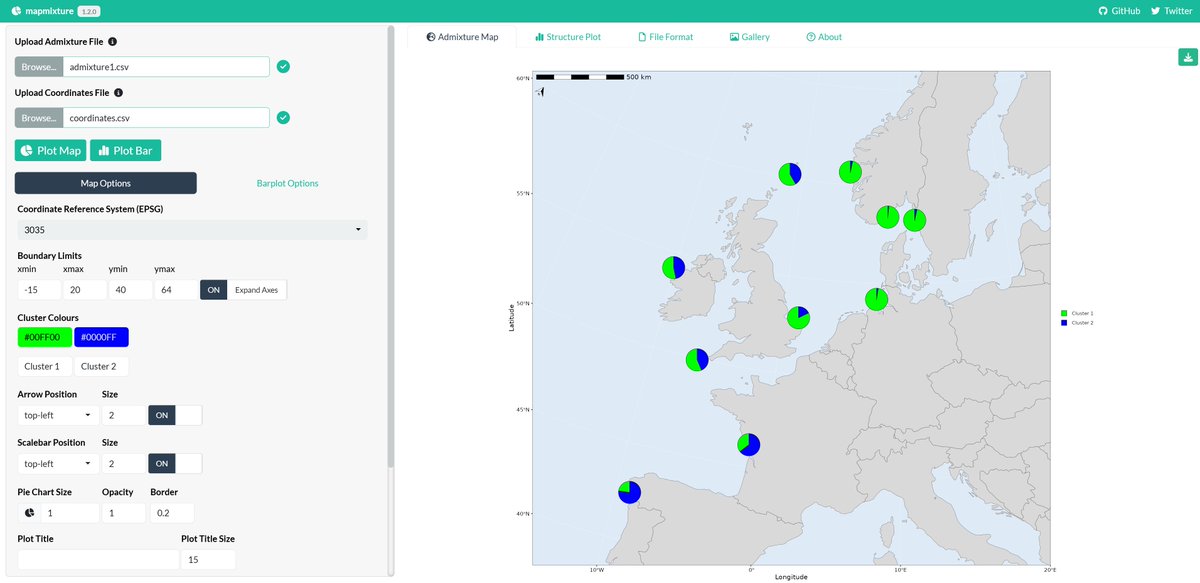
#mapmixture Shiny app
User feedback has highlighted the utility of this app for teaching admixture and doing interactive demos in lectures / practicals. Please give it a try!
• updated to version 1.2.0 (same as R package)
• faster load times
tomjenkins.shinyapps.io/mapm…
1
3
178
23 Jan 2025
#mapmixture news:
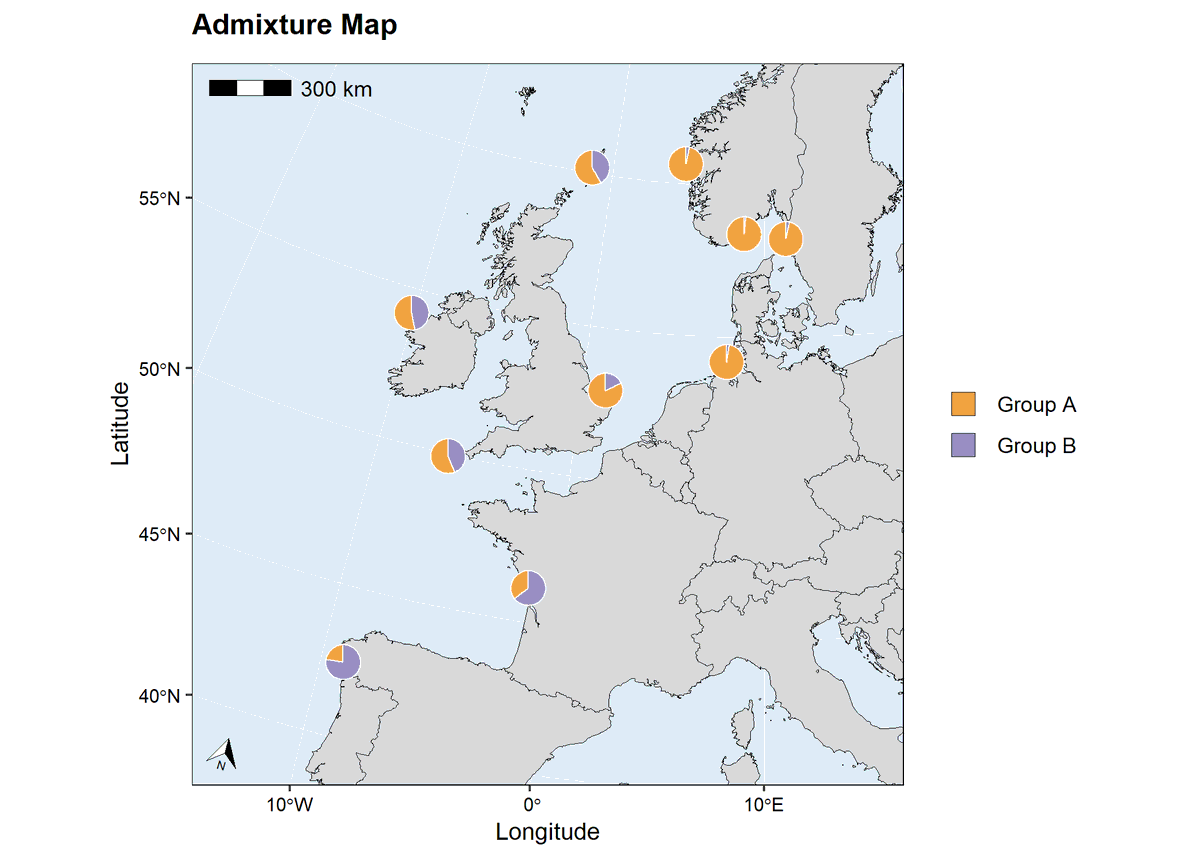
Version 1.2.0 release includes option to plot pies of different sizes, and preserving the individual input order on the structure plot.
Install from CRAN with install.packages("mapmixture")
github.com/Tom-Jenkins/mapmi…
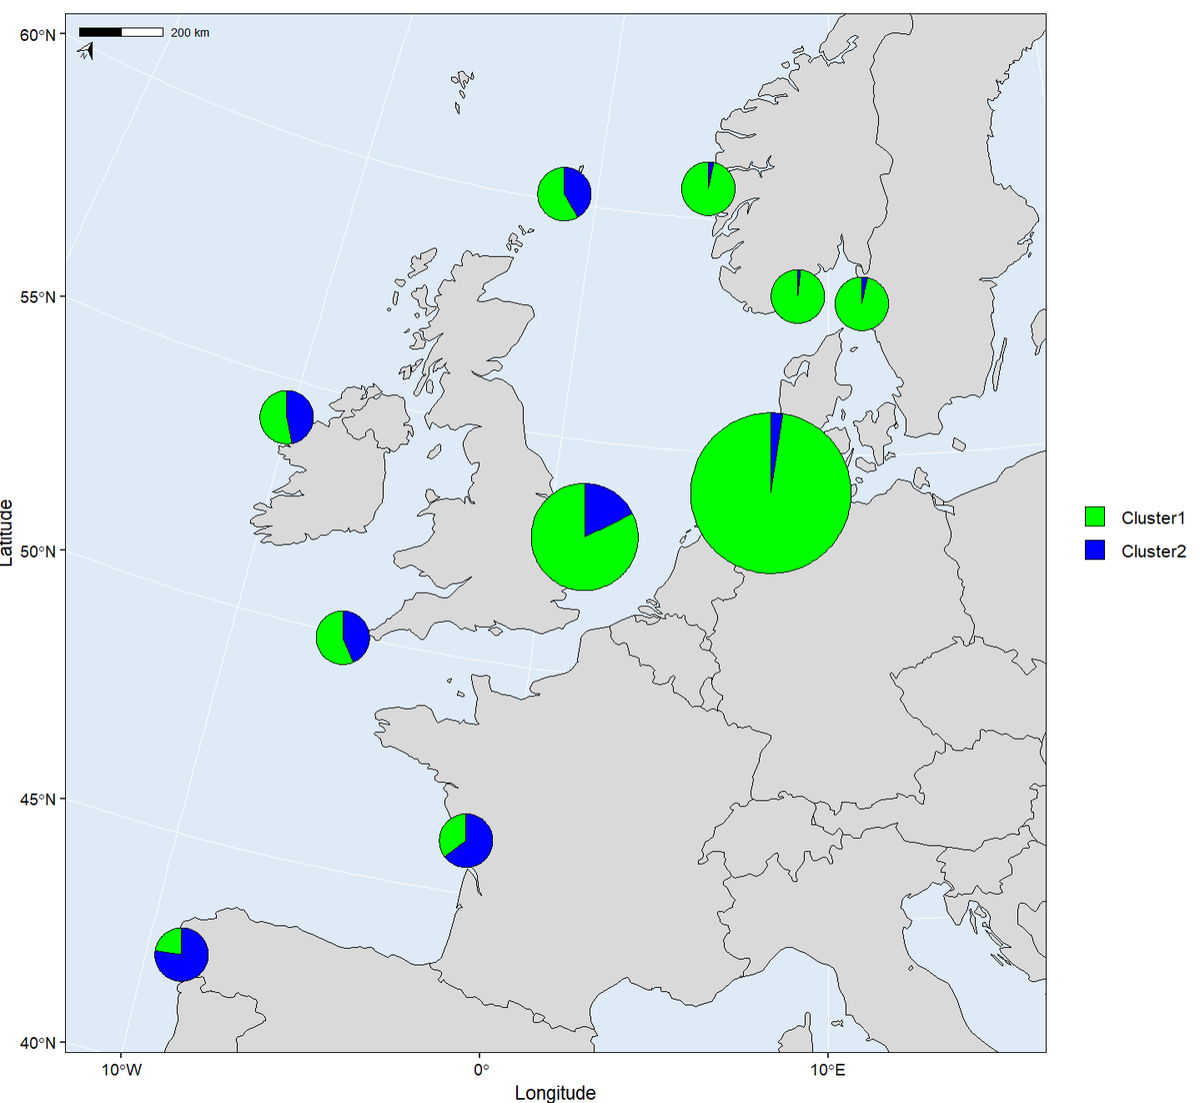
ALT Example admixture map generated through the R package mapmixture. The plot shows how users can plot pies of different sizes for sites.
2
9
445
20 Jan 2025
Citation:
Jenkins TL (2024). mapmixture: an R package and web app for spatial visualisation of admixture and population structure. Molecular Ecology Resources, 24: e13943. DOI: 10.1111/1755-0998.13943.
3
192
20 Jan 2025
#mapmixture R package plea:
If you have used mapmixture in your study, please could you cite the paper describing the package in your manuscript.
It really does help to show that people are actively using it in their research and analyses!
doi.org/10.1111/1755-0998.13…
2
29
92
7,635
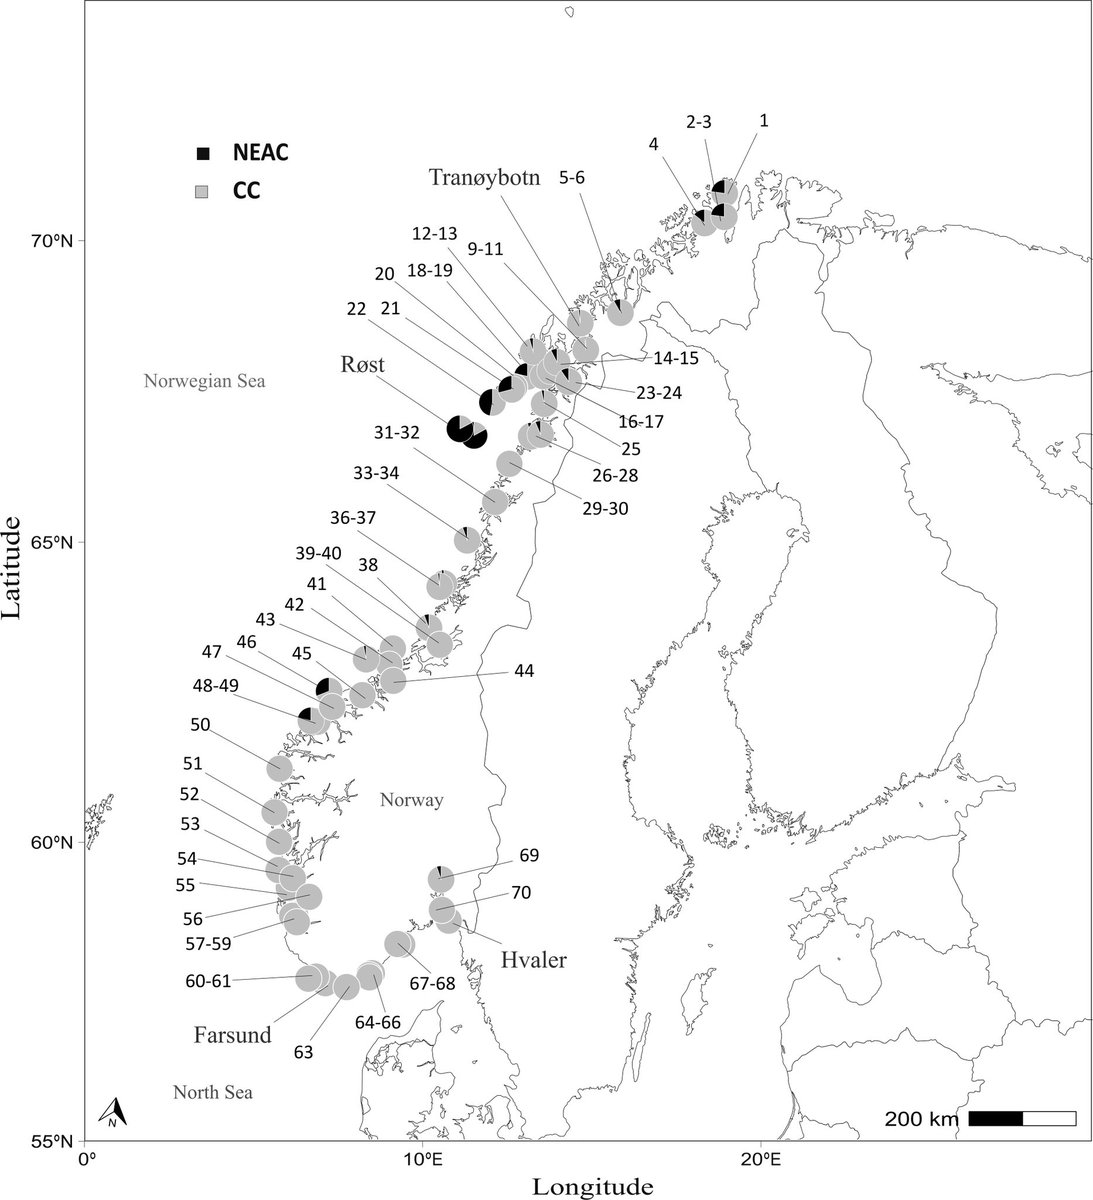
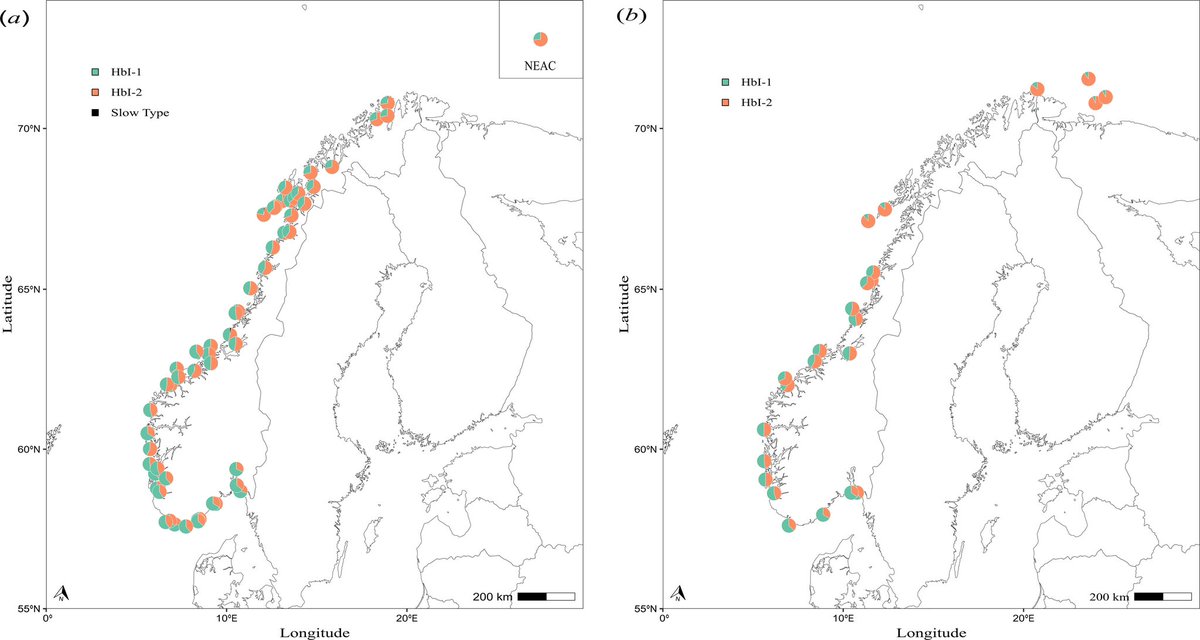
18 Jan 2025
Great to see #mapmixture being used for maps other than admixture. This study used the R package to plot proportions of a sample with species ecotype X, and allele frequencies of cod across sites in Norway.
doi.org/10.1098/rsos.241760
6
234
25 Sep 2024
#mapmixture news:
version 1.1.4 release includes some extra options to customise the admixture map and structure plots.
install from CRAN with install.packages("mapmixture"), requires R-4.2 to be installed.
github.com/Tom-Jenkins/mapmi…
7
41
3,183
21 May 2024
mapmixture v1.1.3 release available from CRAN 🗺️🥧
Improvements and some added features, including option to change border colour of admixture pies.
cran.r-project.org/package=m…
#rstats #admixture #popgen
ALT Admixture map created using mapmixture R package
1
16
59
5,556
22 Apr 2024
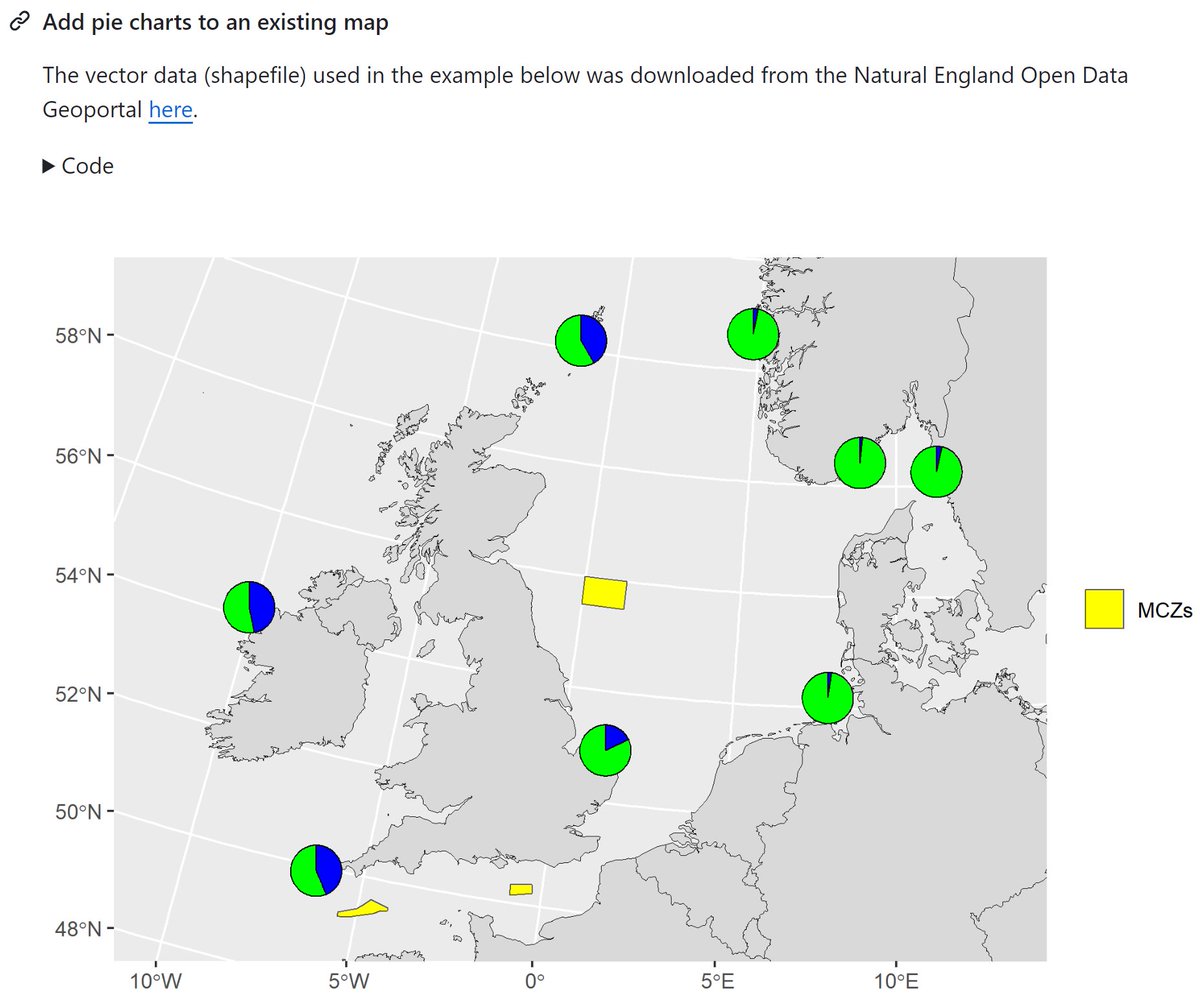
mapmixture #rstats package specialises in plotting admixture as pie charts on a map (admixture maps).
However, you can also plot any data as pie charts on a projected map with no distortion issues using the add_pie_charts() function.
Check it out here: shorturl.at/fAGK1
8
34
2,013
17 Apr 2024
The latest stable version of mapmixture is now available to install from CRAN!
install.packages("mapmixture")
cran.r-project.org/web/packa…
github.com/Tom-Jenkins/mapmi…
#rstats
26 Feb 2024

⭐️New paper out in @molecology describing the mapmixture R package.
• Plot pie charts on a projected map
• Publication-ready admixture maps and structure barplots
• In R or interactively via Shiny web app
doi.org/10.1111/1755-0998.13…
#popgen #rstats #genomics
3
10
1,277

26 Feb 2024
mapmixture: An R package and web app for spatial visualisation of admixture and population structure | Molecular Ecology Resources
onlinelibrary.wiley.com/doi/…
7
26
2,687
26 Feb 2024
mapmixture scatter_plot() function makes it easy to visualise PCA or DAPC results.
• Colour points by group_ids (e.g. site) or by other_group (e.g. country)
• Add centroids (mean position for group_ids)
• Plot labels instead of points
doi.org/10.1111/1755-0998.13…
#popgen
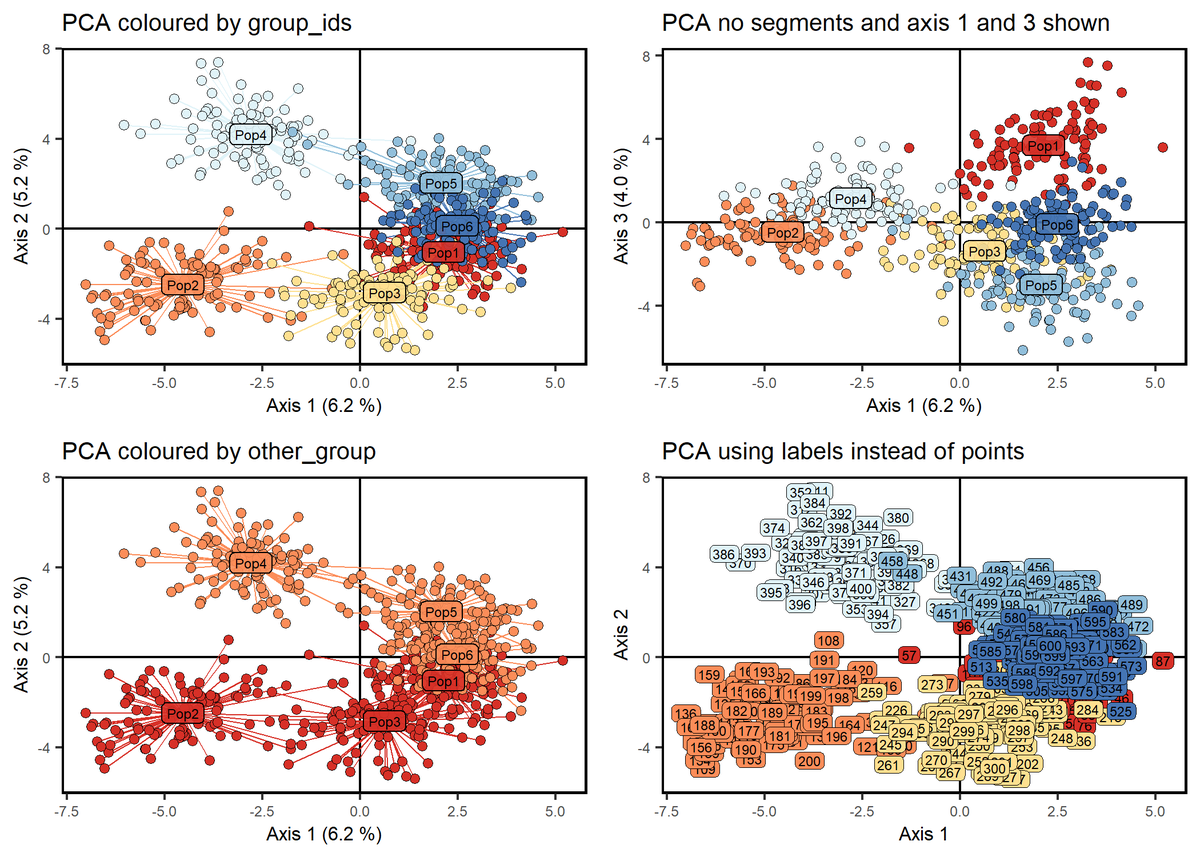
ALT Scatter plots of PCA results created with mapmixture.
1
6
269
26 Feb 2024
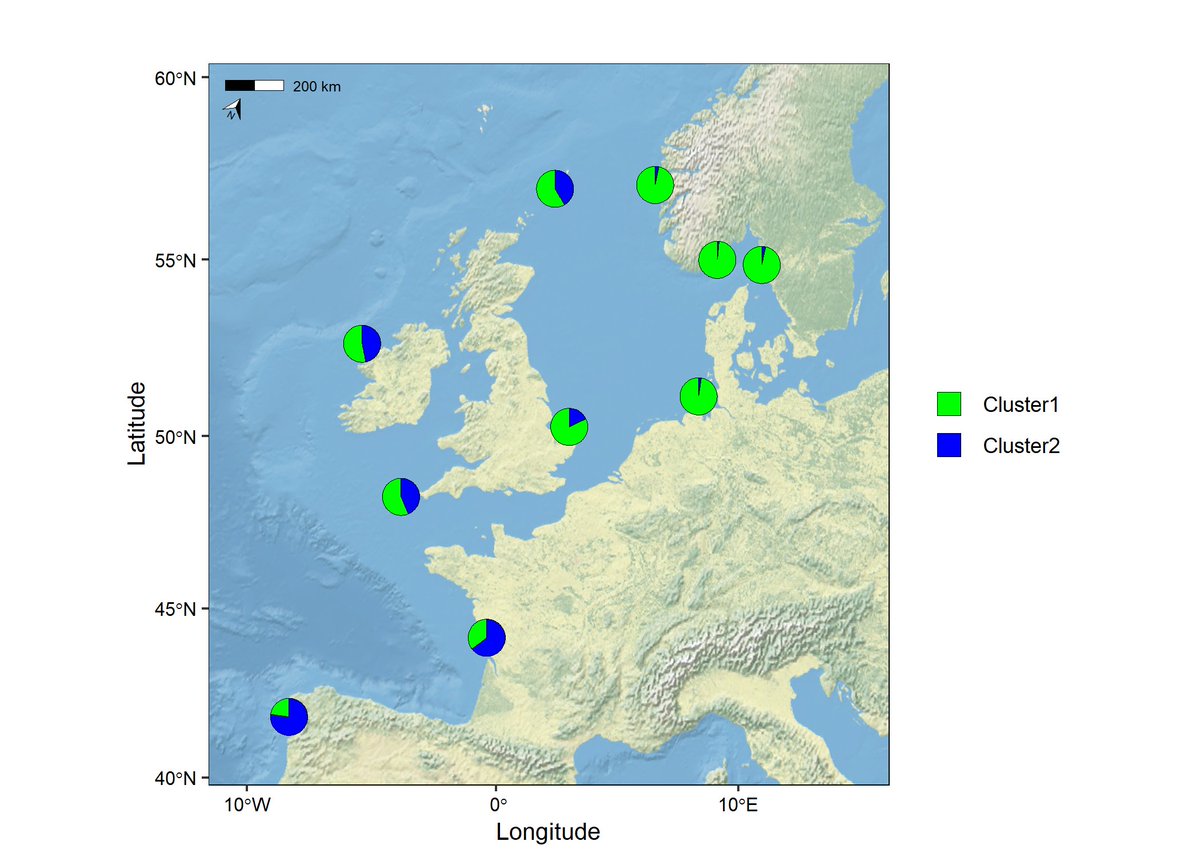
mapmixture() is the main function for creating admixture maps. Plot multi- or single-coloured pie charts on a projected map.
structure_plot() function plots admixture barplots using the same input data.
doi.org/10.1111/1755-0998.13…
#popgen #ancestry
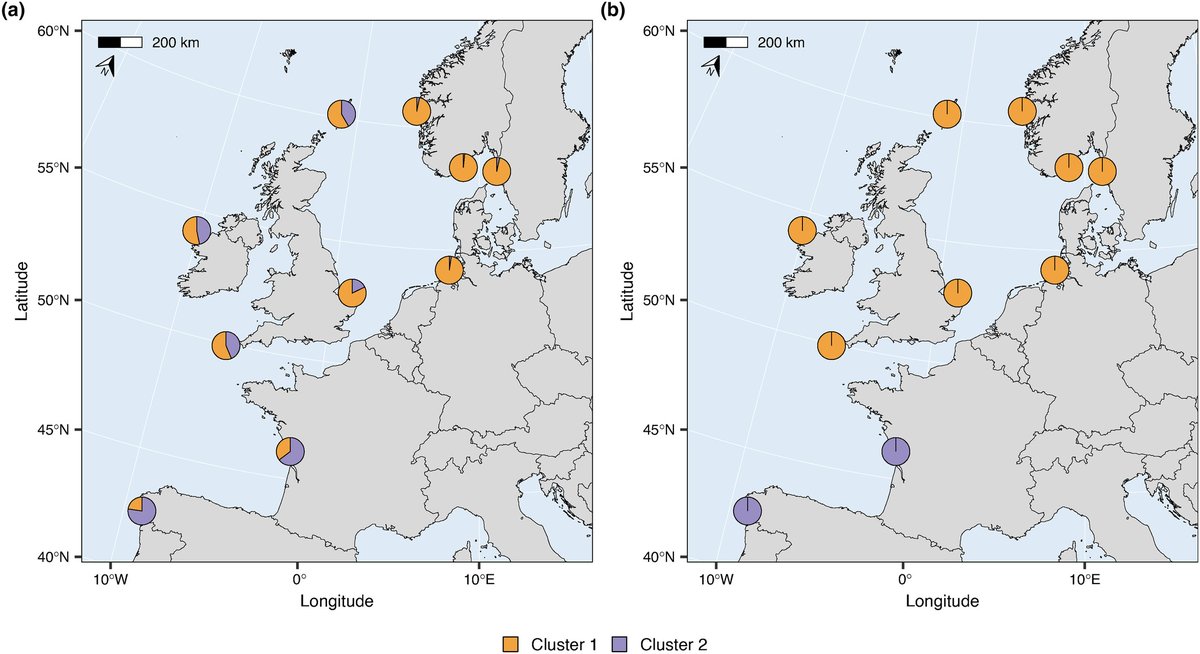
ALT Admixture maps created with mapmixture.
1
3
8
906
26 Feb 2024
⭐️New paper out in @molecology describing the mapmixture R package.
• Plot pie charts on a projected map
• Publication-ready admixture maps and structure barplots
• In R or interactively via Shiny web app
doi.org/10.1111/1755-0998.13…
#popgen #rstats #genomics
2
62
191
21,799
17 Jan 2024
I've added a function to the mapmixture R📦 specifically to make plotting PCA or DAPC results easier for #popgen #rstats users.
• Add centroids to scatter (mean position for group)
• Colour by population or by other group (e.g. country)
• Plot labels
shorturl.at/nJP68

1
49
215
17,302

11 Dec 2023
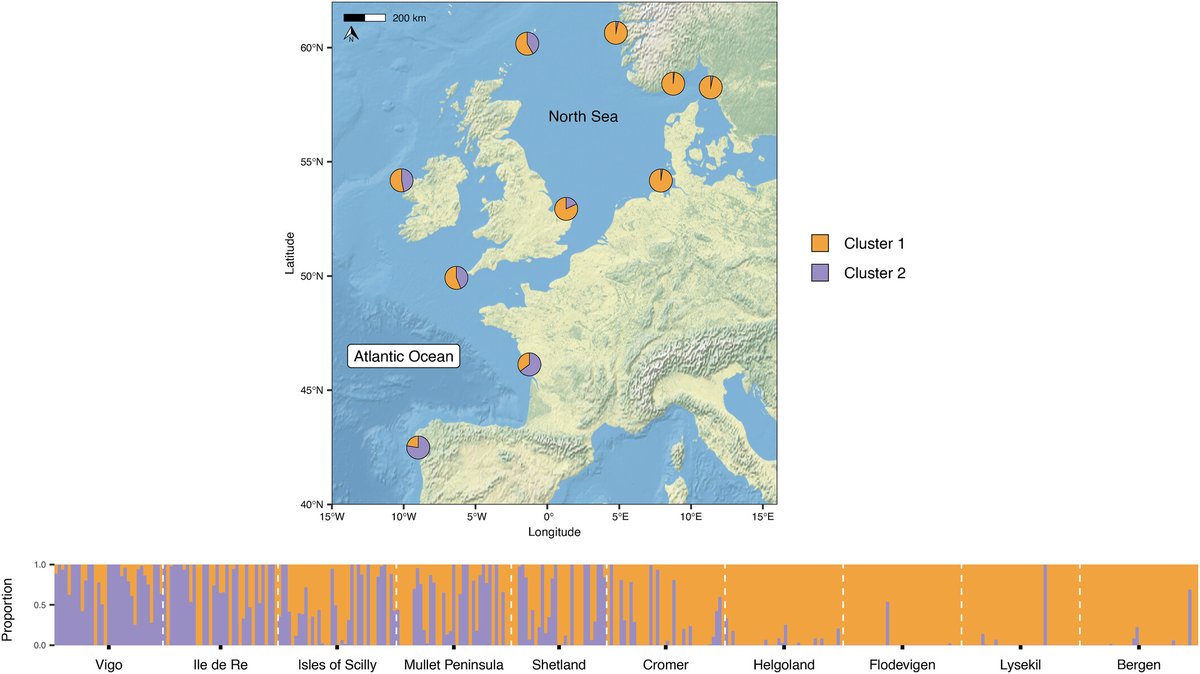
I like things that make Pop Gen in R easy. And #mapmixture makes it *REALLY* easy to produce pub-quality figures of sitewise cluster membership on maps of various projection.
Only two .csv files needed; site coordinates and cluster assignments (Structure/Admixture/Snapclust). 👏
5 Dec 2023
Update on MAPMIXTURE:
After much work, it is now a fully functioning R package! 📦🎉
You can currently install the development version from within R – instructions and lots of examples on GitHub. There is also a little accompanying paper in review 🤞
github.com/tom-jenkins/mapmi…

3
333
8 Dec 2023
Visualising a haplotype for each site should be possible if you convert the data into the format required for mapmixture.
2
64

5 Dec 2023
I wonder if we can map haplotype data (output from Popart) in the same way using Mapmixture? Thanks
1
2
209
5 Dec 2023
Update on MAPMIXTURE:
After much work, it is now a fully functioning R package! 📦🎉
You can currently install the development version from within R – instructions and lots of examples on GitHub. There is also a little accompanying paper in review 🤞
github.com/tom-jenkins/mapmi…
2
38
150
23,078
26 Sep 2023
Mapmixture v1.0.4 is now available online and for users to setup locally in their own R environment!
Improvements include categories for deciding which map projection to use and option to change border thickness of pie charts 🧬🌏
#rstats #shiny #genomics #ancestry #admixture
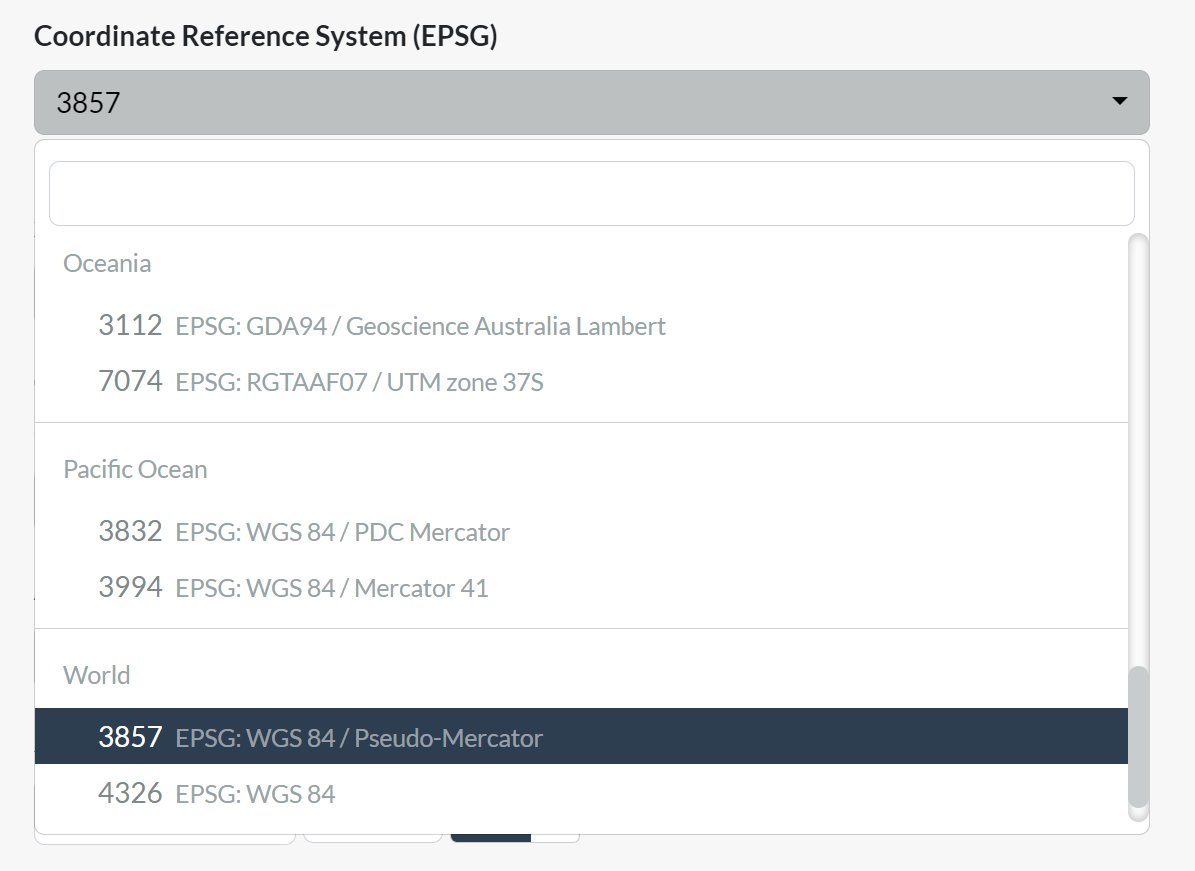
ALT A screenshot showing the new coordinates reference system feature of categories for each projection. For example, projections for Europe can be found under the Europe category.
17 Aug 2023
Mapmixture v1.0.3 release now available to users! Features bug fixes and rendering of default cluster colours on map🎨🧬🌎
There is also a guide on how to set up the app locally on Windows or Linux.
github.com/Tom-Jenkins/Mapmi…
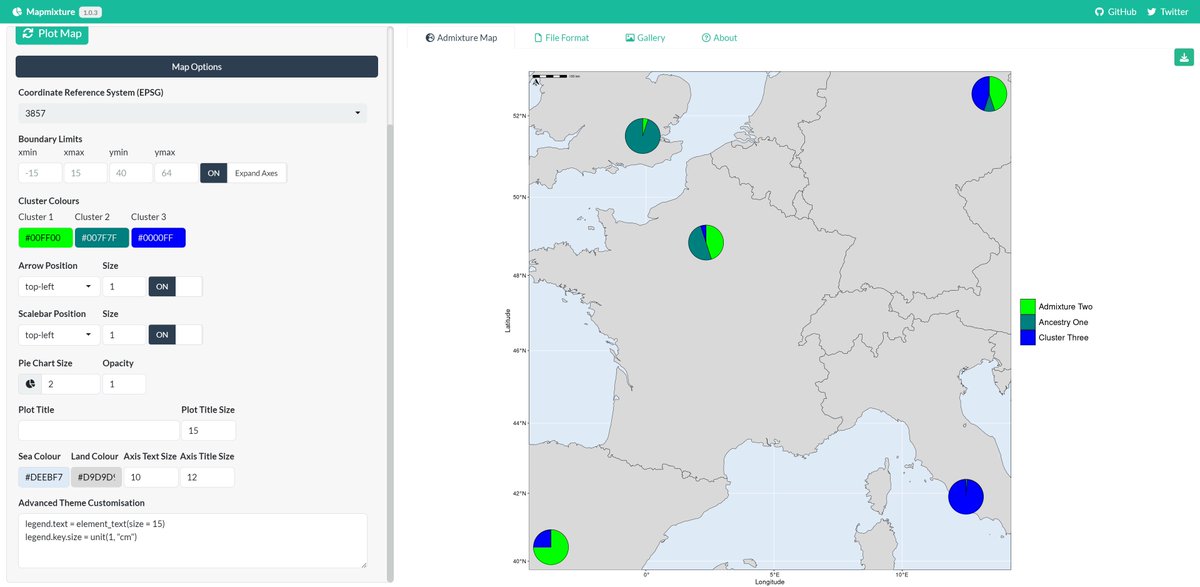
ALT An example screenshot of Mapmixture version 1.0.3.
2
8
1,444
18 Aug 2023
If you like Mapmixture please do give it a star on GitHub ⭐️
It will help others find the app and motivate me to continue developing it to improve features and performance :)
1
118