
Researcher in molecular ecology and genomics 🦇🦞🪸. Creator and maintainer of #mapmixture R package. Founder of TJ Data Visualisation.
Joined August 2016
- Tweets 2,393
- Following 1,375
- Followers 1,606
- Likes 2,569
306 Photos and videos


Pinned Tweet

1 Apr 2025
My freelance data visualisation consultancy business goes live today!
Please have a look at my website below and get in touch to discuss a project. I build user-friendly, professional-looking web applications, dashboards and interactive maps and charts.
tomjenkins.co.uk
ALT https://tomjenkins.co.uk
1
5
408
2 Jun 2025
Explore real-time earthquakes in the last 24 hours or last week with this interactive dashboard.
earthquake-dashboard.netlify…
#earthquake #earth
1
165
Tom Jenkins retweeted

12 Mar 2025
We're so proud of @Dr_MTaylor of @EssexLifeSci as she leads an @SchmidtOcean and @oceancensus expedition to the remote #SouthSandwichIsands that skirt Antartica.
They are searching for new species and investigating the impact of deep sea volcanos.
brnw.ch/21wRgSB
11
26
1,357
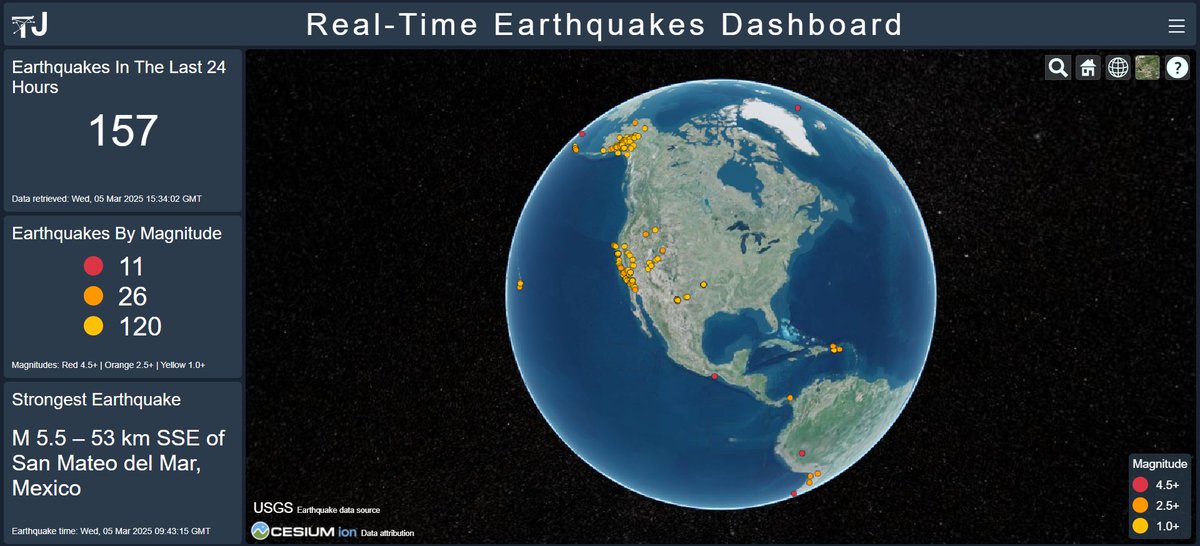
5 Mar 2025
I think I’d like a future job in app or dashboard development, because I really enjoy it!
Here is my attempt at a Real-Time Earthquake Dashboard using US Geological Survey and Cesium APIs.
earthquake-dashboard.netlify…
ALT Screenshot of Real-Time Earthquake Dashboard
3
179
6 Feb 2025
#mapmixture Shiny app
User feedback has highlighted the utility of this app for teaching admixture and doing interactive demos in lectures / practicals. Please give it a try!
• updated to version 1.2.0 (same as R package)
• faster load times
tomjenkins.shinyapps.io/mapm…
1
3
178
6 Feb 2025
Test data can be found here:
github.com/Tom-Jenkins/mapmi…
And the R package GitHub and CRAN pages here:
github.com/Tom-Jenkins/mapmi…
doi.org/10.32614/CRAN.packag…
84
Tom Jenkins retweeted

23 Jan 2025
More than 40 percent of #postdocs leave academia. Those who landed a coveted faculty position were more likely to have had a highly cited paper, changed their research topic between their #PhD and postdoc, or moved abroad after receiving their doctorate. pnas.org/doi/10.1073/pnas.24… @PNASNews -> nature.com/articles/d41586-0… #ScienceCareer
15
518
1,702
303,863
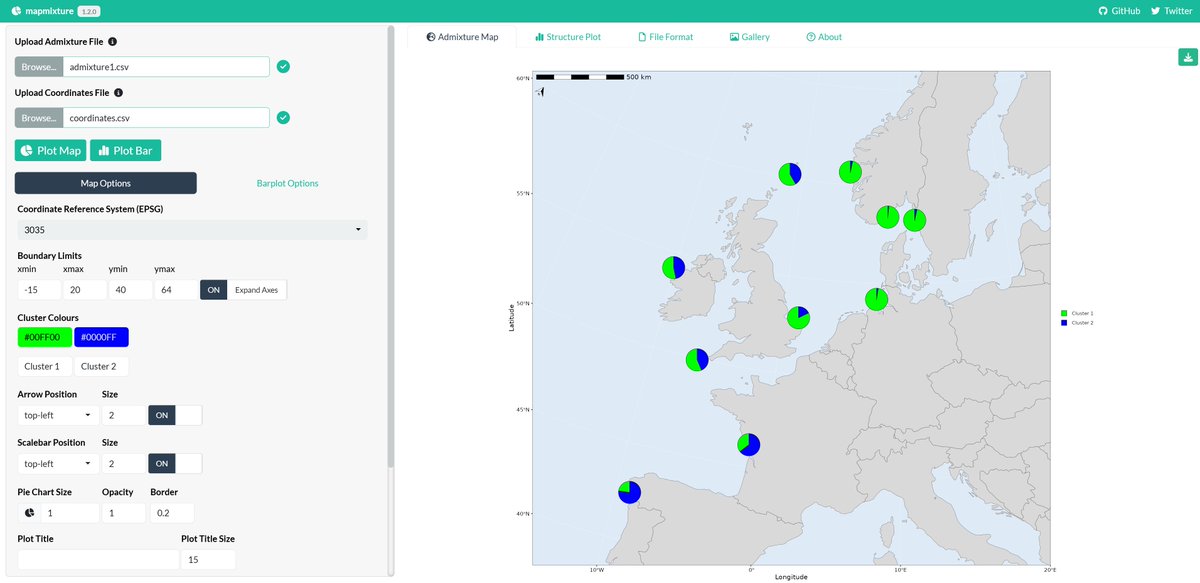
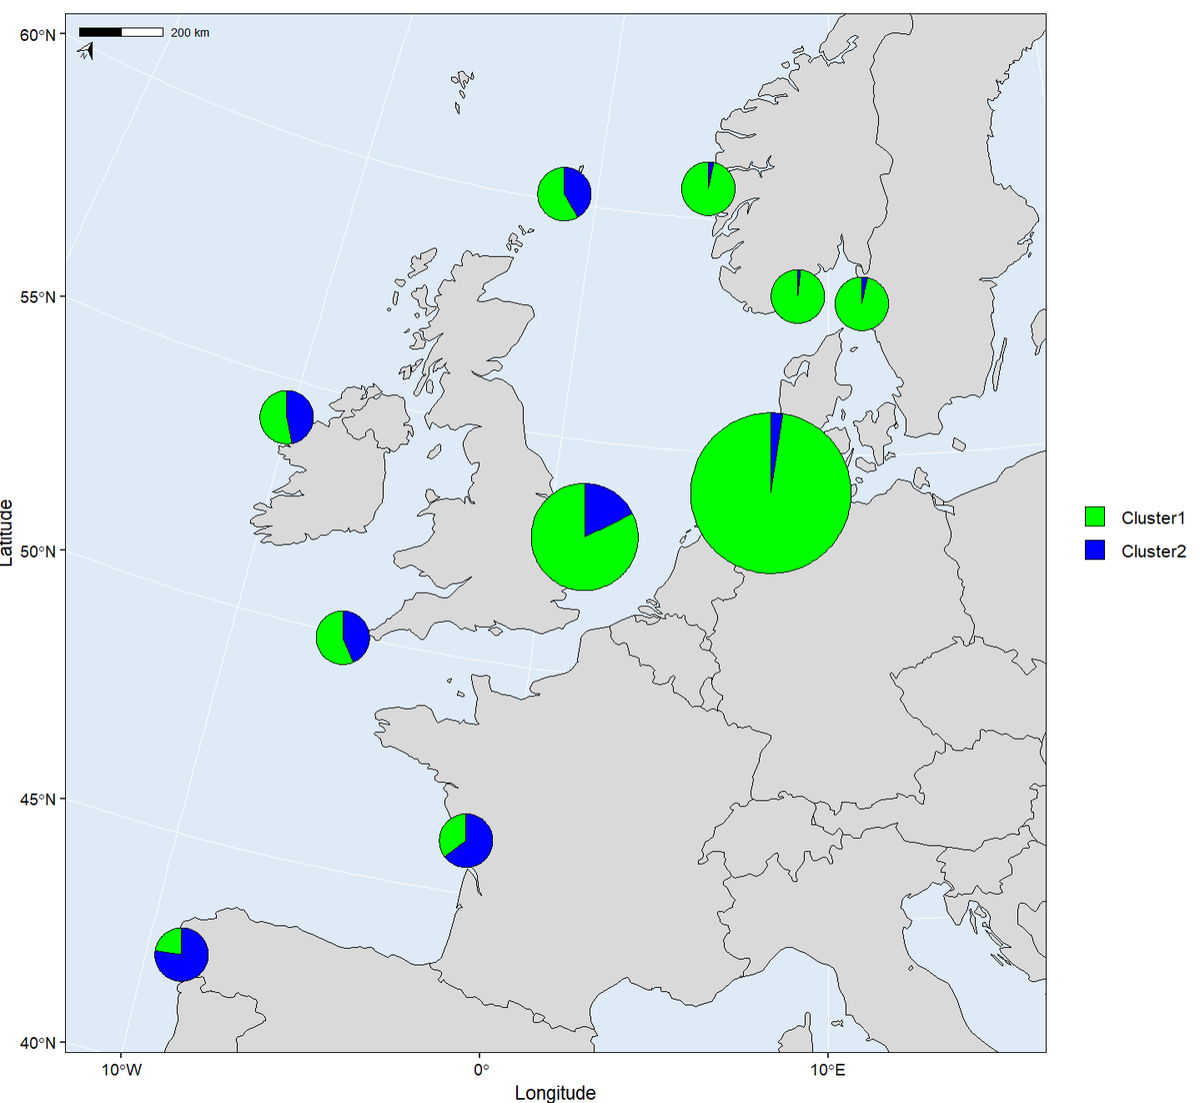
23 Jan 2025
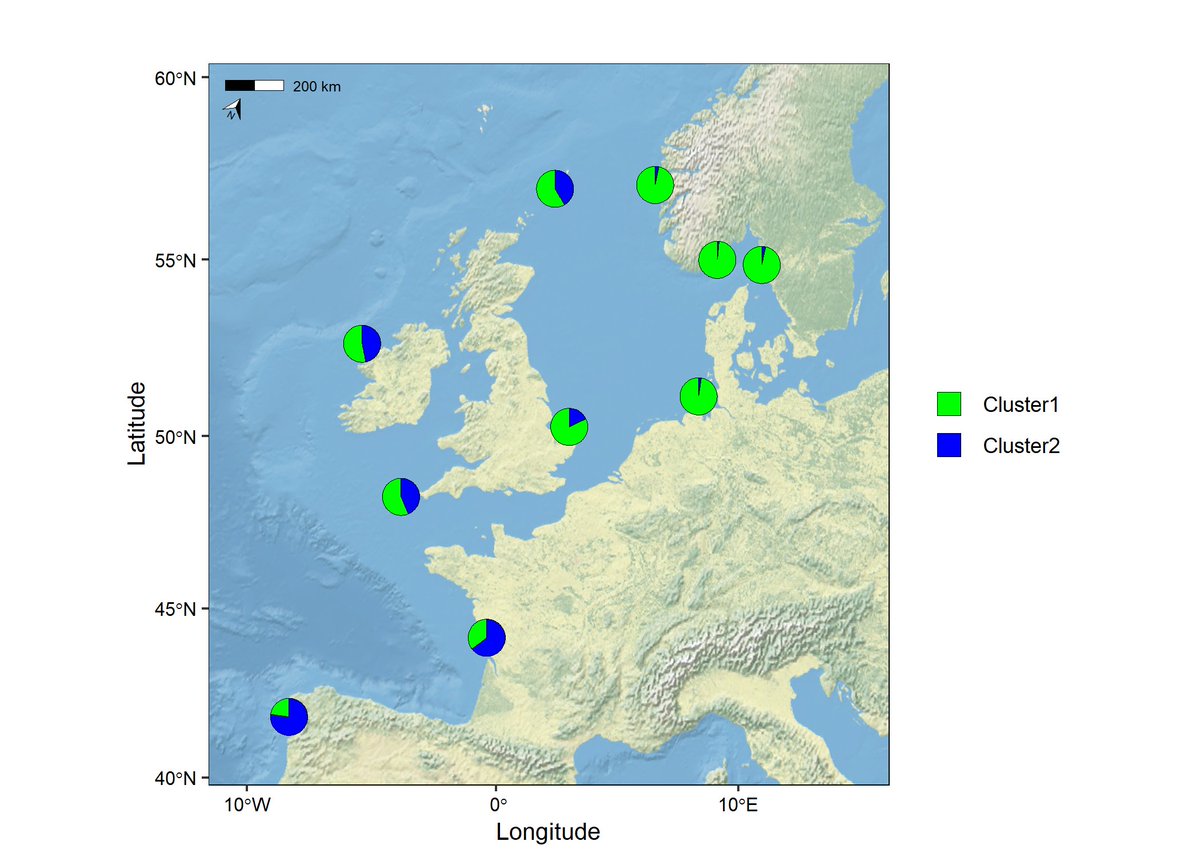
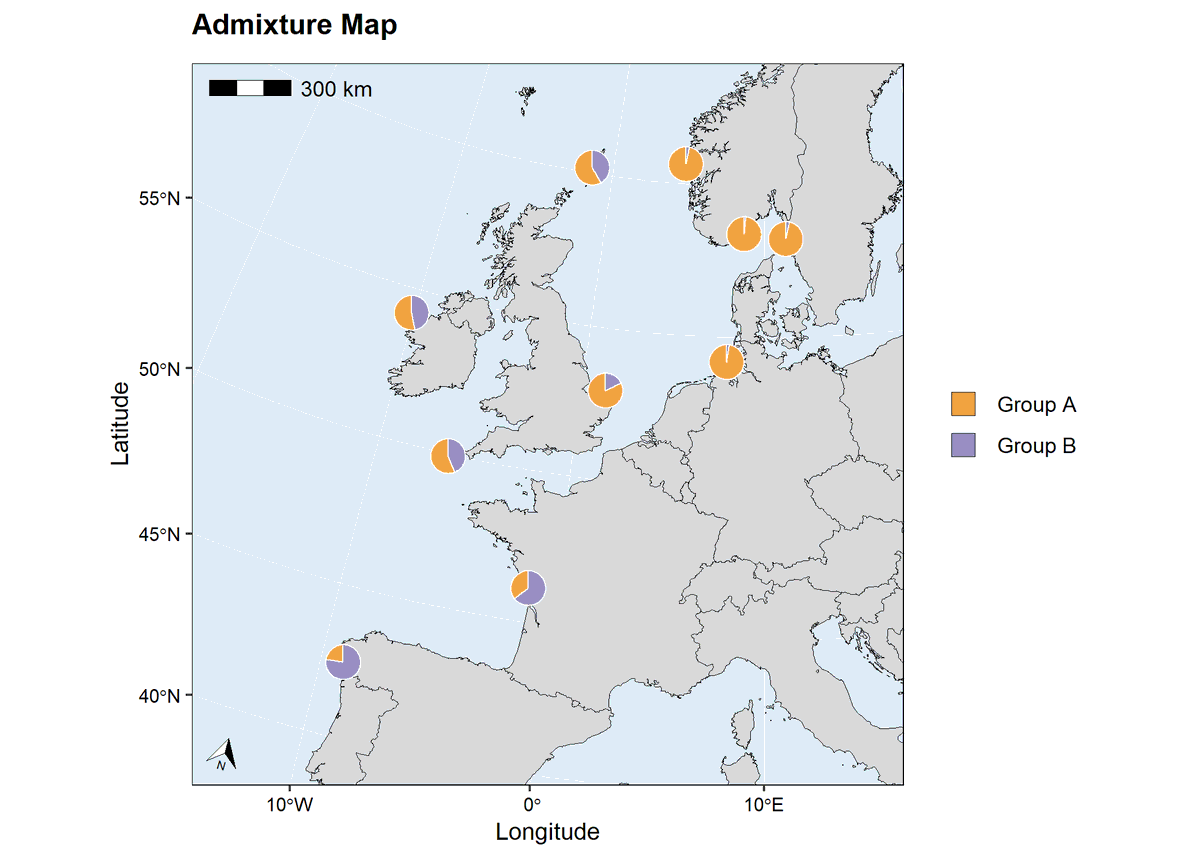
#mapmixture news:
Version 1.2.0 release includes option to plot pies of different sizes, and preserving the individual input order on the structure plot.
Install from CRAN with install.packages("mapmixture")
github.com/Tom-Jenkins/mapmi…
ALT Example admixture map generated through the R package mapmixture. The plot shows how users can plot pies of different sizes for sites.
2
9
445
20 Jan 2025
#mapmixture R package plea:
If you have used mapmixture in your study, please could you cite the paper describing the package in your manuscript.
It really does help to show that people are actively using it in their research and analyses!
doi.org/10.1111/1755-0998.13…
2
29
92
7,635
20 Jan 2025
Citation:
Jenkins TL (2024). mapmixture: an R package and web app for spatial visualisation of admixture and population structure. Molecular Ecology Resources, 24: e13943. DOI: 10.1111/1755-0998.13943.
3
192
Tom Jenkins retweeted

16 Jan 2025
🚨 Stop chasing the p-value!
Increasing your sample size will always yield a significant result.
Even for trivial differences.
🎮 I created a little interactive playground to illustrate this issue:
react-graph-gallery.com/exam…
Always pair p-values with effect sizes!
17
313
1,538
183,984
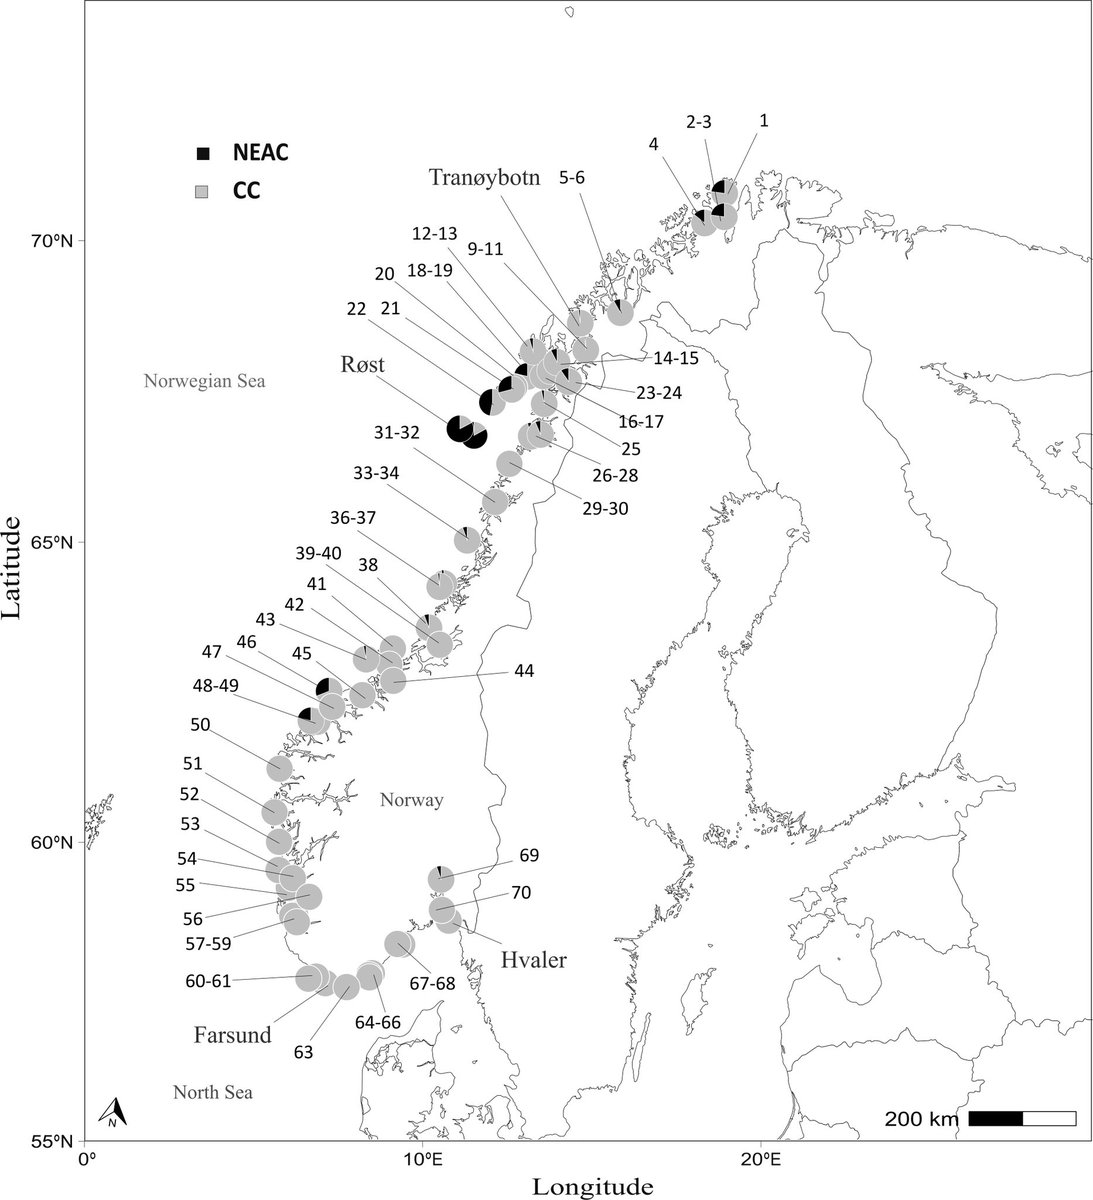
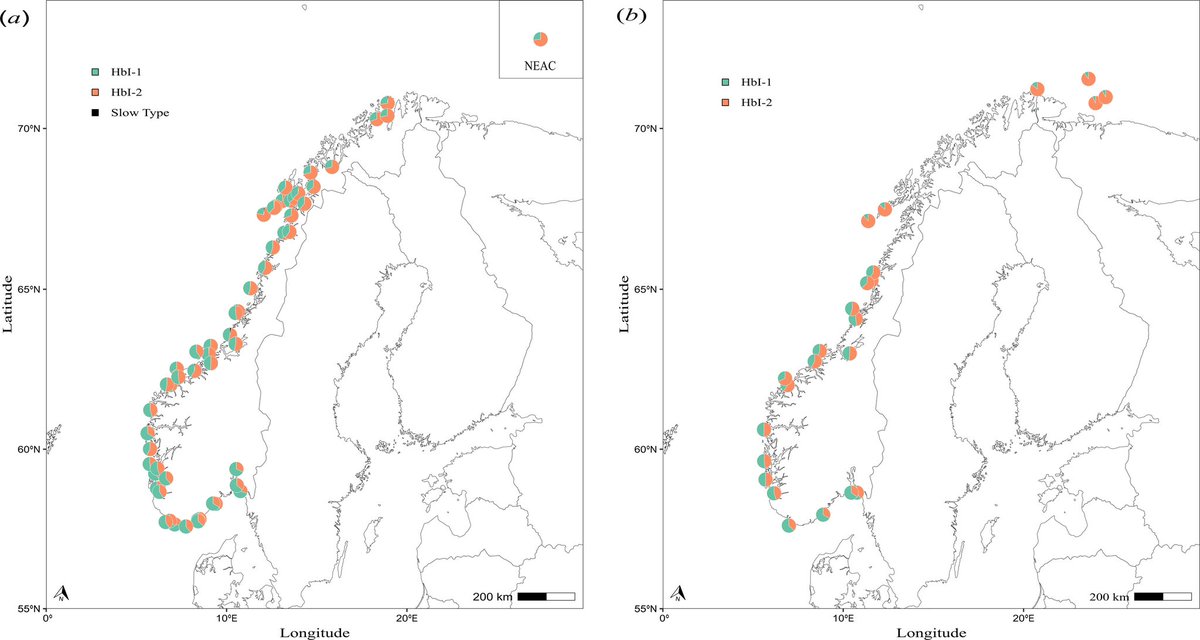
18 Jan 2025
Great to see #mapmixture being used for maps other than admixture. This study used the R package to plot proportions of a sample with species ecotype X, and allele frequencies of cod across sites in Norway.
doi.org/10.1098/rsos.241760
6
234
Tom Jenkins retweeted

16 Jan 2025
Window to stop decline of England’s nature closing fast, watchdog says theguardian.com/environment/…
1
4
2
319
Tom Jenkins retweeted

7 Jan 2025
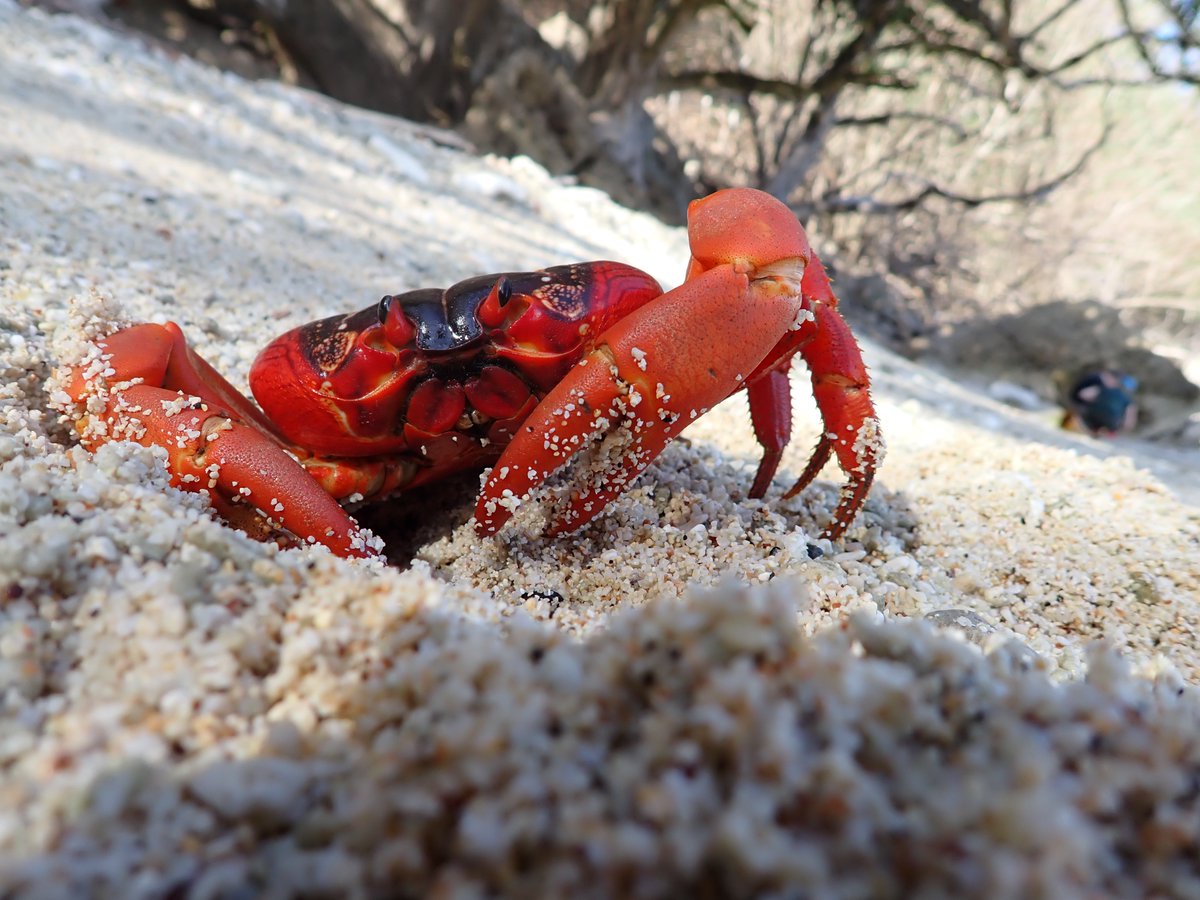
Paper from Christmas Island fieldwork is OUT !
Salinity does not affect late-stage in-egg embryonic, or immediate post-hatch development in an ecologically important land crab species
journals.biologists.com/jeb/…

4
11
430
Tom Jenkins retweeted

6 Jan 2025
Can we address the issue of seafood sector labour shortages in 2025?
PLEASE TAKE THIS SHORT SURVEY [20 mins] if you work or have worked in the UK fishing, aquaculture or processing sectors.
Survey results go straight to Government industry leaders.
online.ipsosinteractive.com/…

10
11
6
1,744
Tom Jenkins retweeted

20 Nov 2024
New in ME by @josephine_paris, @dr_andyking, @patbhamilton, @jcatchen, & @Fish_Genomics.
RADseq & RNAseq reveal the basis of metal tolerance in brown trout living in polluted rivers.
@WileyEcolEvol @UniofExeterNews @ExeterEvo @ExeterMarine
📷 @DanielOsmond
buff.ly/3Og5cyk
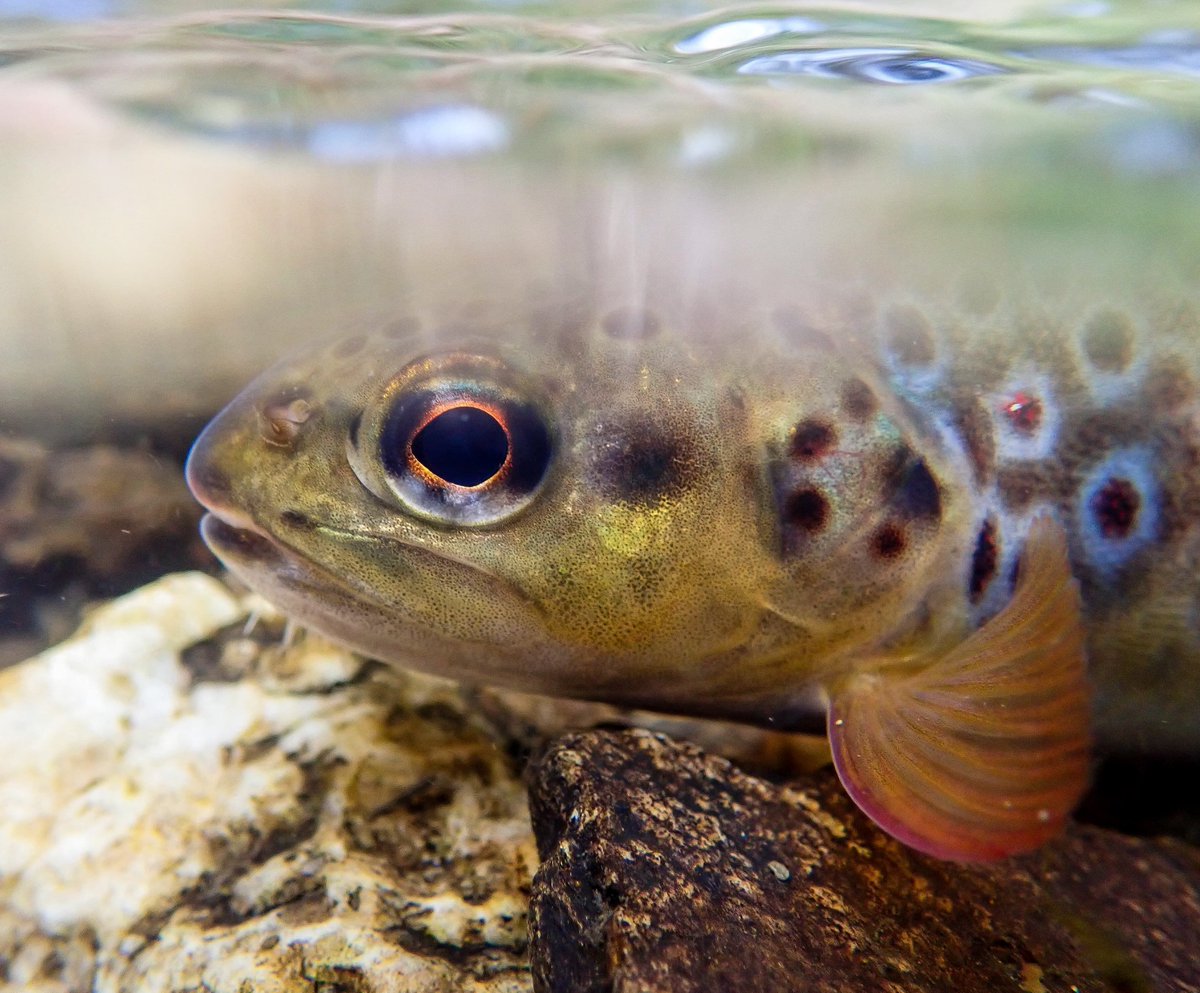
ALT Picture of a brown trout.
7
14
1,209
Tom Jenkins retweeted

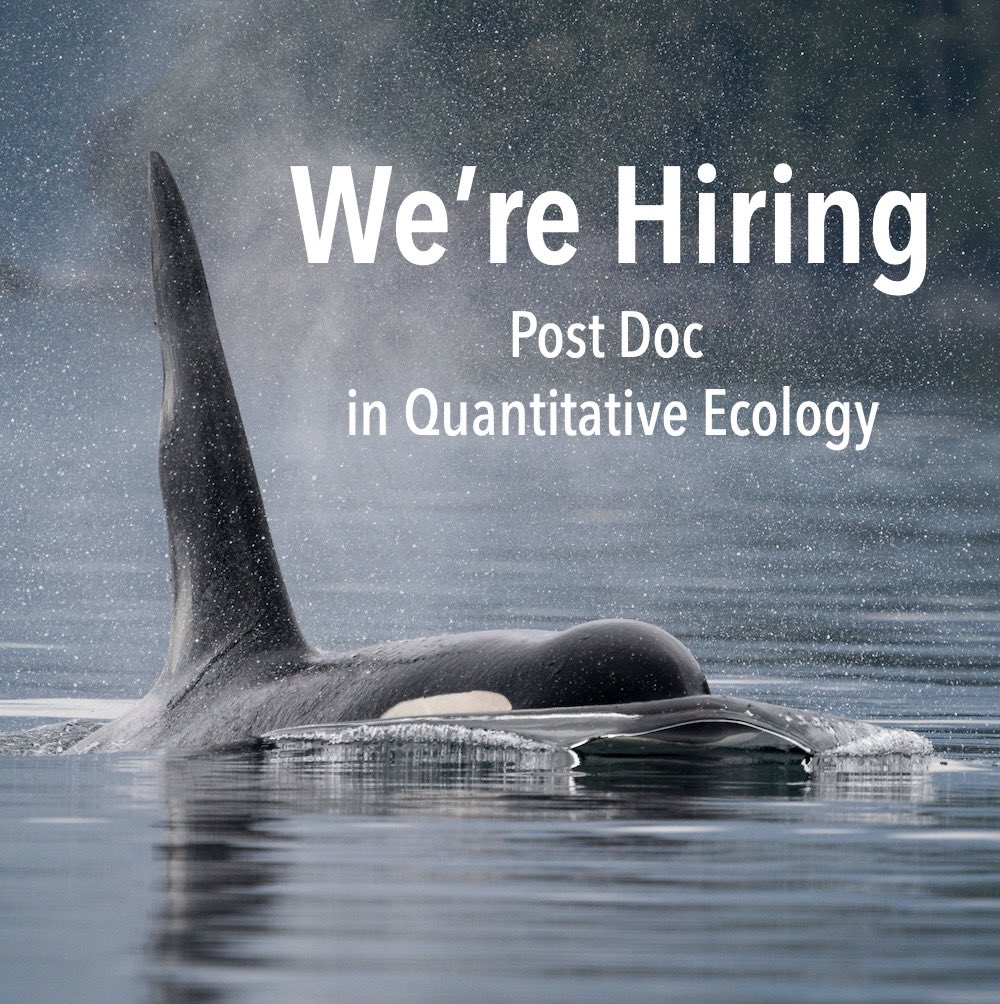
16 Nov 2024
We’re hiring a 3-year #postdoc in statistical ecology in #Seattle. Apply your statistical skills to conservation & natural resource management: killer whales, dolphins, salmon, climate change, fisheries. Is this you? oceansinitiative.org/careers…
1
63
69
8,120
15 Nov 2024
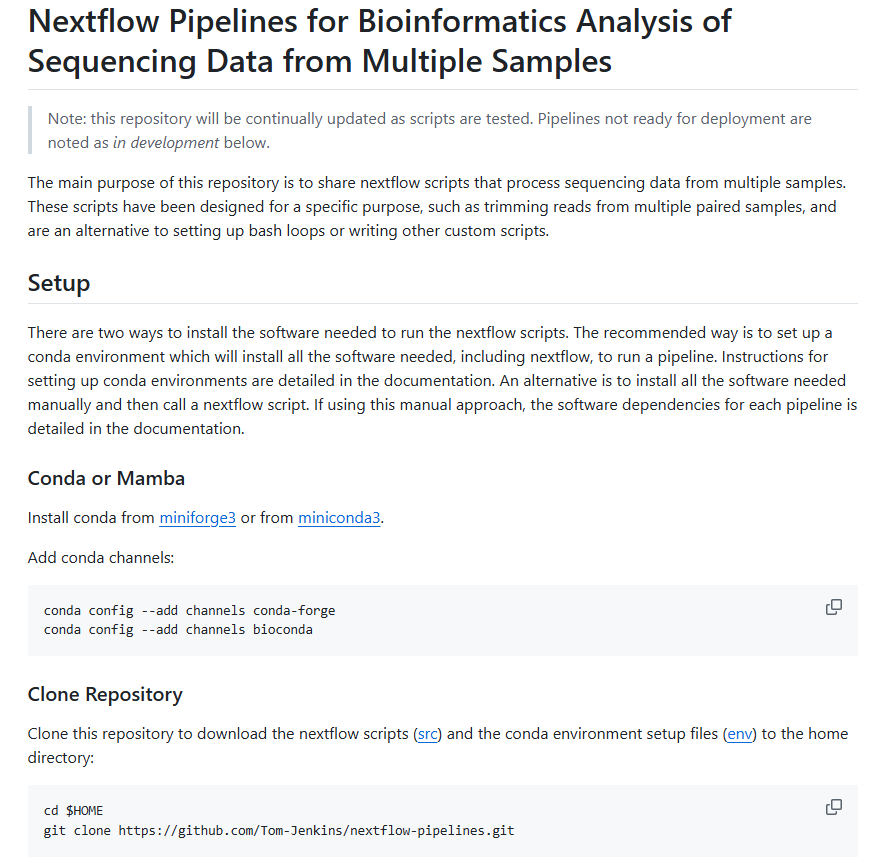
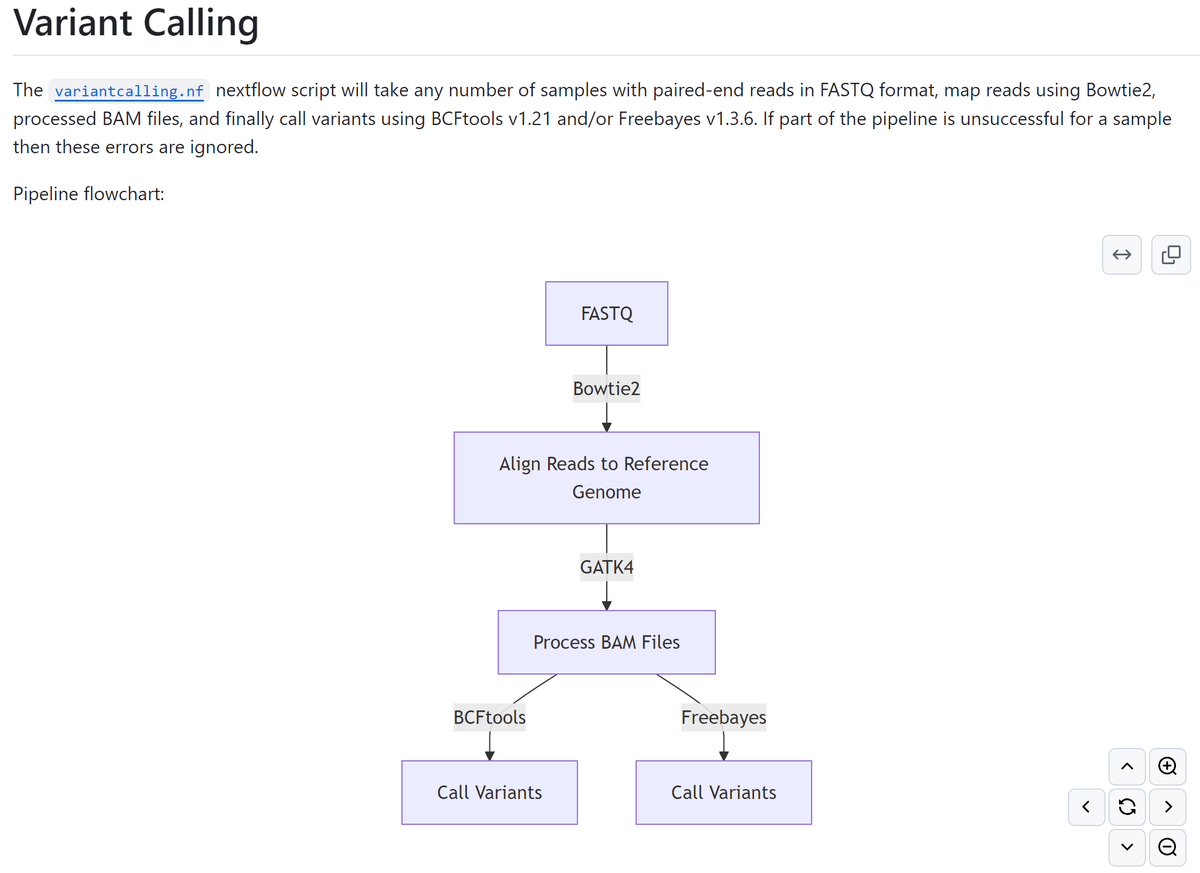
Pipelines with easy conda setup have been tested and are ready to try out, now with customisable input parameters.
They are a simple alternative to bash loops or other means to run paired reads through routine bioinformatics tasks. Feedback welcome!
github.com/Tom-Jenkins/nextf…
ALT Screenshot of the home page documentation about setup and conda.
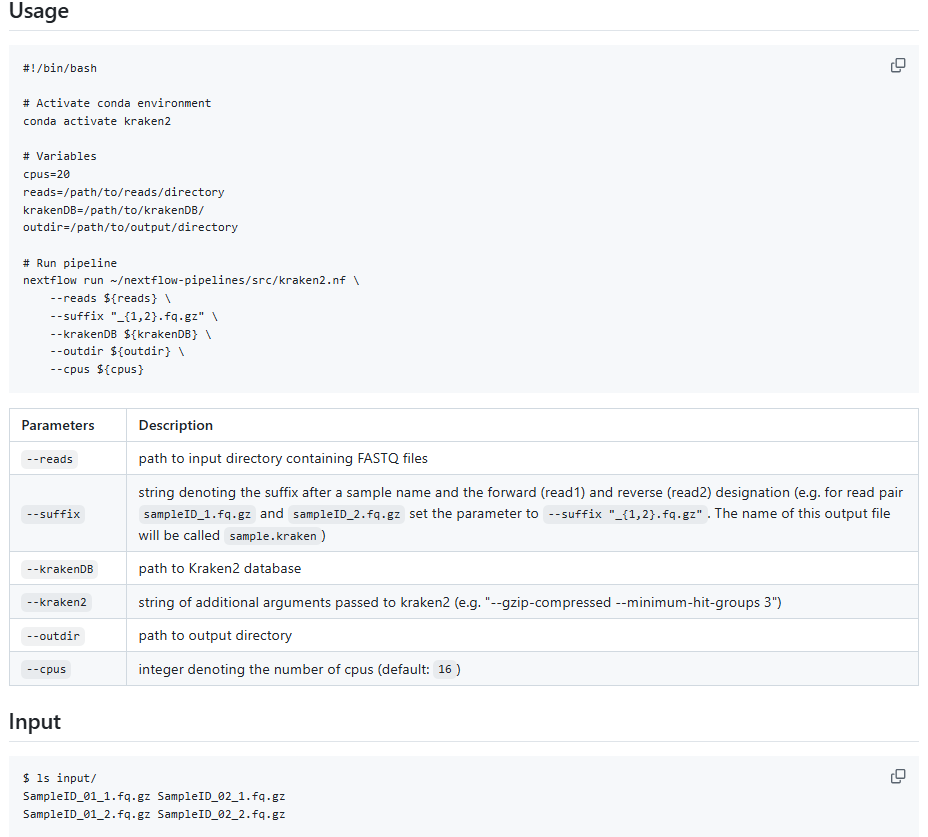
ALT Screenshot of the Kraken2 pipeline documentation.
2
6
499
Tom Jenkins retweeted
25 Sep 2024
#mapmixture news:
version 1.1.4 release includes some extra options to customise the admixture map and structure plots.
install from CRAN with install.packages("mapmixture"), requires R-4.2 to be installed.
github.com/Tom-Jenkins/mapmi…
7
41
3,183
Tom Jenkins retweeted

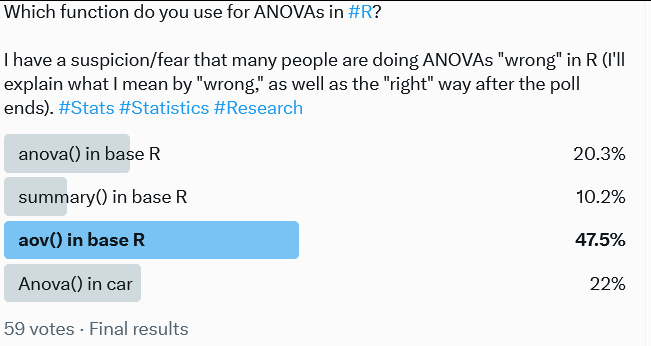
4 Nov 2024
The informal poll results are in, & as I feared, most people are running ANOVAs in #R with functions that can give highly misleading (or flat out wrong) results. Follow along to see why using anova() and aov() is usually inadvisable & why you should be using car::Anova() 🧵
13
191
929
155,653