
9 Nov 2025
Nyquist Plot – Control System Stability Explained! 🎯⚙️
🔗 forumelectrical.com/what-is-…
Topic: Nyquist Plot – Visualizing Control System Stability in Frequency Domain 📉🔄
The Nyquist Plot is a graphical representation used in control systems to assess the stability of closed-loop systems based on their open-loop frequency response. It plots the complex gain of a system as frequency varies, helping engineers determine phase margin, gain margin, and overall stability.
This analysis method is vital in:
✅ Predicting system stability without solving characteristic equations
✅ Analyzing feedback control loops
✅ Designing stable control systems in automation and power electronics
🎯 Perfect for students and professionals learning control theory, feedback design, and system analysis.
📖 Read the full article here:
forumelectrical.com/what-is-…
💬 Have you used Nyquist plots in your projects or studies? Share your thoughts below!
📌 Found this useful? Share it with control engineers, automation enthusiasts, and electrical students.
🔗 Connect and follow us for more control system concepts, quizzes, and tutorials:
👉 Website: 🌐 forumelectrical.com
👉 Facebook: facebook.com/profile.php?id=…
👉 LinkedIn: linkedin.com/showcase/911302…
👉 Twitter (X): x.com/ForumEIectrical
👉 Pinterest: ru.pinterest.com/ForumElectr…
👉 WhatsApp Channel: whatsapp.com/channel/0029VbB…
👉 Telegram Group: t.me/F0rumElectrical
📘 Keep learning. Keep powering ahead.
#ControlSystem #ControlSystems #Electrical #ElectricalEngineering #Automation #Engineering #NyquistPlot #FrequencyResponse #SystemStability #FeedbackControl
#controlsystem #controlsystems
forumelectrical.com/what-is-…
6

23 Jun 2025
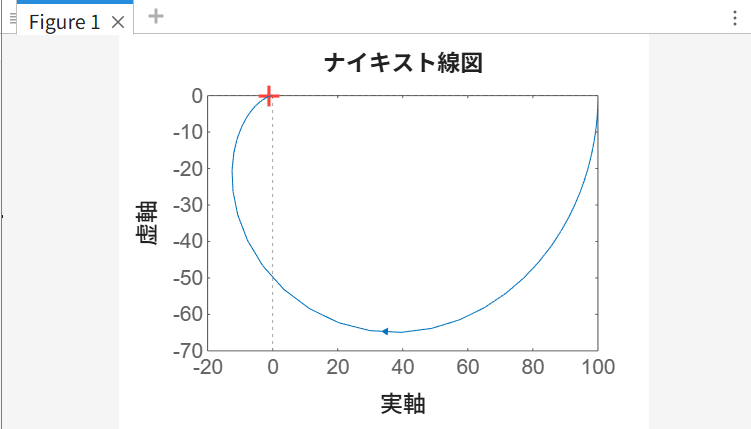
今年のMATLABを使う講義で、nyquist, pzmapの図に対して、daspectで実軸・虚軸を1:1にさせようとしたところ、エラーに。
R2024bから、慣れ親しんだ上記関数の代わりに、pzplot, nyquistplotとかいうコマンドを使う必要がある。
plot、と言われると時間関数を想像するので関数名が違和感・・・(老害?)
9
870

19 Apr 2025
>> sys = tf(100,[1,2,1]);
>> np = nyquistplot(sys);
>> np.ShowNegativeFrequencies = "off";
だといかがでしょうか?
1
2
340

24 Jul 2024
🚀 Just released the 3rd video in our #WarburgImpedance series! 🎥 Learn why linear semi-infinite diffusion shows a 45° line in the #NyquistPlot, combining physico-chemical expressions with electrical circuit elements, and about concentration effects. 📺 youtube.com/watch?v=V-s1gLH8…
1
231
19 Jul 2023
In the fifth video, we measure the #impedance of resistors, capacitors, and a series RC circuit to obtain impedance spectra. Graphical representations (#Nyquistplot and #Bodeplot) and equations for these elements and circuits are introduced.(6/8)
📺youtube.com/watch?v=nnXLp6sJ…
1
2
91

28 Dec 2022
Shout out to Bode plots ⚡️
#bodeplot #nyquistplot #electrochemicalimpedancespectroscopy
youtu.be/yn9ypACptGI
1
5
485

9 Aug 2021
Nyquist diagram, Phase- and Gain-margin on TI-30X/36X Pro calculators
youtu.be/VXQOsHH371I
via @YouTube @TICalculators #NyquistPlot #ControlTheory #NumericalSolver
28 Jul 2021
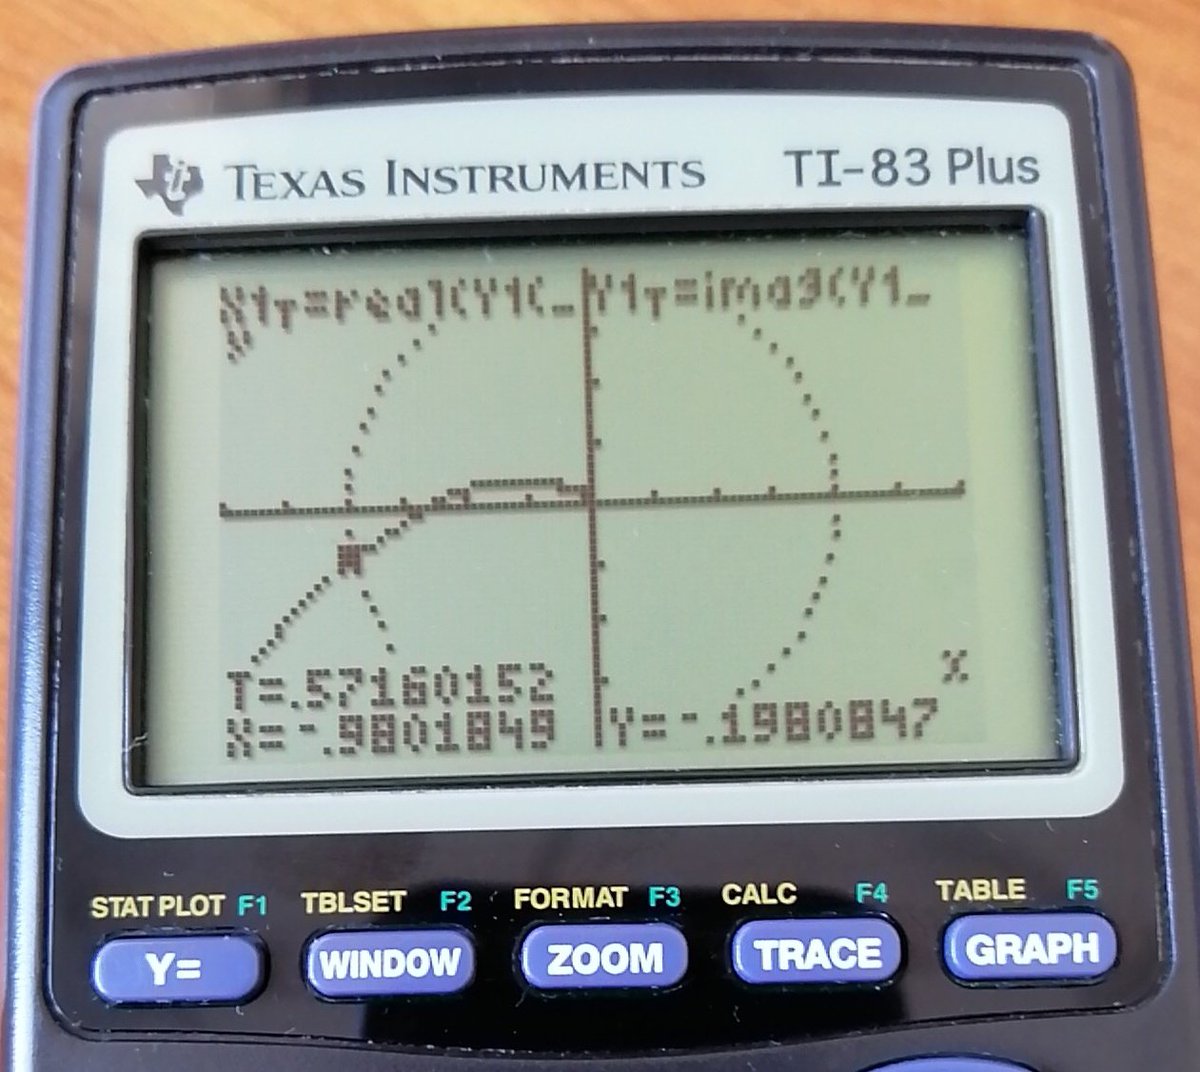
#NyquistPlot on my #TI83Calculator Marked Gain=1 point on the curve.
Thanks for lots of plot types and numerical solver, easy to produce solutions for higher education problems also. Thanks, @TICalculators 👍😊
1
12 Oct 2020
What would a polar plot or a Nyquist plot of an undamped second order system look like? electronics.stackexchange.co… #nyquistplot

30 Jun 2020
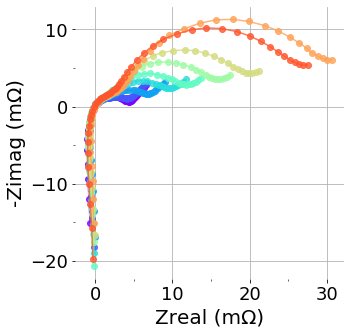
Today marks the last day of #GayPride2020 🌈. At ReJoule we want to show our support through our #battery #nyquistplot showing the effects of accelerated aging. We respect and honor people from all walks of life. We are all unique. We are all valid.
#WeAreAllInThisTogether
4

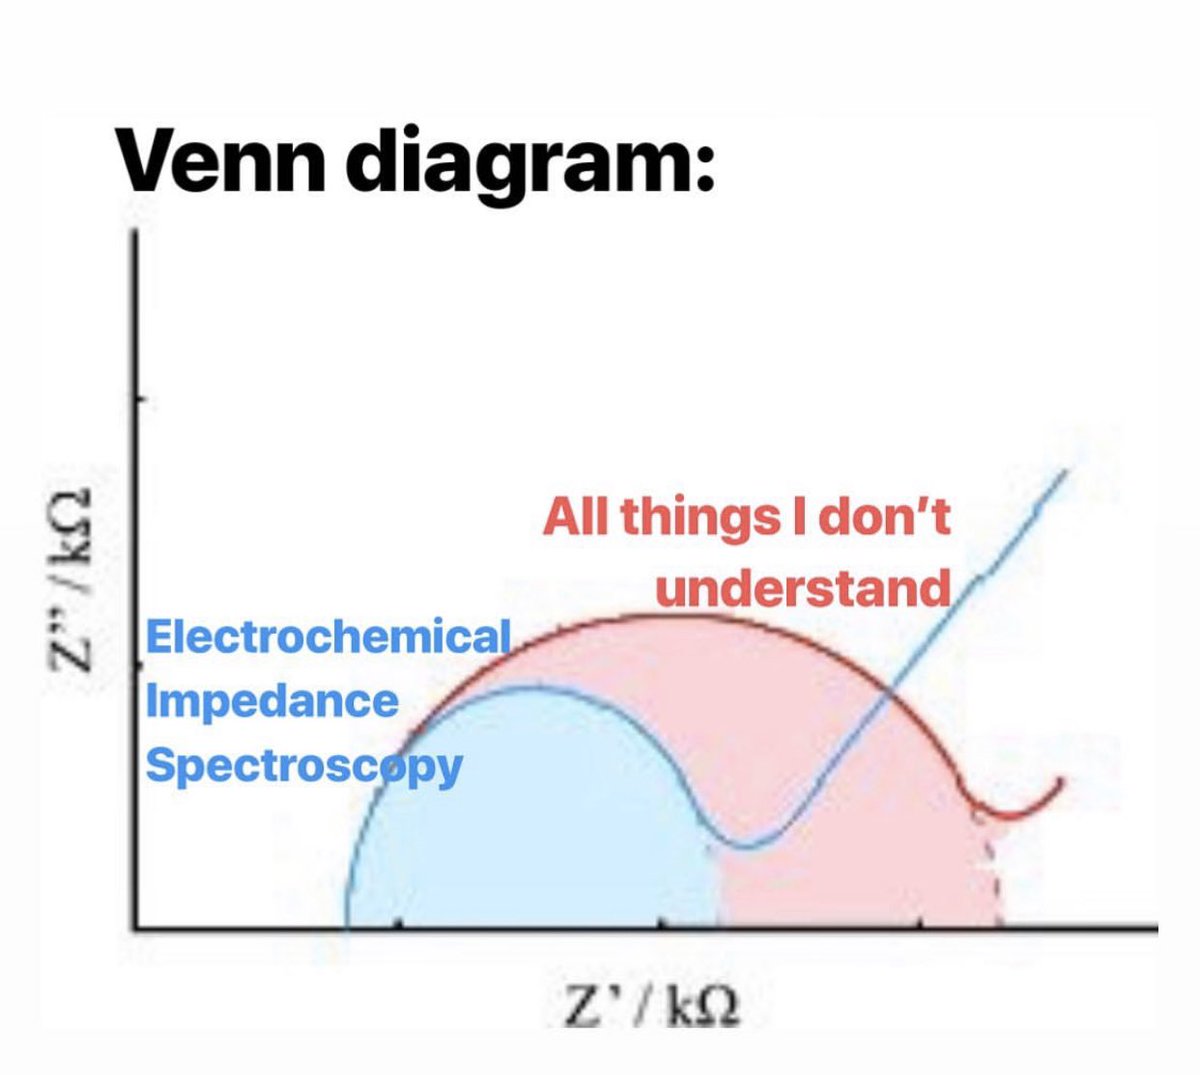
18 Nov 2019
I too am frequently perturbed by EIS.... #Electrochemistry #Impedance #ImpedanceSpectroscopy #NyquistPlot #BodePlot #Batteries #Sciencememes #Batterychat #AcademicTwitter
6

21 Sep 2019
See how a #Nyquistplot provides a straightforward method of determining if an #amplifier will oscillate. ow.ly/2xCF30poUip
2
3
3 May 2019
Is the book wrong about the Nyquist Sampling Criterion? electronics.stackexchange.co… #nyquistplot
1

21 Jan 2019
1

24 Jun 2018
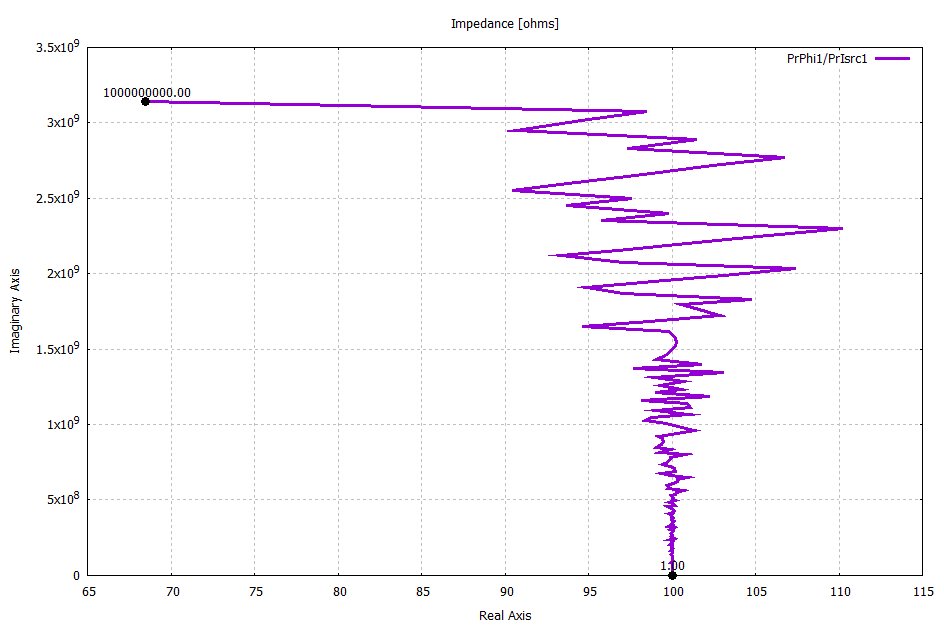
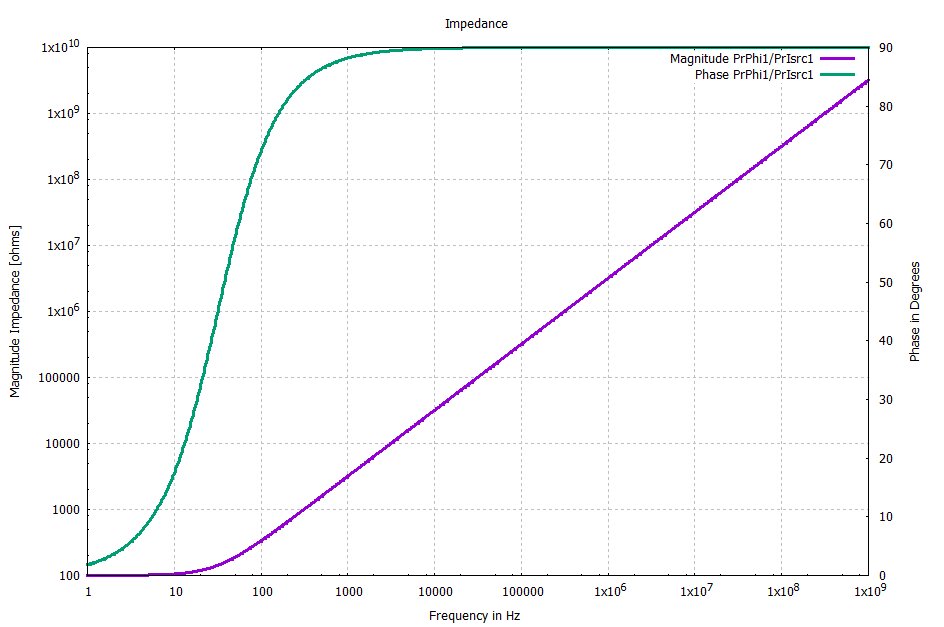
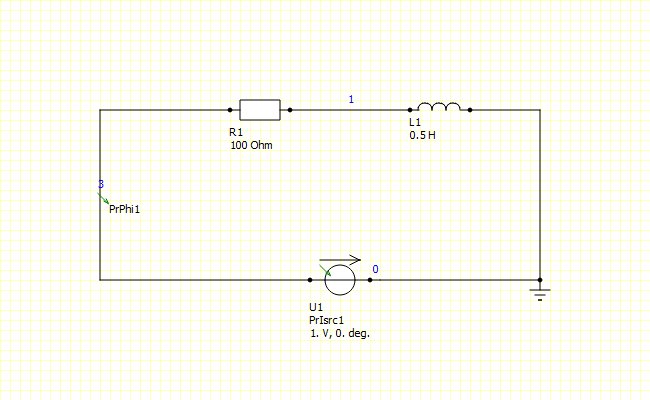
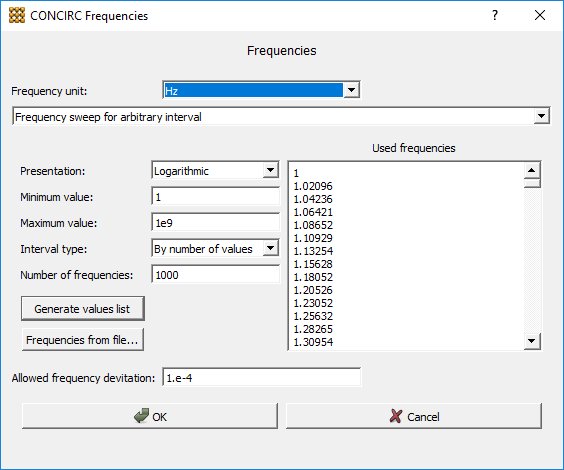
Interessanter Effekt im #Schaltungssimulator #CONCIRC: Bei großen Impedanzen gibt es bei der Darstellung der #Impedanzortskurve starkes numerisches Rauschen, im #Bodediagramm tritt das Problem dagegen nicht auf!
#Ortskurve #Nyquistdiagramm #Nyquistplot #Bodeplot #Gleitkomma
1


24 Jul 2012
Frequency response plots for transfer functions: g = (s 1)/(s^2 2); {BodePlot[g], NyquistPlot[g], NicholsPlot[g]}. j.mp/MRLWOX
2