
If you build with or evaluate LLMs, my new post is for you.
Tokenization sounds like a boring preprocessing detail. In practice it decides what a model can do, how much it costs to run, and why it fails on tasks you'd expect it to handle.
The post covers, with code and real numbers:
→ Why vocabulary size is a real design decision (32K → 128K → 256K)
→ How much of a model is just the embedding table (31% of GPT-2, ~7% of a 7B)
→ Weight tying: which models share the embedding and LM head, and which don't
→ Why multilingual cost varies so much per language
→ Why you can't swap a tokenizer without retraining from scratch
There's a companion Kaggle notebook so you can check every number yourself.
Part 3 of my genAI Fundamentals series.
Link: buff.ly/Zm5udFW
10

A lens is not a tiny GPU, but it is a surprisingly powerful analog operator. In Fourier optics, propagation and a lens map spatial frequencies into positions; a metasurface can then encode phase, amplitude, and polarization at sub-wavelength scale. That makes metalenses and D2NNs strongest not as general AI accelerators, but as sensor-side optical preprocessing: fixed transforms, filtering, compression, and feature extraction before photons ever become pixels. The hard part is not the concept. It is system economics: optical efficiency, SNR, color/field-of-view, fabrication tolerance, alignment drift, detector readout, and whether the saved electronic work beats a CMOS sensor plus a small NPU. For optical computing, this is the clean mental model: free-space diffractive systems move stable, repetitive parts of inference into physics; electronics still handle nonlinearity, adaptation, and software updates. The real wedge is edge vision, microscopy, spectral/polarization sensing, and perhaps CPO package optics - not replacing GPUs outright.
Key refs: doi.org/10.1038/srep27628 ; doi.org/10.1126/science.aat8… ; doi.org/10.1038/s41467-024-4…
#OpticalComputing #SiliconPhotonics #AI #Metasurfaces

7

🚨 🏠 AI Project #1: House Price Prediction App
Building a House Price Prediction App is one of the best beginner AI projects because it teaches you the complete Machine Learning workflow from data collection to deployment.
🎯 Project Goal
Create an AI application that predicts the price of a house based on features such as:
✅ Area (Square Feet)
✅ Number of Bedrooms
✅ Number of Bathrooms
✅ Location
✅ Age of Property
✅ Parking Availability
🧠 What You Will Learn
Python Fundamentals: Variables, Functions, Loops, Conditional Statements
Data Analysis: Pandas, NumPy
Data Visualization: Matplotlib, Seaborn
Machine Learning: Linear Regression, Model Evaluation, Feature Engineering
Deployment: Streamlit
📊 Step 1: Understand the Dataset
A typical dataset looks like this:
Area | Bedrooms | Bathrooms | Age | Price
1200 | 2 | 2 | 10 | 45 Lakh
1800 | 3 | 3 | 5 | 75 Lakh
2500 | 4 | 4 | 2 | 1.2 Cr
Input Features: These are independent variables
Area, Bedrooms, Bathrooms, Age
Target Variable: This is what we want to predict
👉 Price
📂 Step 2: Load the Dataset
import pandas as pd
data = pd.read_csv("house_data.csv")
print(data.head())
Why? This loads the dataset into a DataFrame for analysis.
🔍 Step 3: Explore the Data
Check: `data.info()`
Check missing values: `data.isnull().sum()`
Check statistics: `data.describe()`
Goal: Understand data types, missing values, outliers, data distribution
📈 Step 4: Visualize the Data
Relationship between Area and Price:
import matplotlib.pyplot as plt
plt.scatter(data["Area"], data["Price"])
plt.xlabel("Area")
plt.ylabel("Price")
plt.show()
Observation: Generally 📈 Larger houses → Higher prices
🧹 Step 5: Data Preprocessing
Separate Features and Target
X = data[["Area","Bedrooms","Bathrooms","Age"]]
y = data["Price"]
Train-Test Split
from sklearn.model_selection import train_test_split
X_train,X_test,y_train,y_test = train_test_split(
X, y, test_size=0.2, random_state=42
)
🤖 Step 6: Train the AI Model
Use Linear Regression
from sklearn.linear_model import LinearRegression
model = LinearRegression()
model.fit(X_train,y_train)
What Happens Here? The model learns area impact on price, bedroom impact on price, bathroom impact on price, age impact on price
📉 Step 7: Make Predictions
predictions = model.predict(X_test)
print(predictions[:5])
The model now predicts house prices for unseen houses.
📏 Step 8: Evaluate Performance
from sklearn.metrics import mean_absolute_error
mae = mean_absolute_error(y_test,predictions)
print(mae)
Common Metrics:
✅ MAE,
✅ MSE,
✅ RMSE,
✅ R² Score
🎨 Step 9: Build a Streamlit App
Install: `pip install streamlit`
Create app.py
import streamlit as st
area = st.number_input("Area")
bedrooms = st.number_input("Bedrooms")
bathrooms = st.number_input("Bathrooms")
age = st.number_input("Age")
if st.button("Predict"):
result = model.predict([[area,bedrooms,bathrooms,age]])
st.success(f"Predicted Price: {result[0]}")
🚀 Step 10: Run the Application
`streamlit run app.py`
Now users can:
✅ Enter house details,
✅ Click Predict,
✅ Get AI-generated price estimates
⭐ Extra Features to Add
Beginner Level:
✅ Price Prediction,
✅ Clean UI,
✅ Charts
Intermediate Level:
✅ Location-based pricing,
✅ Property comparison,
✅ Download reports
Advanced Level:
✅ Map integration,
✅ Multiple ML models,
✅ AI recommendations,
✅ Real estate analytics dashboard
📂 Project Structure
house-price-prediction/
│
├── data/
├── models/
├── notebooks/
├── screenshots/
├── app.py
├── train.py
├── requirements.txt
├── README.md
└── house_data.csv
💼 Resume Project Description
House Price Prediction App
Developed an end-to-end Machine Learning application using Python, Pandas, Scikit-learn, and Streamlit to predict real estate prices based on property features. Performed data preprocessing, model training, evaluation, and deployed an interactive web application for real-time predictions.
🎯 Mini Challenge
Before moving to the next project, try these improvements:
1. Add Location as a feature
2. Compare Linear Regression vs Random Forest
3. Display prediction confidence
4. Deploy the app online
5. Upload the project to GitHub with screenshots and documentation
🔥 Double Tap ❤️ For Part-2
3
5
915

More Than Just an Answer with Reasoning: Introduction of Grounding Technologies for Multimodal Large Language Models
🧠How can AI not only answer questions—but also clearly show where the answer comes from? In this TechBlog, researchers from Fujitsu Research & Development Center in China introduce introduce new grounding technologies for Multimodal Large Language Models (MLLMs), focused on improving explainability in Visual Question Answering (VQA).
🔍 Why grounding matters
While existing MLLMs can generate answers and reasoning, it often remains unclear which parts of an image the answer is based on—especially for document images such as charts, tables, and posters. Grounding addresses this gap by localizing related image regions that support model outputs.
📌 Two grounding approaches
・Conclusion-grounded model:Uses a joint Supervised Fine-Tuning (SFT) Reinforcement Learning (RL) strategy to localize answer-related areas, achieving higher VQA accuracy and grounding accuracy on public benchmarks such as ChartQA, DocVQA, and DORG.
・Thinking-grounded model:With OCR-based preprocessing, the model localizes all relevant information used during the reasoning process, making model decisions easier to understand in document-centric VQA tasks.
👉 Read the full TechBlog here:
EN: blog-en.fltech.dev/entry/202…
JP: blog.fltech.dev/entry/2026/0…
#MultimodalAI #MLLM #ExplainableAI #Grounding #VQA
42

Logistic regression is a statistical method used to model the probability of a binary outcome, such as success or failure, yes or no, or presence or absence of a condition. Instead of predicting a continuous value like linear regression, it predicts a probability between 0 and 1 by applying a transformation called the logistic (or sigmoid) function. This function takes a linear combination of input variables and maps it into a probability, allowing us to interpret how likely an event is to occur. The model estimates coefficients for each predictor, which indicate how changes in those variables affect the log-odds of the outcome.
One of the main strengths of logistic regression is its interpretability. Each coefficient can be understood in terms of how it increases or decreases the likelihood of the outcome, holding other variables constant. It is widely used in fields like medicine, economics, and social sciences for classification problems, such as predicting disease risk or customer behavior. While it assumes a linear relationship between predictors and the log-odds, it can still perform well in many practical situations, especially when combined with proper feature selection and data preprocessing.
4
16
840


AI/ML models are only as good as the data they're trained on. Don't underestimate the importance of data quality and preprocessing in your machine learning projects.
3
msi open joki IT‼️
• data analyst
• data cleaning & preprocessing (python)
• dashboard
• Excel, SQL
• machine learning
• data visualization
• flowchart & diagram
• fixing error coding/data
• dan lainnya
testi ada di pinned ya #zonauang
175

"Machine Learning Foundations, Volume 1: Supervised Learning" - available at amzn.to/4syhPal
Benefits:
Master the key concepts of supervised machine learning, including model capacity, the bias-variance tradeoff, generalization, and optimization techniques
Implement the full supervised learning pipeline, from data preprocessing and feature engineering to model selection, training, and evaluation
Understand key learning tasks, including classification, regression, multi-label, and multi-output problems
Implement foundational algorithms from scratch, including linear and logistic regression, decision trees, gradient boosting, and SVMs
Gain hands-on experience with industry-standard tools such as Scikit-Learn, XGBoost, and NLTK
Refine and optimize your models using techniques such as hyperparameter tuning, cross-validation, and calibration
Work with diverse data types, including tabular data, text, and images
Address real-world challenges such as imbalanced datasets, missing data, and high-dimensional inputs
1
6
50
2,045

It's a full training coordinator. One message kicks off:
→ Autonomous dataset discovery on Kaggle
→ Feature selection data preprocessing
→ Architecture matching (classification vs regression)
→ Job queuing on-chain execution
→ Model NFT minted to your wallet
1
19


$linearFill interpolates missing values in time-series data linearly.
Sensor went offline? MongoDB fills the gap.
No application-side interpolation. No preprocessing step.
Clean time-series data directly from the aggregation pipeline.
#MongoDB #DataEngineering
1
19

Running messy business data through Claude before visualization is genuinely underrated. I spend significantly less time on dataset cleanup when AI handles the preprocessing. My entire data analysis framework follows this principle: AI manages the grunt work while humans focus on strategic interpretation. The efficiency gains have been substantial.
1
24
yuu open joki IT‼️
• data analyst
• data cleaning & preprocessing (python)
• dashboard
• Excel, SQL
• machine learning
• data visualization
• flowchart & diagram
• fixing error coding/data
• dan lainnya
testi ada di pinned ya #zonauang
220

EVERY AI VOICE STARTUP SHOULD BE NERVOUS.
A tiny open-source model just did what most thought required the cloud.
Supertonic runs entirely on-device.
No API.
No subscriptions.
No latency.
No sending your data to someone else's servers.
And the numbers are absurd:
→ 66M parameters
→ Up to 167× faster than real-time
→ 1,200 chars/sec on consumer hardware
→ Runs on Raspberry Pi, browsers, phones, and even e-readers
→ Handles dates, currencies, phone numbers, and technical text without messy preprocessing
For years, the tradeoff was simple:
Cloud TTS = quality
Local TTS = compromise
Supertonic just broke that equation.
Open source is coming for every AI API business.
GitHub:
github.com/supertone-inc/sup…
h/t @Supertone_AI

5
2
51
3,592

Jun 14
The aging biomarker field has a measurement problem that nobody talks about. Over the past decade, we've accumulated dozens of epigenetic clocks, each trained on different cohorts, different preprocessing pipelines, different endpoints. Horvath, GrimAge, PhenoAge, DunedinPACE. All claim to measure biological age. But because none were ever tested head to head on the same dataset, the honest answer to "which one works best" has been: we don't actually know.
The Biomarkers of Aging Challenge, now published in Nature Aging, took the same approach that transformed protein structure prediction. CASP gave us AlphaFold. This challenge gives aging measurement its first real benchmarking arena. Five hundred individuals, ages 18 to 99, DNA methylation profiles paired with real health outcomes, all run through a single standardized platform. Open to anyone. The winning models identified novel methylation signatures and outperformed existing biomarkers by combining advanced machine learning with biological domain knowledge that no single lab would have deployed alone.
The question that matters most in longevity science right now isn't whether we can measure aging. It's whether we can agree on how to measure it. This is the infrastructure that makes agreement possible. 🧬
pubmed.ncbi.nlm.nih.gov/4227…
28
Ujjwal Kumar retweeted

Jun 10
Medical imaging data needs more than standard ML preprocessing.
In this guide, Lakshmi shows you how to prepare chest X-rays for machine learning with Python and OpenCV.
You'll validate datasets, catch leakage, scale and normalize images, apply CLAHE, handle missing data, and more.
freecodecamp.org/news/how-to…

1
30
253
10,111

Jun 14
ridii open joki IT‼️
• data analyst
• data cleaning & preprocessing (python)
• dashboard
• Excel, SQL
• machine learning
• data visualization
• flowchart & diagram
• fixing error coding/data
• dan lainnya
testi ada di pinned ya #zonauang
1
1
309

Jun 14
The Golden Rule of preprocessing: Deskew BEFORE you despeckle. Running them out of order distorts the layout profile, corrupts data, and breaks your skew estimates. Always straighten the image before cleaning the noise.
Read our technical deep-dive guide
linkedin.com/pulse/how-de-sk…

2

Jun 14
here is what my preprocessing looks like. the idea is to dynamically size the information in the context window as well as adjusting the content
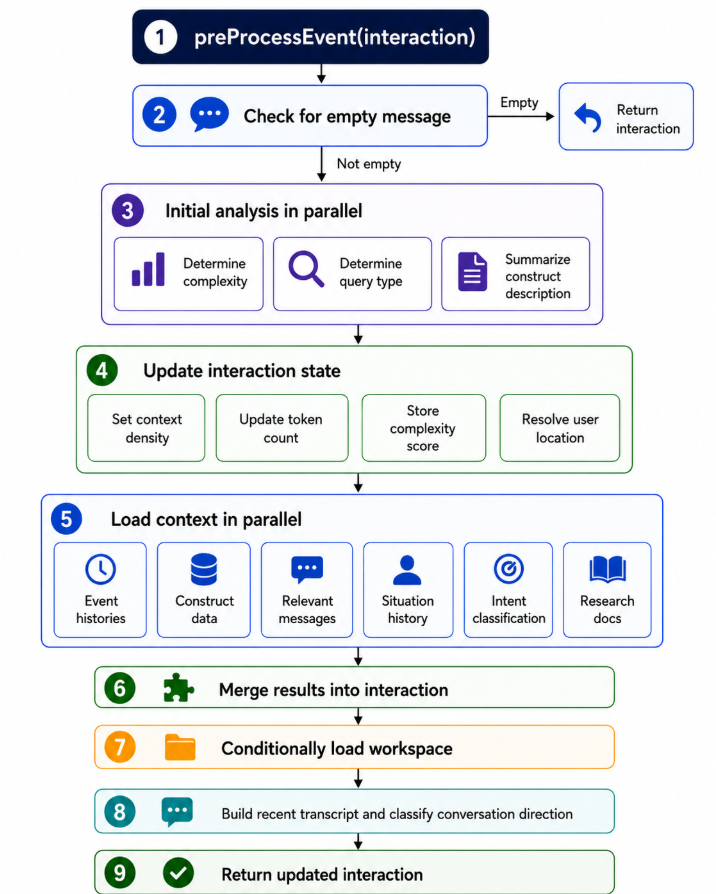
1
12