
Amuses me Farage has used a NUTS 3 (Nomenclature of Territorial Units for Statistics) shapefile for his little map. Which is an official geographic product of Eurostat, the statistical office of the European Union.
1
1
155

@siliguriMC Hello, could you please share the official shapefile for Siliguri municipality, Siliguri Urban Agglomeration, and Siliguri Planning Area, or guide me on how I can get it?
17

Jun 13
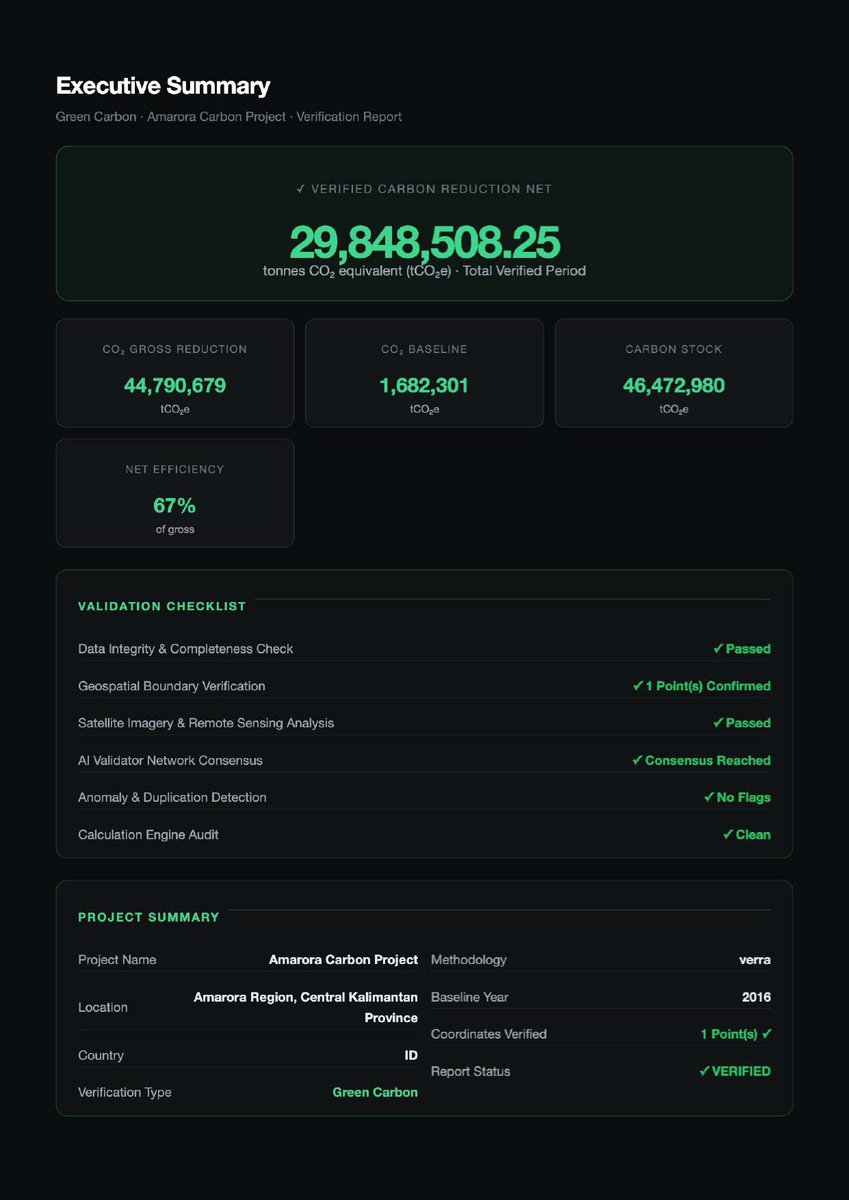
The Amarora Carbon Project Did It. Now It’s Your Turn.
The Amarora Carbon Project validation report is proof of concept. Proof that geospatial dMRV works. Proof that AI can handle complex carbon accounting at scale. Proof that a single project owner with a vision can get verified without a small army of consultants.
But here’s the most important part: Athlas Verity is open to everyone.
Forest project in the Amazon? Yes.
Mangrove restoration in Southeast Asia? Yes.
Soil carbon in the American Midwest? Yes.
Renewable energy in Africa? Yes.
The same engine that verified Amarora’s 93,461 hectares can verify your 500-hectare agroforestry plot. The same AI that computed 29.8 million tCO2e can compute your 10,000 tCO2e. The same transparency that earned buyer trust for Amarora can earn trust for you.
What you need to do:
Go to athlasverity.xyz
1. Create your account (no more free trial, but affordable plans start at $0.25/credit)
2. Upload your project boundary (GeoJSON, KML, or shapefile)
3. Let Athlas Verity run satellite analysis, AI scoring, and report generation
4. Download your verification report – just like Amarora’s
The carbon market is moving toward dMRV. Be on the right side of history.
👉 Start your verification journey at athlasverity.xyz
@AmaroraCarbon @Verra @GoldStandard @ClimateTrade @CarbonDirect @WeAreCarbonCredits @MossEarth @CoolEffect @CarbonBetter @SouthPole_Group
#YourTurn #AmaroraCarbon #VerifyNow #CarbonCredits #dMRV #AthlasVerity #ClimateAction #ProjectVerification #JoinTheMovement #CarbonMarkets


3
30

Do you know how I can get access to my personal divvy data? I know the app tracks it but I wonder if I can get the shapefile
1
725

Jun 11
職場で今日,地形図値上げの話題に。
紙の時代は終わって,データの時代に突入した…ということなのかな。
紙に対してShapefileの売上は好調みたいだし。
28

my sole impression of this guy is once i went looking for Nevada precinct shapefile and stumbled upon the UF Election Lab's precinct map of this guy winning, and i only remember the name

1
37

Jun 10
Sorry but I stole your shapefile from @Leonz0_o I PROMISE it’s for a good purpose. Just see
1
1
23

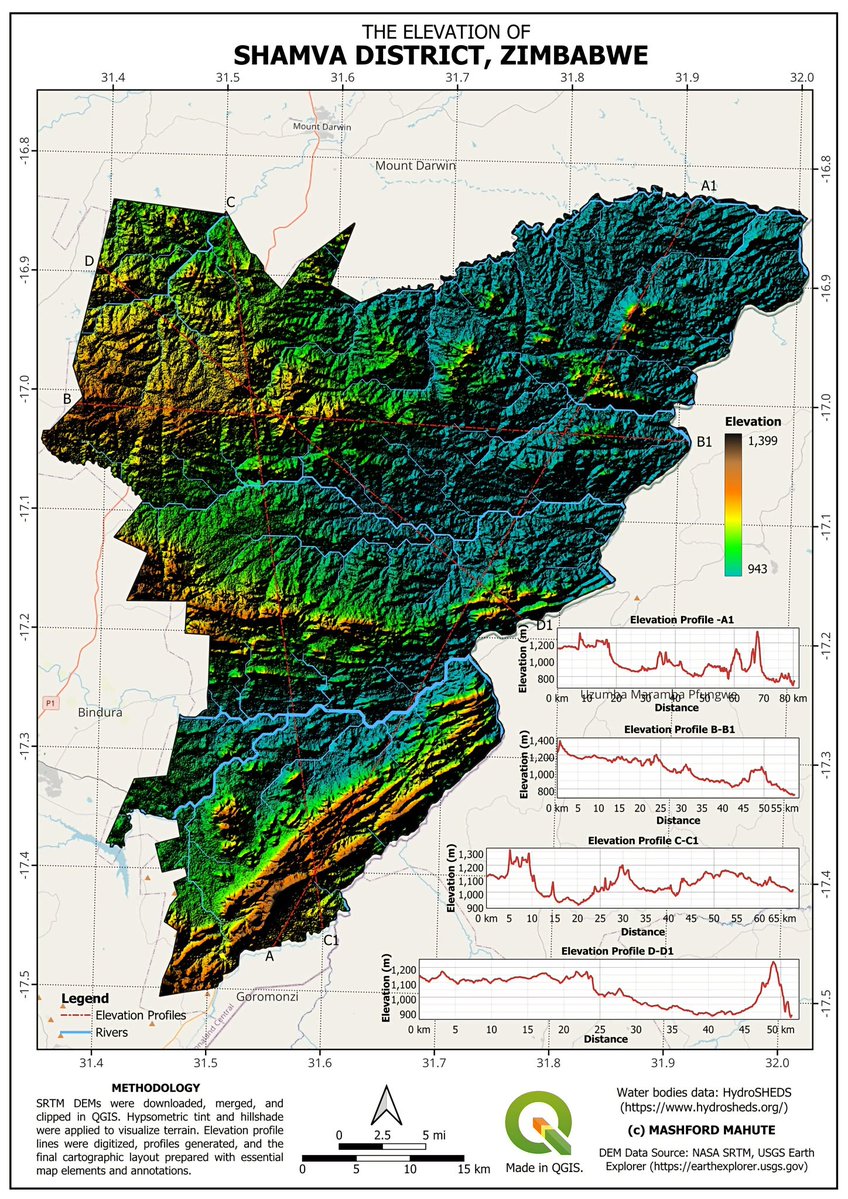
𝗛𝗼𝘄 𝘁𝗼 𝗠𝗮𝗸𝗲 𝗮 𝗠𝗮𝗽 𝗟𝗶𝗸𝗲 𝘁𝗵𝗶𝘀 𝗢𝗻𝗲 𝗶𝗻 𝗤𝗚𝗜𝗦
𝗦𝗧𝗘𝗣 𝟭: 𝗗𝗼𝘄𝗻𝗹𝗼𝗮𝗱 𝗘𝗹𝗲𝘃𝗮𝘁𝗶𝗼𝗻 𝗗𝗮𝘁𝗮
1. Go to 𝗨𝗦𝗚𝗦 𝗘𝗮𝗿𝘁𝗵 𝗘𝘅𝗽𝗹𝗼𝗿𝗲𝗿 (earthexplorer.usgs.gov/).
2. Search for your area of interest.
3. Download 𝗦𝗥𝗧𝗠 𝟭 𝗔𝗿𝗰-𝗦𝗲𝗰𝗼𝗻𝗱 𝗚𝗹𝗼𝗯𝗮𝗹 𝗗𝗘𝗠 tiles covering your region.
𝗦𝗧𝗘𝗣 𝟮: 𝗠𝗲𝗿𝗴𝗲 𝗗𝗘𝗠 𝗧𝗶𝗹𝗲𝘀 (𝗜𝗳 𝗬𝗼𝘂 𝗛𝗮𝘃𝗲 𝗦𝗲𝘃𝗲𝗿𝗮𝗹)
If you downloaded multiple tiles:
1. Open QGIS.
2. Go to 𝗥𝗮𝘀𝘁𝗲𝗿 → 𝗠𝗶𝘀𝗰𝗲𝗹𝗹𝗮𝗻𝗲𝗼𝘂𝘀 → 𝗕𝘂𝗶𝗹𝗱 𝗩𝗶𝗿𝘁𝘂𝗮𝗹 𝗥𝗮𝘀𝘁𝗲𝗿 (𝗩𝗥𝗧).
3. Select all DEM tiles.
4. Click 𝗥𝘂𝗻.
You now have a single seamless DEM.
𝗦𝗧𝗘𝗣 𝟯: 𝗖𝗹𝗶𝗽 𝘁𝗵𝗲 𝗗𝗘𝗠 𝘁𝗼 𝗬𝗼𝘂𝗿 𝗕𝗼𝘂𝗻𝗱𝗮𝗿𝘆
1. Open 𝗣𝗿𝗼𝗰𝗲𝘀𝘀𝗶𝗻𝗴 𝗧𝗼𝗼𝗹𝗯𝗼𝘅.
2. Search for 𝗖𝗹𝗶𝗽 𝗥𝗮𝘀𝘁𝗲𝗿 𝗯𝘆 𝗠𝗮𝘀𝗸 𝗟𝗮𝘆𝗲𝗿.
3. Input layer → Your DEM (or VRT).
4. Mask layer → Your district/region boundary.
5. Click 𝗥𝘂𝗻.
Now you have a clean elevation map for your area.
𝗦𝗧𝗘𝗣 𝟰: 𝗦𝘁𝘆𝗹𝗲 𝘁𝗵𝗲 𝗘𝗹𝗲𝘃𝗮𝘁𝗶𝗼𝗻 (𝗛𝘆𝗽𝘀𝗼𝗺𝗲𝘁𝗿𝗶𝗰 𝗧𝗶𝗻𝘁)
1. Right-click the clipped DEM → 𝗣𝗿𝗼𝗽𝗲𝗿𝘁𝗶𝗲𝘀 → 𝗦𝘆𝗺𝗯𝗼𝗹𝗼𝗴𝘆.
2. Choose 𝗦𝗶𝗻𝗴𝗹𝗲𝗯𝗮𝗻𝗱 𝗽𝘀𝗲𝘂𝗱𝗼𝗰𝗼𝗹𝗼𝗿.
3. Select a color ramp (e.g., green → yellow → brown).
4. Click 𝗖𝗹𝗮𝘀𝘀𝗶𝗳𝘆 → Apply → OK.
This creates the elevation color variati
𝗦𝗧𝗘𝗣 𝟱: 𝗖𝗿𝗲𝗮𝘁𝗲 𝗛𝗶𝗹𝗹𝘀𝗵𝗮𝗱𝗲
1. Open 𝗣𝗿𝗼𝗰𝗲𝘀𝘀𝗶𝗻𝗴 𝗧𝗼𝗼𝗹𝗯𝗼𝘅.
2. Search for 𝗛𝗶𝗹𝗹𝘀𝗵𝗮𝗱𝗲.
3. Input layer → Your clipped DEM.
4. Click 𝗥𝘂𝗻.
𝗦𝗧𝗘𝗣 𝟲: 𝗕𝗹𝗲𝗻𝗱 𝗛𝗶𝗹𝗹𝘀𝗵𝗮𝗱𝗲 𝘄𝗶𝘁𝗵 𝗘𝗹𝗲𝘃𝗮𝘁𝗶𝗼𝗻
1. Right-click the hillshade layer → 𝗣𝗿𝗼𝗽𝗲𝗿𝘁𝗶𝗲𝘀.
2. Under 𝗦𝘆𝗺𝗯𝗼𝗹𝗼𝗴𝘆, change 𝗕𝗹𝗲𝗻𝗱𝗶𝗻𝗴 𝗠𝗼𝗱𝗲 to 𝗠𝘂𝗹𝘁𝗶𝗽𝗹𝘆.
3. Click 𝗔𝗽𝗽𝗹𝘆 → OK.
Now you have realistic terrain relief.
𝗦𝗧𝗘𝗣 𝟳: 𝗖𝗿𝗲𝗮𝘁𝗲 𝗘𝗹𝗲𝘃𝗮𝘁𝗶𝗼𝗻 𝗣𝗿𝗼𝗳𝗶𝗹𝗲 𝗟𝗶𝗻𝗲𝘀
1. Create a new 𝗟𝗶𝗻𝗲 𝗦𝗵𝗮𝗽𝗲𝗳𝗶𝗹𝗲 layer.
2. Digitize straight lines across areas of interest.
3. Style them:
• Red color
• Dashed or dott
• Slightly thicker width
These will be your cross-section lines.
𝗦𝗧𝗘𝗣 𝟴: 𝗚𝗲𝗻𝗲𝗿𝗮𝘁𝗲 𝗘𝗹𝗲𝘃𝗮𝘁𝗶𝗼𝗻 𝗣𝗿𝗼𝗳𝗶𝗹𝗲𝘀
1. Go to 𝗩𝗶𝗲𝘄 → 𝗘𝗹𝗲𝘃𝗮𝘁𝗶𝗼𝗻 𝗣𝗿𝗼𝗳𝗶𝗹𝗲.
2. In the Elevation Profile window:
• Click 𝗔𝗱𝗱 𝗟𝗮𝘆𝗲𝗿𝘀 → Add your DEM.
• Click 𝗖𝗮𝗽𝘁𝘂𝗿𝗲 𝗖𝘂𝗿𝘃𝗲 → Click along one of your profile lines.
3. Under 𝗦𝗲𝘁𝘁𝗶𝗻𝗴𝘀, set 𝗗𝗶𝘀𝘁𝗮𝗻𝗰𝗲 𝗨𝗻𝗶𝘁𝘀 = 𝗞𝗶𝗹𝗼𝗺𝗲𝘁𝗲𝗿𝘀.
Your elevation graph will appear.
𝗦𝗧𝗘𝗣 𝟵: 𝗔𝗱𝗱 𝗣𝗿𝗼𝗳𝗶𝗹𝗲𝘀 𝘁𝗼 𝗣𝗿𝗶𝗻𝘁 𝗟𝗮𝘆𝗼𝘂𝘁
1. Open 𝗣𝗿𝗼𝗷𝗲𝗰𝘁 → 𝗡𝗲𝘄 𝗣𝗿𝗶𝗻𝘁 𝗟𝗮𝘆𝗼𝘂𝘁.
2. Add your main map.
3. Click 𝗔𝗱𝗱 𝗘𝗹𝗲𝘃𝗮𝘁𝗶𝗼𝗻 𝗣𝗿𝗼𝗳𝗶𝗹𝗲 (bottom-left tools).
4. Draw the profile frame.
5. In the right panel → Click 𝗖𝗼𝗽𝘆 𝗙𝗿𝗼𝗺 𝗣𝗿𝗼𝗳𝗶𝗹𝗲.
Repeat for all cross-section lines.
𝗦𝗧𝗘𝗣 𝟭𝟬: 𝗙𝗶𝗻𝗮𝗹 𝗖𝗮𝗿𝘁𝗼𝗴𝗿𝗮𝗽𝗵𝗶𝗰 𝗧𝗼𝘂𝗰𝗵𝗲𝘀
In the Layout, add:
• Grid (with coordinates)
• North arrow
• Scale bar
• Legend
• Title
• Data source
• Credits
• Inset map (optional but professional)
𝗣𝗿𝗼 𝗧𝗶𝗽𝘀
• Use subtle color ramps for a more professional look.
• Keep profile charts consistent in style and scale.
This map is strong work — very portfolio-worthy.
1
1
100

Watch Oceania from space🛰️
We have released one year of ALOS-4 Earth observation data (Apr 1, 2025 – Mar 31, 2026)🌏
📡 All-weather, day-and-night observations by PALSAR-3 (L-band SAR)
▼ Download the data
• Shapefile
• CSV
#disaster #landslide
alos-pasco.com/en/solutions/…

18


Jun 9
Meu, eles n disponibilizam o shapefile dos equipamentos :( Tem como consultar no mapa deles mas n tem como baixar sabe ? estou sofrendo aqui
32
ānucintana retweeted

Jun 9
General advice: just feed a geoJSON or a shapefile to the AI Agent or ask it to find one.

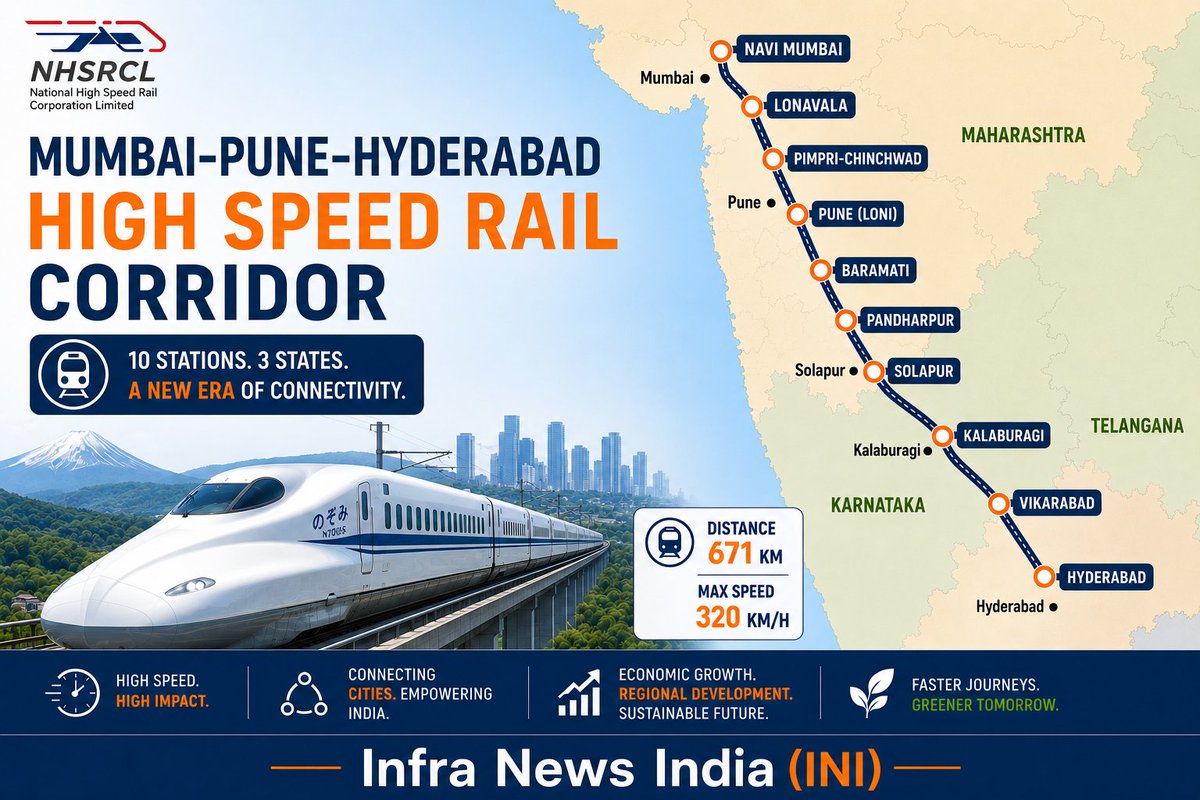
𝐌𝐮𝐦𝐛𝐚𝐢-𝐏𝐮𝐧𝐞-𝐇𝐲𝐝𝐞𝐫𝐚𝐛𝐚𝐝 𝐇𝐢𝐠𝐡 𝐒𝐩𝐞𝐞𝐝 𝐑𝐚𝐢𝐥 (𝐁𝐮𝐥𝐥𝐞𝐭 𝐓𝐫𝐚𝐢𝐧) 𝐩𝐫𝐨𝐣𝐞𝐜𝐭 𝐮𝐩𝐝𝐚𝐭𝐞.
The upcoming Mumbai-Pune-Hyderabad High Speed Rail Corridor will have the following stations:
▪️Navi Mumbai
▪️Lonavala
▪️Pimpri-Chinchwad
▪️Pune (Loni)
▪️Baramati
▪️Pandharpur
▪️Solapur
▪️Kalaburagi
▪️Vikarabad
▪️Hyderabad
As mentioned above, the Pune high speed rail station will be located at Loni, exactly where the bullet train alignment crosses the Pune-Solapur National Highway.
However, metro connectivity to Loni Kalbhor has already been approved by Maharashtra Government (pending Central Government approval), and this will be ready by the time the Mumbai-Pune-Hyderabad High Speed Rail gets going. So reaching the bullet train station from Pune City won't be difficult.
Need the alignment KML file for Mumbai-Pune-Hyderabad High Speed Rail (Bullet Train) project? Get in touch with us today on WhatsApp/Arattai/Telegram: 7588806161.
@nhsrcl @RailMinIndia @CMofKarnataka @TelanganaCMO @revanth_anumula #Mumbai #Pune #Hyderabad #BulletTrain #Maharashtra #Karnataka #Telangana #India #Infra #InfraNewsIndia #INI
3
2
89
4,709

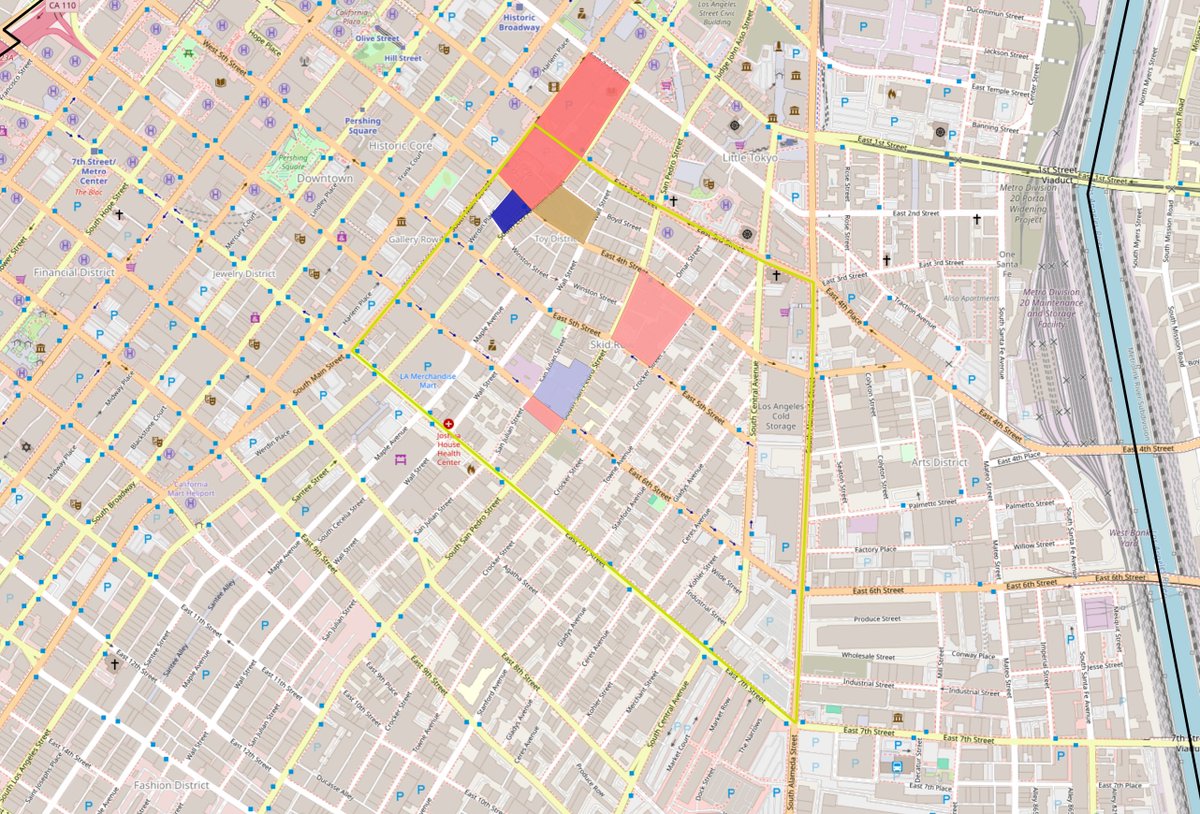
I have the 2022 shapefile and results as of 6/9 on my computer. Unfortunately, I can't find a combined consolidated 2022 precinct shapefile, so the map below looks bare.
Assuming the precincts got consolidated all within the Skid Row area (one peeks out above it), in 2022:
-510 total ballots were counted as having been cast as of 6/9 (Election was 6/7)
-490 votes were recorded for Mayor
-The vote tally was:
Caruso (R) 178
Bass (D) 145
DeLeon (D) 41
Kim 33
Feuer 28
The rest of votes were scattered among minor candidates.
-2026 numbers as of early Wednesday morning are:
-590 total ballots cast outside of the precinct on the far north that crosses into Little Tokyo
-573 total votes were recorded for mayor
-The vote tally was:
Bass (D) 253
Pratt (R) 127
Raman (D) 102
Huang 25
Miller 20
The rest of the votes were scattered among minor candidates
1
77
Of course, there's no pre-certification 2022 Excel file on the Internet Archive, but I found a pdf from June 13:
web.archive.org/web/20220613…
Not sure if it's updated from election day, but it's likely not final, either.
Now, I need to find a 2022 shapefile or pdf map to confirm precinct boundaries and numbers were roughly the same.
1
1
55

Jun 8
Algum estudante de arquitetura já teve q fazer mapa urbano sobre Jundiai? Simplismente não existe shapefile de equipamento urbano disponível dessa cidade e é o que eu mais preciso
1
304
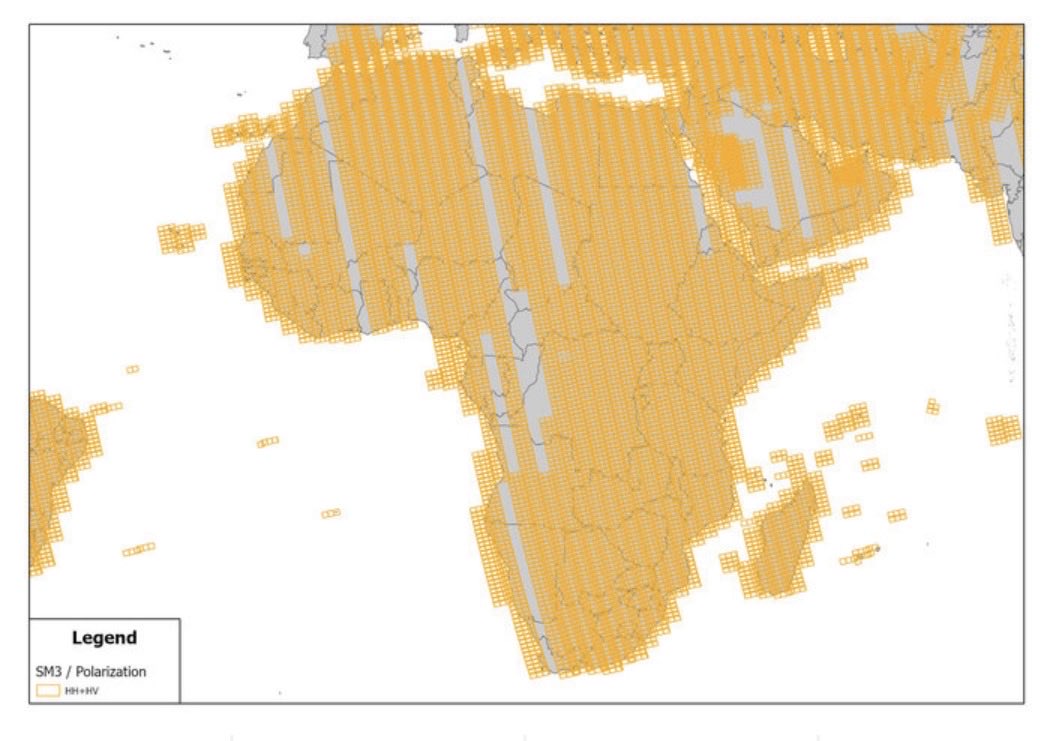
Watch Africa from space🛰️
We have released one year of ALOS-4 Earth observation data (Apr 1, 2025 – Mar 31, 2026)🌏
📡 All-weather, day-and-night observations by PALSAR-3 (L-band SAR)
▼ Download the data
• Shapefile
• CSV
#disaster #landslide
alos-pasco.com/solutions/det…
49

I am planning to make a public utility, I need Shapefile, GeoJSON of Municipalities Boundaries of India (or only Haryana if available). Can someone help me with it?
1
5,154
I am planning to make a public utility, I need Shapefile, GeoJSON of Municipalities Boundaries of India (or only of Haryana if available). Can someone help with it?
1
68