
Maps and politics and stuff. Usually, it's just maps. Disclosure: Conservative Republican. Maps: cinycmaps.com.
Joined April 2017
- Tweets 50,557
- Following 1,017
- Followers 12,351
- Likes 9,807
7,010 Photos and videos


Tutorial on how to make a map using QGIS. I'll turn @SenhorRaposa's 2000 Vermont town data into a map showing by how much Gore outran Senator Jeffords (or vice versa) in every town.
Step 1: Download QGIS for your computer, which is available here:
qgis.org/en/site/forusers/do…
22
46
365
cinyc retweeted

America at 250, Part II - 100 Years In
The 1876 House elections coincided with the contentious election of Rutherford Hayes, who lost the popular vote by 3% while winning the EC by a single vote.
10 years after the Civil War and with Reconstruction coming to an end, Rs gained >30 seats from both significant wins in the Northeast & Midwest, as well as through new seats in the rapidly expanding nation.
Dems made gains in the South as the carpetbaggers departed and black voters began suffering disenfranchisement - the beginning of the Solid South.
Mappers: @MadLibHatter @bluearrowMaps @SageOfTime1 @Thorongil16 @DemHackMaps @JMilesColeman @RJ_maps @cinyc9 @redwoodcntymaps @NinetyDegreeZ @HugeGuilfordCo @tencor_7144 @josh_metcalf @nnjpolitics @Leonz0_o @ModRightMaps


America at 250, Part I - 50 Years In
After the disputed election of 1824 (where John Quincy Adams was elected by the House), the Democratic-Republican party split into the Jacksonian and Anti-Jacksonian parties, after Andrew Jackson, the 1824 runner-up.
The Jacksonians (aka the modern Dem party) were able to gain 9 seats over their rivals, who would soon develop into the Whigs, then the modern Republican party.
Mappers: @MadLibHatter @bluearrowMaps @SageOfTime1 @Thorongil16 @DemHackMaps @JMilesColeman @RJ_maps @cinyc9 @redwoodcntymaps @NinetyDegreeZ @HugeGuilfordCo @tencor_7144 @josh_metcalf @nnjpolitics @Leonz0_o @ModRightMaps

4
8
28
3,749
cinyc retweeted

Jun 13
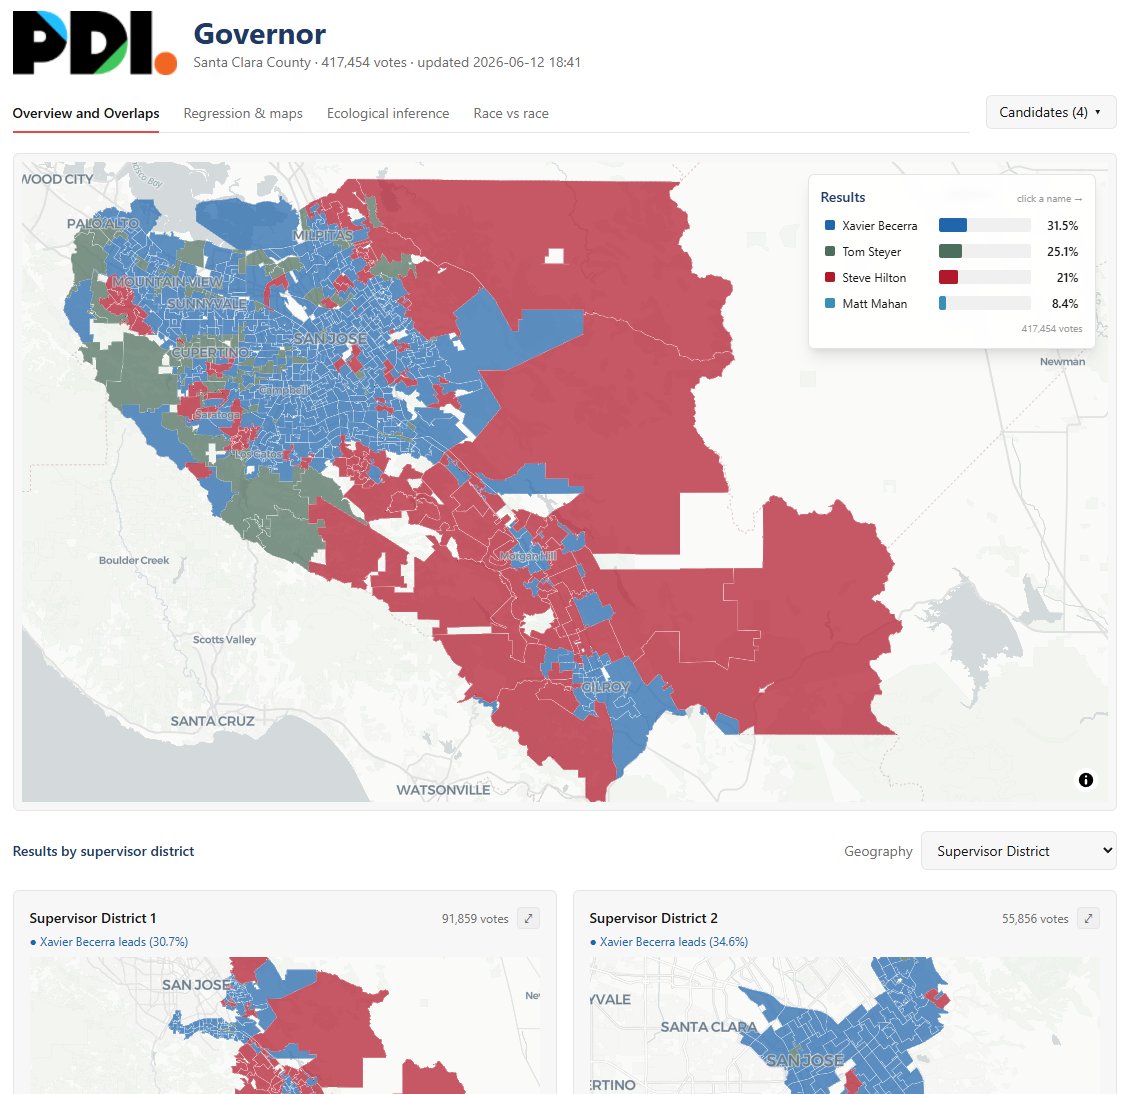
New addition tonight - Santa Clara County.
politicaldata.vote/santa-cla…
You can see the election results by county supervisor, city council, etc... Strong County for @JoshFryday in the Lt Gov race.

Jun 12

🚨Nerd Alert 🚨
Especially for the LA Political Nerds.
politicaldata.vote/
*Please use laptop/desktop, not optimized for phone
This site takes LA County 2026 Primary Election Results, and the @Political_Data records of who voted... and breaks out analysis for EVERY election in LA (except judges) gives you the ability to:
- Visualize precinct maps / winners in a district (and the LA portions of legislative/congressional seats)
- Select sub-geographies (Mayor by council district, Senate by City, City council seat by neighborhood, etc)
- See regression analysis of results by Age, Race, Party and ethnicity, showing correlations or lack thereof.
- Take in the Ecological Inference analysis (viewer beware) which gives a statistical analysis of subgroup voting trends. Read the prompt before digging in, EI can seem strange!
- Run correlations of candidates against each other - like you can see based on precinct-level data just how much was @nithyavraman tied to @TomSteyer or @kennethmejiaLA
While there is a lot of stuff on LA Mayor, this has everything -so you could literally compare governor race to Glendale School board or Long Beach city council, or whatever.
This is all experimental. Hope to build out to other counties as we can get access to the data. This was a lot of work... hope you enjoy!!
Send feedback as I will continue to play around with this.

1
4
22
6,150
cinyc retweeted
This also means we have #CD11 where apparently every precinct was won by either @Scott_Wiener or Connie Chan.
And, yes, Scott won the Castro decisively, with 53% of the vote. And interestingly Scott won all but one Supervisor districts - he even won Chan's seat - but she beat him in Sup Dist 4.


3
5
23
7,005
cinyc retweeted

🚨2026 Primary Election - Early Voting Day 1 Complete!
Manhattan: 7,581
Bronx: 1,448
Brooklyn: 4,111
Queens: 2,949
Staten Island: 413
Total # of Early Voting Check-Ins: 16,502*
*Unofficial as of close of polls
26
141
45,754
cinyc retweeted

Good morning all. Here is my last-ever story for the New Jersey Globe, which is fittingly full of maps.
newjerseyglobe.com/congress/…
8
18
110
7,462
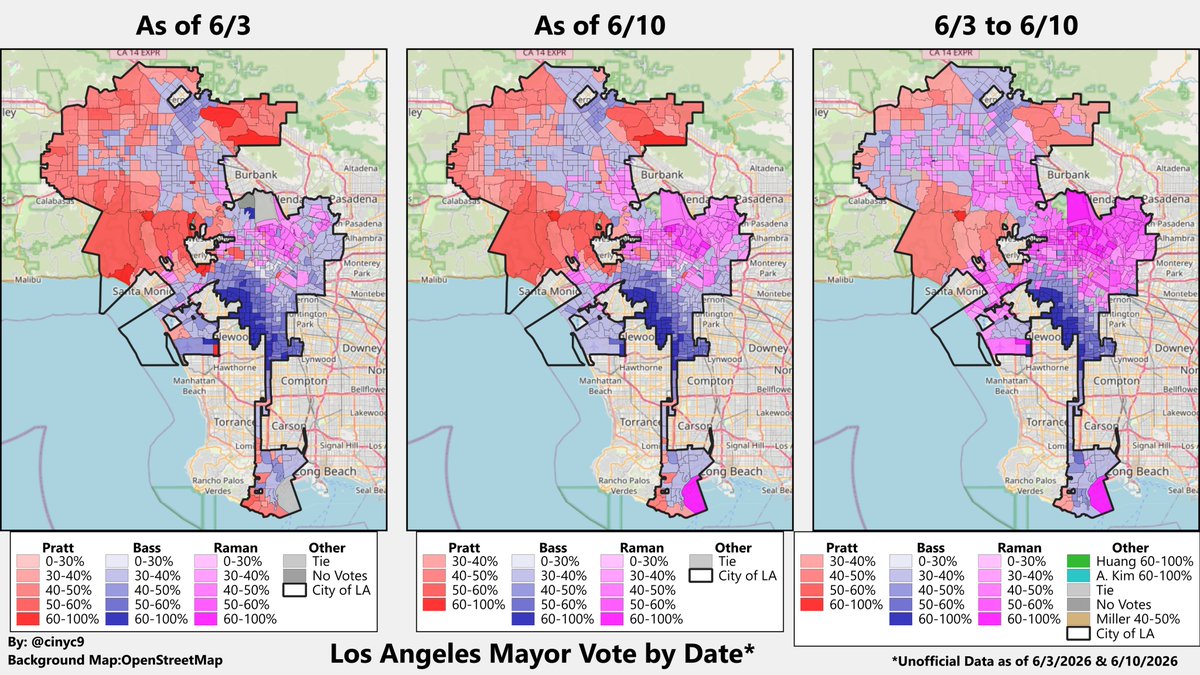
Map of the estimated LA Mayor vote winner by CCD. The map on the left shows the post-election night report, middle as of 6/10 and right the votes counted in between election night and 6/10.
Pratt didn't win any CCD in the post-election night count, but is ahead in 3, 5 & 12.
1
5
16
4,835
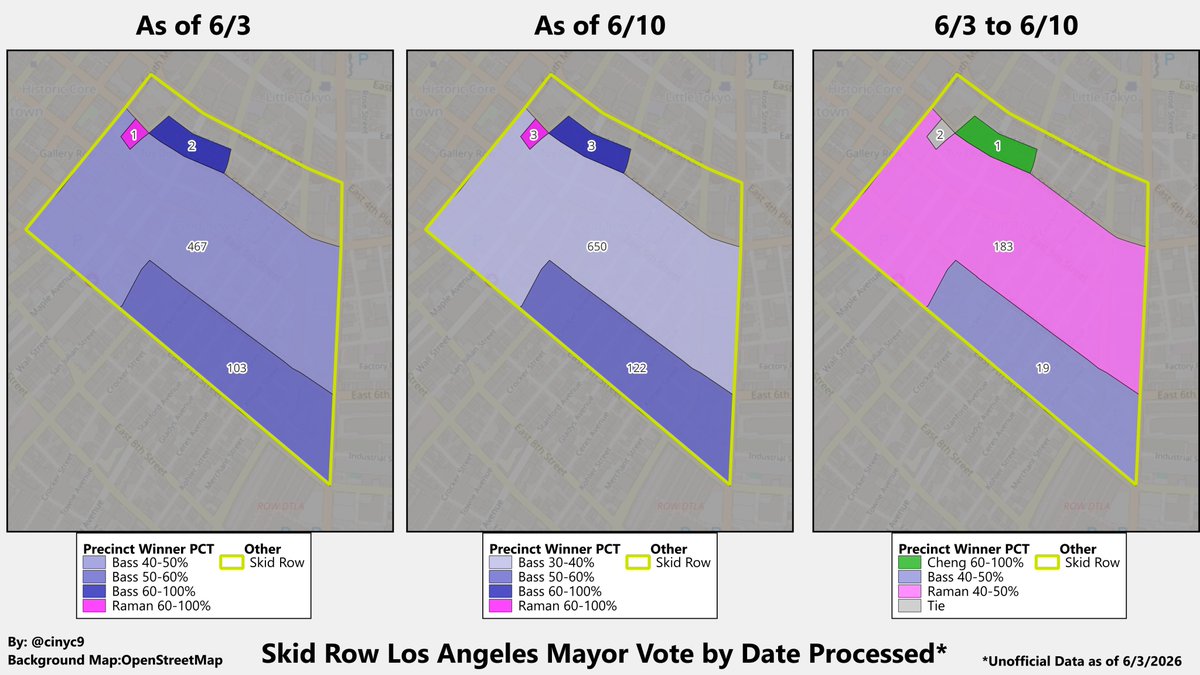
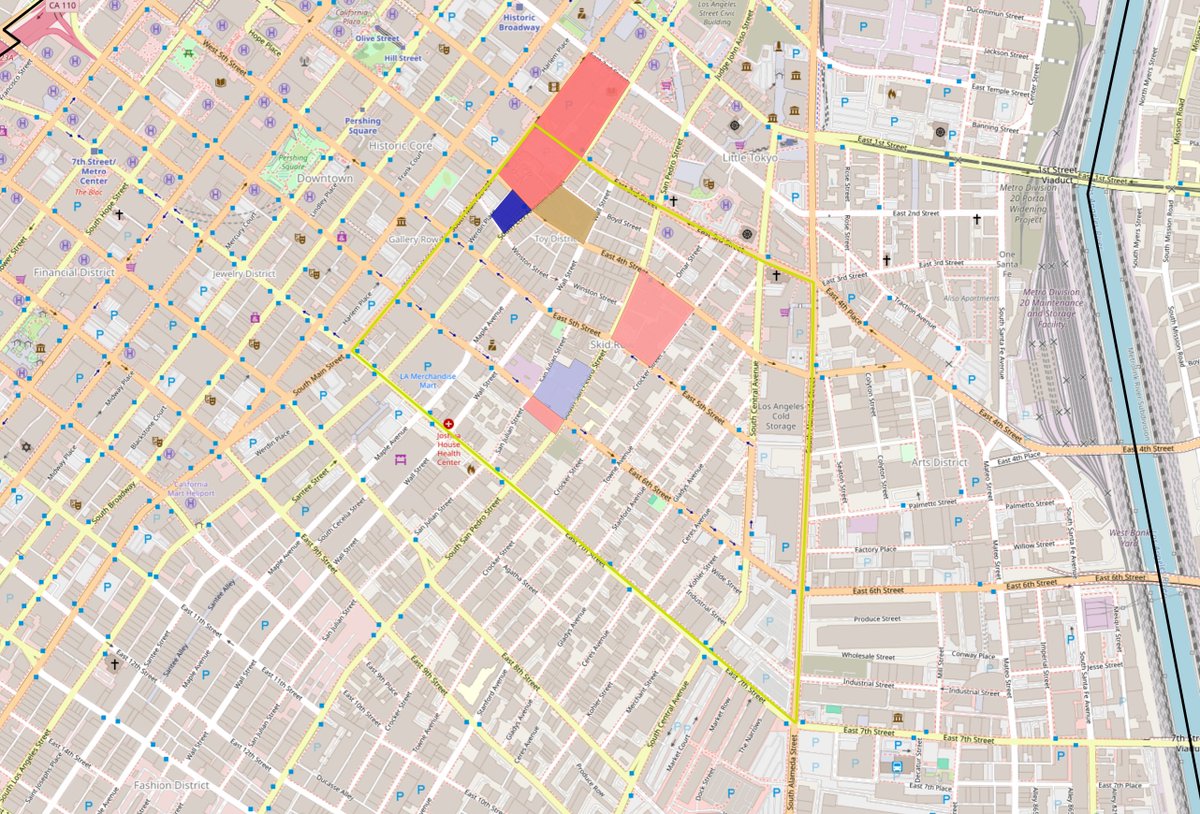
The LA Recorder quietly released new precinct results as of 6/10, so let's map the results, starting with Skid Row and moving out:
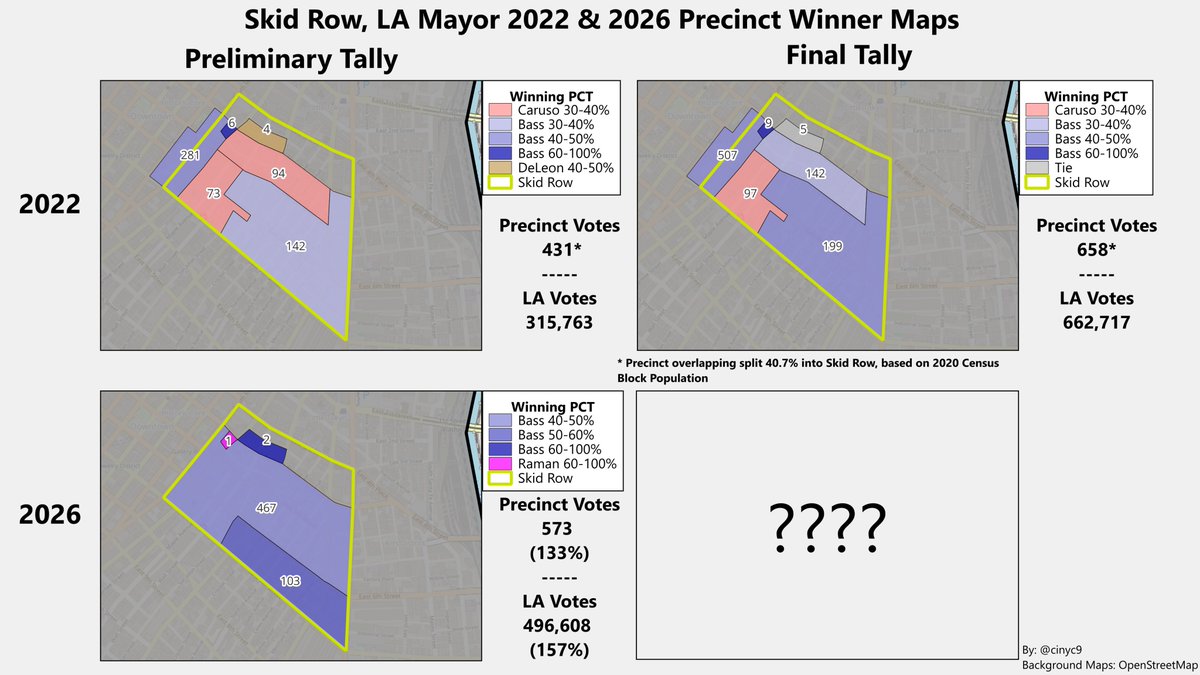
The 6/10 results are unofficial, but probably somewhat close to final, so I've compared them to the final Skid Row Mayoral Results in 2022.
-Skid Row Votes are up 18% compared to 2022 final official
-Overall LA Votes are up 28% compared to 2022 final official
-Bass still won most Skid Row Precincts (I haven't computed the total SR numbers yet)
-Thus, Skid Row's turnout increase is still less than LA's overall, and the number of votes there is very small.
4
10
43
12,841
FYI - @JohnGonzalesLA1 @jesssreva @RyanGirdusky
There are 5,223 registered voters in Skid Row (excluding the Little Tokyo Precinct), according to the 6/3 dataset. There were about 5,068 in 2022, allocating overlap by 2020 block pop. So yes, there are more RVs in the area, too
1
2
406