

29 Sep 2024
This case study can and will help you make an additional $100k MINIMUM this year.
Inside our first month with a client, we increased their incremental revenue by $23k A MONTH with this simple, 2 step process.
Here’s exactly how we did it (with Heatmaps & user session recordings):
Client knew the importance of educating their customers on their pheromone products - and they had a massive bank of information to back up their offer.
But… nearly all their USPs were buried below the fold, which only led to low engagement, low conversions, and less customers.
Our mission was to solve these problems by strategically optimizing their product page, and we aimed to:
- Improve Revenue Per Session
- Increase Conversion Rate
- Enhance the overall user experience
Here are the 2 tests we ran to do it:
Product Page USP-Focused Copywriting Test
As I mentioned above, the majority of their USPs were wayyy below the fold, and a quick scan with heatmap(dot)com told us exactly that.
The solution: We moved the most impactful USPs ABOVE the fold - ensuring that visitors could see this information immediately after loading onto the page
The A/B Test
Using Heatmap(dot)com and AB Testguide, We ran it for 15 days to gather data from these metrics:
Conversion Rate
Revenue/Profit Per Visitor
Overall Revenue Impact
Results:
In less than 3 weeks, here’s what we got:
⠈Monthly incremental revenue increased by $23k
⠈Yearly incremental revenue increased by $282k
⠈Conversion rate increased by 7.09%
⠈Revenue per visitor increased by 6.9%
All from a simple change in the location of the USPs using the data we found from the heatmaps.
Next time you’re looking to optimize your product pages:
Use Heatmaps & user recordings to find the weak links
Make data-driven changes and run an A/B test to confirm those changes made an impact
This simple process is helping a client make another quarter million this year - Let me know below if this helped or will spark an idea for your brand?
3
297

Wir haben uns @skybox Edge mal näher angeschaut!
Sehr interessante Features, die das analytische Game sicherlich auf das nächste Level bringen können!
Seht selbst im @dachcs TestGuide! 📝
30 Mar 2024

Für die Saison haben wir mit @skybox den Partner schlechthin für die perfekte Analyse an Bord 💪
@fREShCS1 stellt euch im Video das Tool und seine zahlreichen Vorzüge vor 👨🏫
1
2
14
940

12 Oct 2023
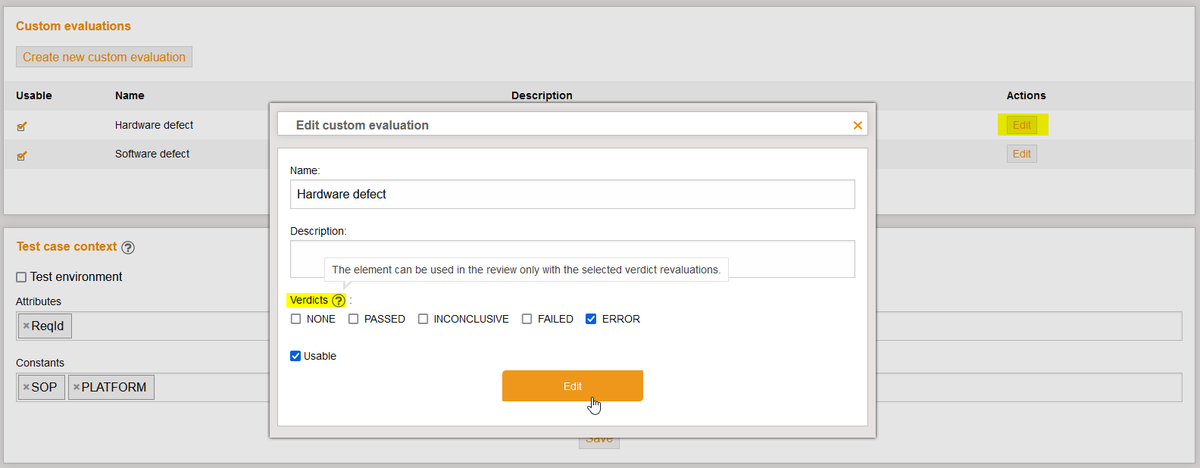
In TEST-GUIDE kannst Du jetzt Issue-Tracker-Links für Ausführungsaufträge hinzufügen. Damit lässt sich der Bearbeitungsstand des Auftrages direkt am (Jira-)Ticket tracken und Du hast den aktuellen Status immer im Blick.
#testguide #featurecheck

ALT Schon gewusst? Unsere TEST-GUIDE Entwicklungs-Teams releasen alle zwei Wochen. Mehr Infos dazu gibt’s hier: https://www.tracetronic.de/produkte/test-guide/
1
104
31 Aug 2023
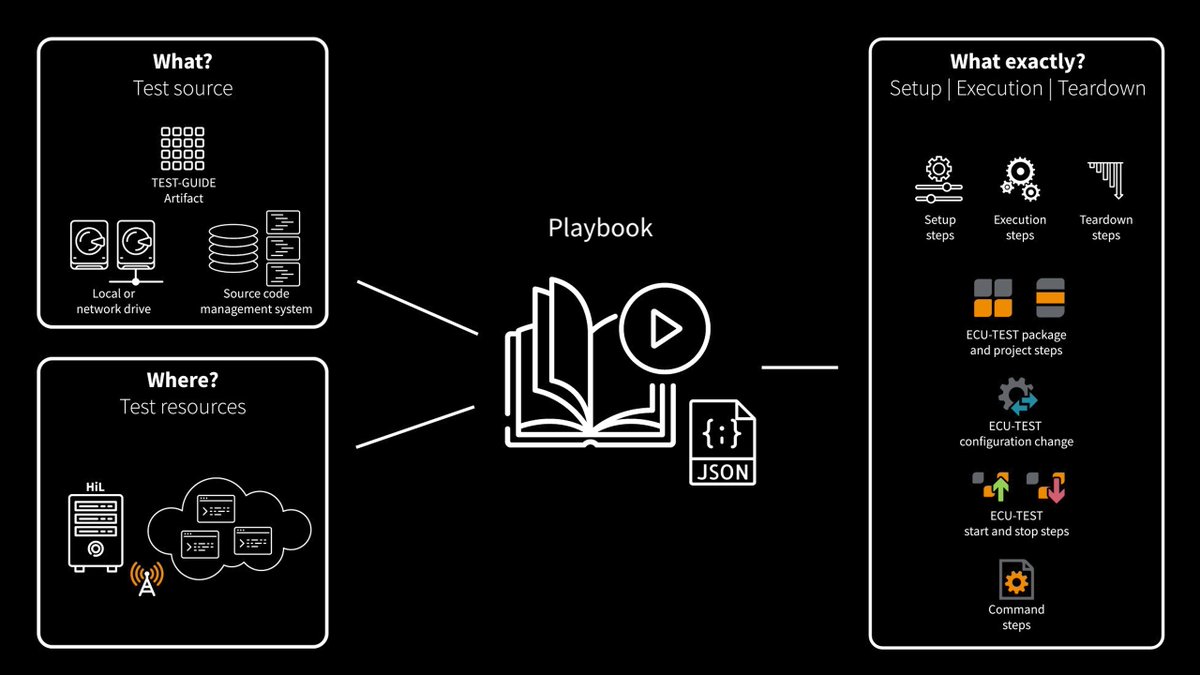
Playbooks gehören inzwischen zu TEST-GUIDE wie Testfall-Packages zu ECU-TEST. Wie man mit #Playbooks arbeitet und sie auf ausführbare Testaufträge verteilt, zeigen wir dir in unserem neuesten #Video.
youtube.com/watch?v=cOYgyr6_…
tracetronic.de/infohub/
#testguide #featurecheck
1
95
5 Jul 2023
SiL-Testing in der Cloud beim 23. Internationalen Stuttgarter Symposium. Gestern und heute mit unseren Kollegen vor Ort. Wer nicht dabei sein kann, der kann sich unsere Produktdemo zu genau diesem Thema anschauen: tracetronic.de/produkte/demo…
#automotive #cloud #ecutest #testguide
1
68
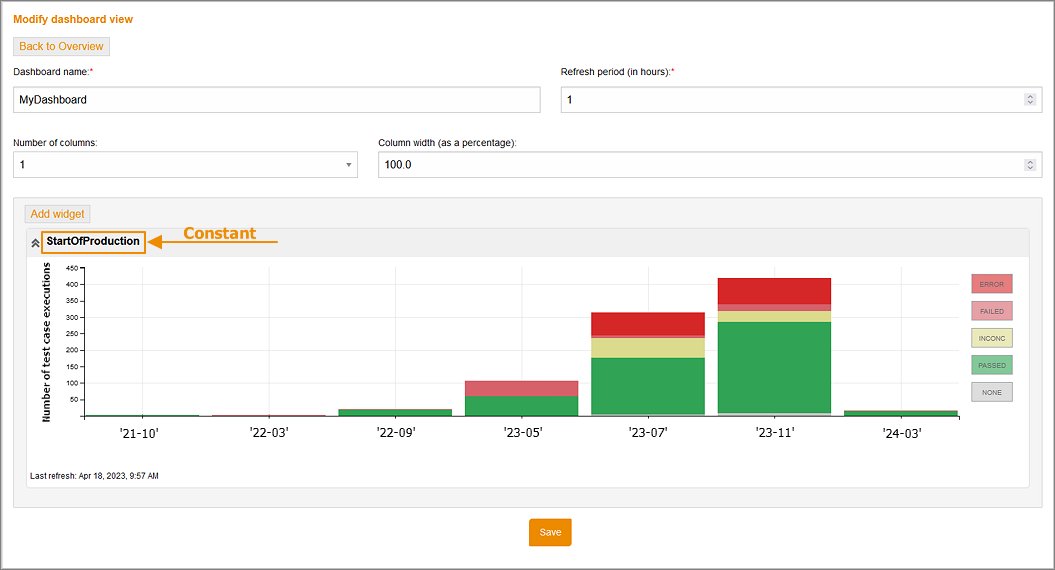
25 May 2023
In TEST-GUIDE haben wir das Widget Balkendiagramm erweitert. Dieses und weitere Highlight-Features gibt’s jetzt kurz und knapp erklärt auf tracetronic.de/infohub/relea…
#testguide #featurecheck
2
60

23 May 2023
🚨 Regression Testing: A definitive Guide
✅ After making modifications to a #SoftwareApplication, it's important to do #RegressionTests to see how the software handles the changes.
Find more in our blog 👉buff.ly/41ZPICU
#SoftwareTesting #QA #TestGuide #Testing

2
110

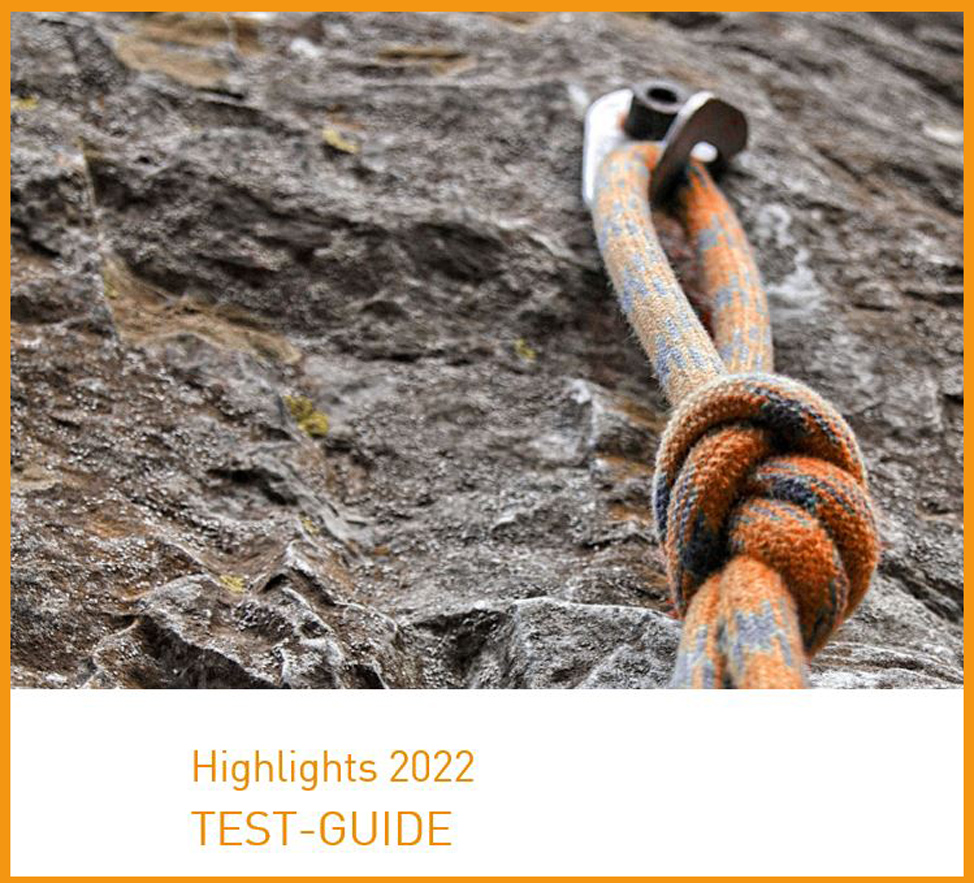
21 Dec 2022
2022 ist viel passiert – auch bei unseren #Software-Tools. Alle Infos zu den TEST-GUIDE Highlights des Jahres gibt’s jetzt im Bereich Info Hub auf tracetronic.de/infohub/
#testguide #featurecheck #softwaredevelopment
2
87
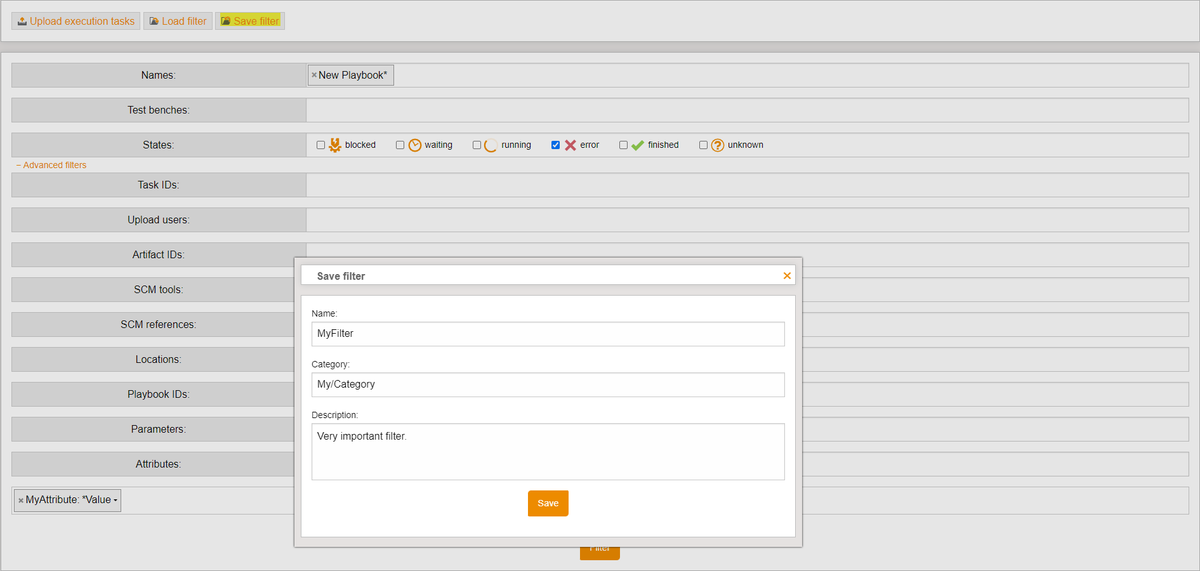
6 Oct 2022
Was gibt’s eigentlich Neues in TEST-GUIDE? Seit kurzem lassen sich Filter für Testaufträge speichern & laden und Abhängigkeiten von Review-Feldern definieren – um mal nur 2 zu nennen. Zum #Changelog: tracetronic.de/produkte/test…
#testguide #featurecheck #softwaredevelopment
1

10 Aug 2022
UPSSSC (PET) Preliminary Eligibility Test Guide (for Group 'C' Posts)
Buy From Here At Lowest Price
Amazon- amazon.in/dp/9354771335
Flipkart- flipkart.com/search?q=978935…
Call 91-011-23261567, 23275124, 23275224
#UPSSSC #PET #PreliminaryEligibility #TestGuide #GroupCPosts
#UPSCExams

2
27 Jun 2022
CLAT : Common Law Admission Test Guide (For Under Graduate Programme)
Buy From Here At Lowest Price
Amazon- amazon.in/dp/9354772099
Flipkart-flipkart.com/search?q=978935…
Visit-rameshpublishinghouse.com/
Call: 91-011-23261567, 23275124, 23275224
#CLAT #CommonLawAdmission #TestGuide #UG

ALT Ramesh Prakashan, Ramesh Career books, Ramesh Career development books, Competitive Exam Books, Civil services/ IAS/ PCS, Bank Clerk/ PO Railway/ Airforce, SSC, Engineering, PMT, Police, MBA/ MCA/ Hotel management, NDA/ CDS, Polytechnic, General Knowledge (GK), B. Ed./ Teacher Intelligent test/ mental ability, CSIR/ UGC,Navodaya Vidyalaya (NVS),Kendraya Vidyalaya (KVS), English speaking Books,NTSE/ STSE
2
21 Jun 2022
200 Plus World Famous Personalities
You Can Easily Buy From Here At Lowest Price
Amazon-amazon.in/dp/9386845040
Flipkart-flipkart.com/search?q=978938…
Visit-rameshpublishinghouse.com/
Call: 91-011-23261567, 23275124, 23275224
#200Plus #WorldFamousPersonalities #TestGuide #EntranceTest

2

9 Apr 2022
I recently camp across testguide Seor. Was plesantly surpriced. An acessible and understandable guide and amazing testnet.

2
3 Mar 2022
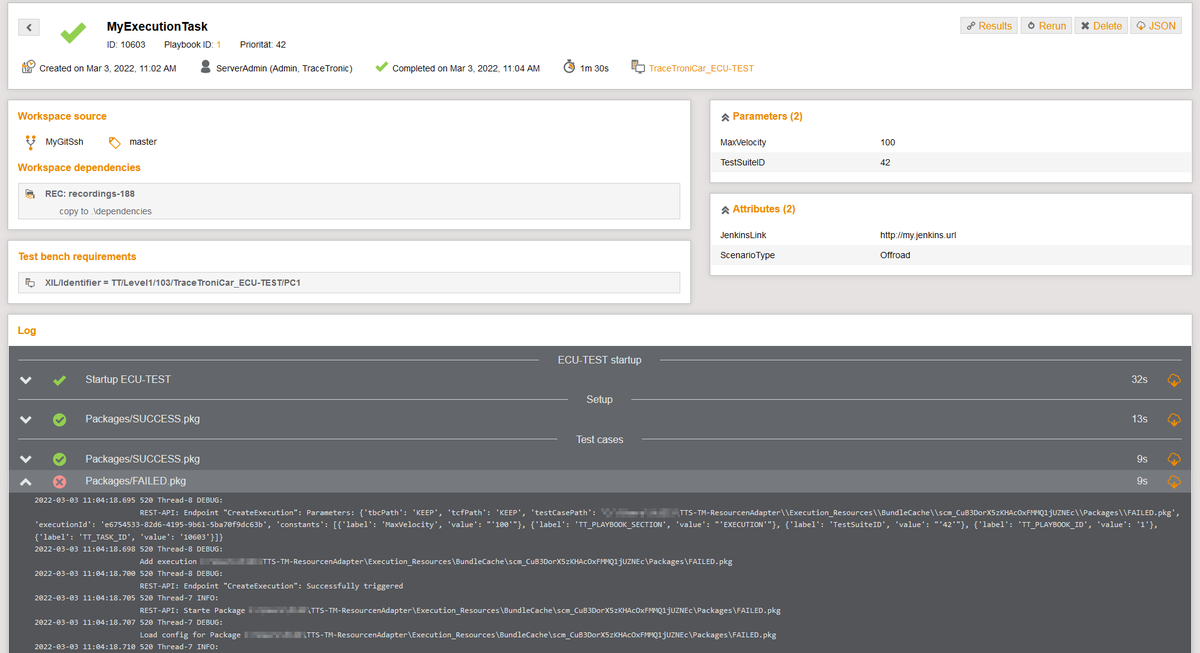
Auf einen Blick sehen, welcher Test wann, wo und mit welchem Ergebnis ausgeführt wurde? Das ist jetzt auf der Detailseite für Testausführungsaufträge in unserem Software-Tool TEST-GUIDE möglich. #testguide #featurecheck #softwaredevelopment
tracetronic.de/produkte/test…
3
22 Dec 2021
Wir verabschieden uns in die #Weihnachtspause und wünschen allen erholsame Feiertage und einen guten Rutsch ins neue Jahr. Falls die richtige Feiertagslektüre fehlt, schaut doch mal in unsere neuen #ecutest #tracecheck und #testguide Produktlebensläufe: tracetronic.de/mediabereich/…

2

11 Nov 2021
*ved testcenter*
Mig: Er der lang ventetid?
Testguide med stort smil: Nej, det går ret stærkt. En 45 minutter, vil jeg tro.
#wauw

8
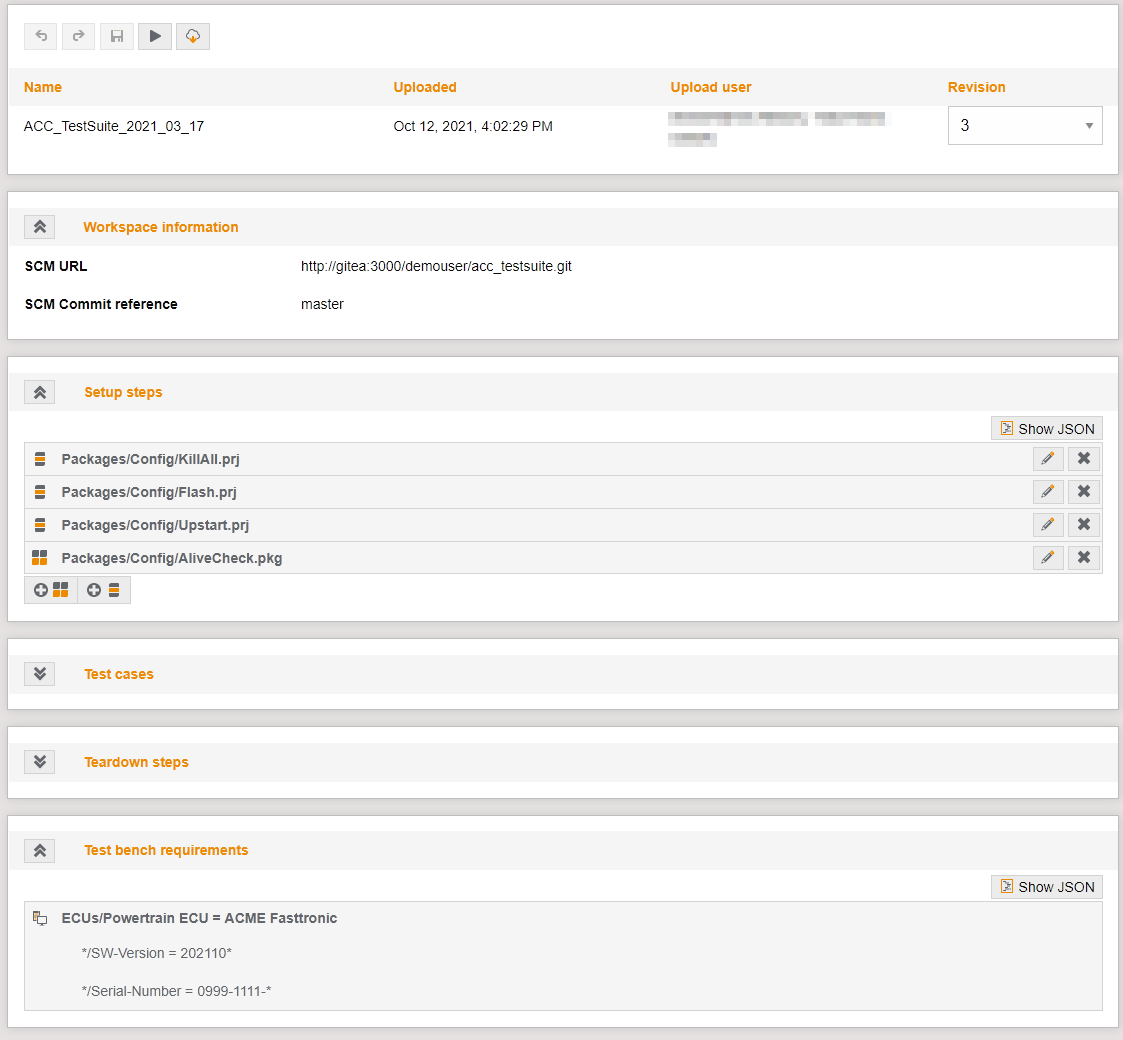
12 Oct 2021
Automatisierte Testausführungen planen? Leicht gemacht mit sogenannten Playbooks. Neu ab Version 1.109.0: aus ECU-TEST integrierte Playbooks können jetzt auch direkt in TEST-GUIDE bearbeitet werden.
#testguide #featurecheck #softwaredevelopment
1
1

23 May 2021
Also ein ganz normaler Tag. Ich möchte noch hinzufügen: Testaufseher und Testguide 👍
1
2