
#419 exploring intersection of healthcare and blockchain technology
Joined October 2023
- Tweets 992
- Following 257
- Followers 90
- Likes 1,877
75 Photos and videos


Pinned Tweet

18 Dec 2024
“Hey Claive: read this transcript from my therapist and give your additional thoughts on how to treat my anxiety”
Decentralized confidential AI for healthcare is the future - keep your secrets safe 🔐

1
3
18
670
laminar flow 🌊⚡️ retweeted

30 Jan 2025
Let's talk - pls dm me
8
2
62
3,553
laminar flow 🌊⚡️ retweeted

26 Jan 2025
privacy 2.0 is arguably the most positive-sum game in crypto right now.
private ai powers life-saving breakthroughs in medicine and enables truly personalized ai agents.
data becomes a resource you control—own your data, protect it, and even earn from it.
privacy on public blockchains fuels innovation, not compromise, and drives a better onchain future.
privacy 2.0 is a foundation for a better future, where innovation thrives, lives are saved, and everyone has control over their digital world.
16
19
125
10,025
laminar flow 🌊⚡️ retweeted

23 Jan 2025
Just curious - what do you see as the “DeCC” approach? I agree with your first point but I’d add that I think many projects tend to prioritize their own positioning vs leaning into the power of a unifying voice which also leads to this fragmentation. This is to be expected ofcourse but coming up with a universal term that fits everyone “approach” is incredibly difficult if there isn’t some mutual concession.
It’s clear we have 4 subcategories of tech driving the space. One unifying term would help categorize this vertical by providing a solid entry point for a broader audience which would benefit every project. Whether that’s Privacy 2.0, DeCC, PETs or anything in between, the goal is ensure privacy breaks into the mainstream and I think we’d all benefit from this type of alignment regardless of our day to day focus of positioning and differentiation.
Btw, this does not consider the challenge of coordinating across 30 teams which is a challenge in itself lol
1
1
2
128
laminar flow 🌊⚡️ retweeted
23 Jan 2025
Privacy 2.0 is facing an identity crisis.
Some reject the DeCC / Privacy 2.0 label.
Others make up their own.
I'll map the Privacy 2.0 / DeCC market or whatever the fk you want to call it so you don't have to.
Clarity isn't hard—alignment is.
e/acc everything.
5
5
43
2,609
laminar flow 🌊⚡️ retweeted

18 Jan 2025
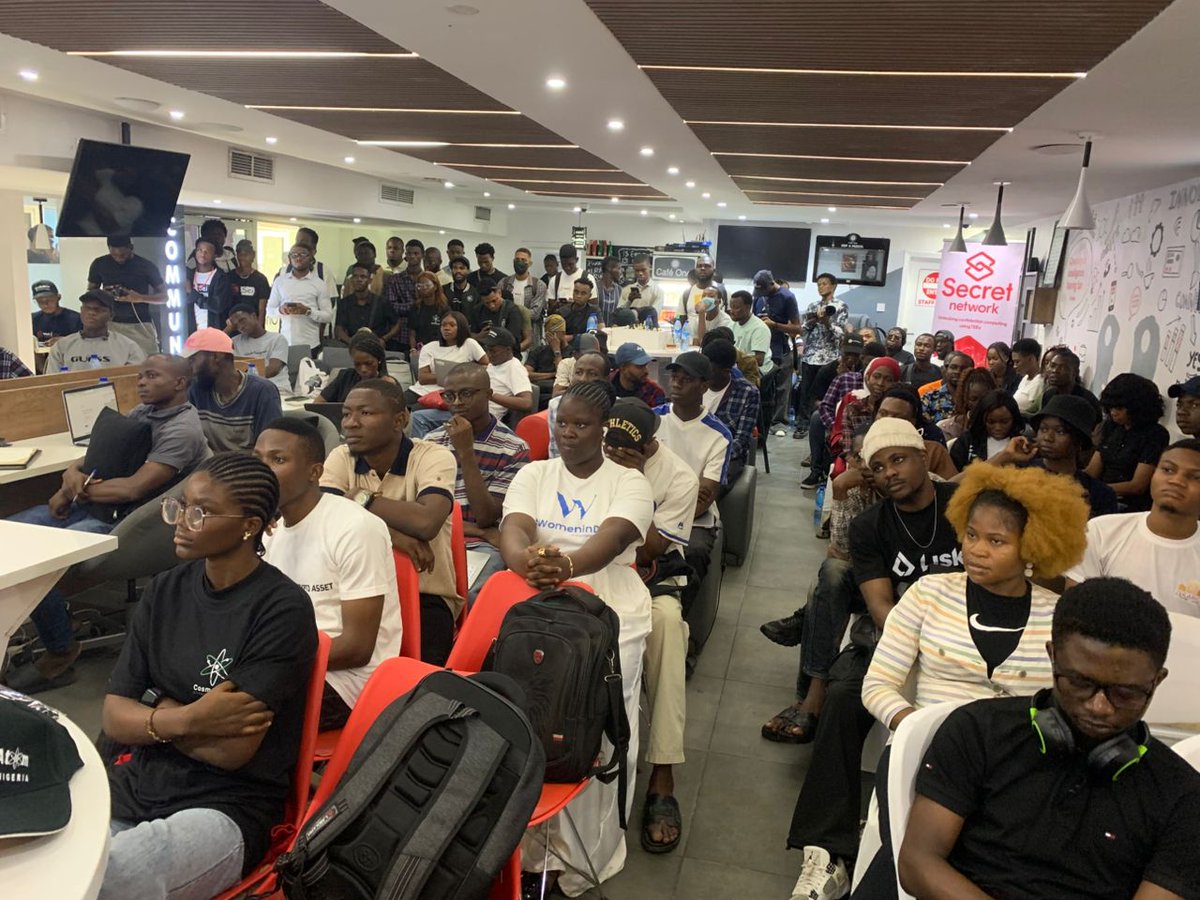
Love to see it! Been following @SCRTAfrica for a minute & they are relentless in spreading the good word 🙌💯
Incredible lineup of partners to support the initiative 👏❤️
1
1
6
215
laminar flow 🌊⚡️ retweeted

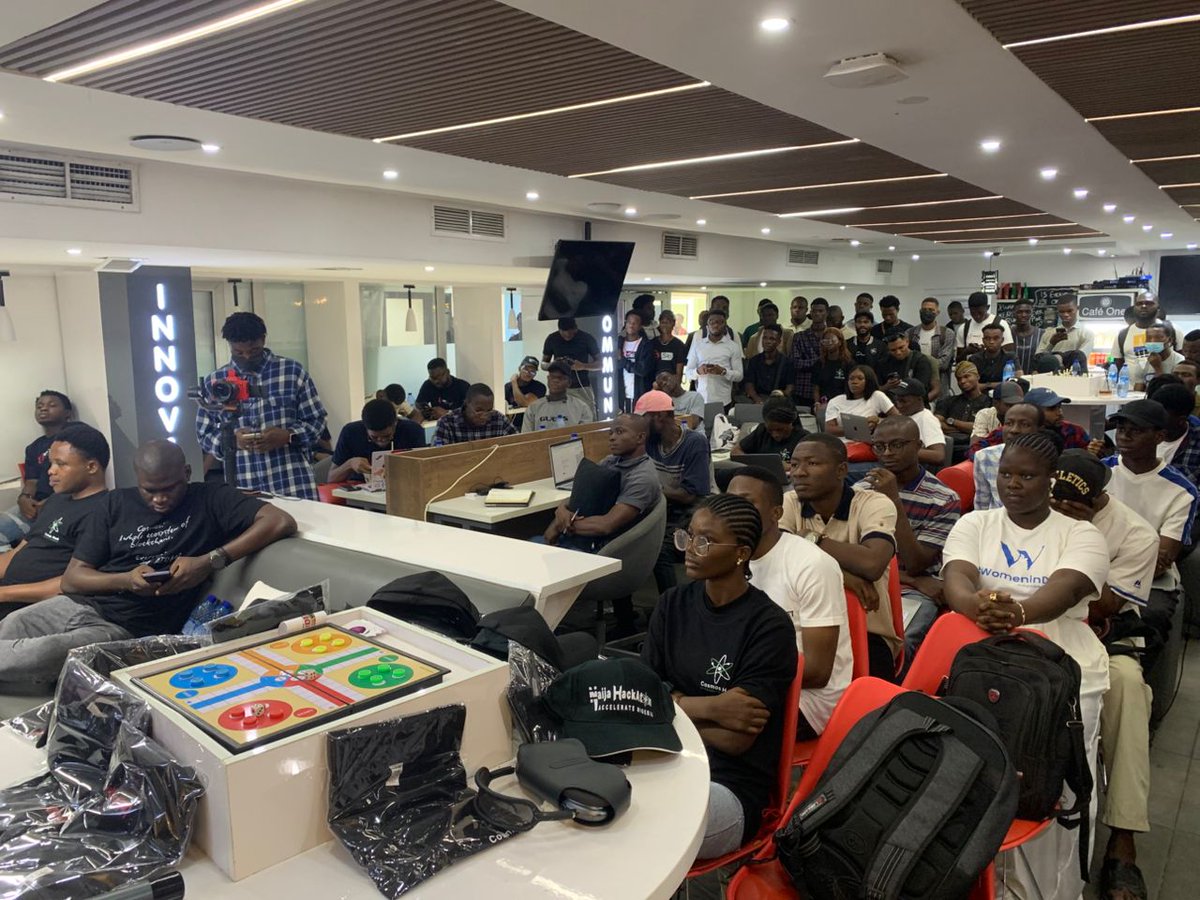
18 Jan 2025
Cosmos Hub Africa, @cosmos, @cosmoshub Lands in Lagos!
Supported by @ATOMAccelerator!
Ecosystem partners: @SecretNetwork, @akashnet @ChihuahuaChain, @OmniFlixNetwork and @passageio
13
44
210
26,810
laminar flow 🌊⚡️ retweeted

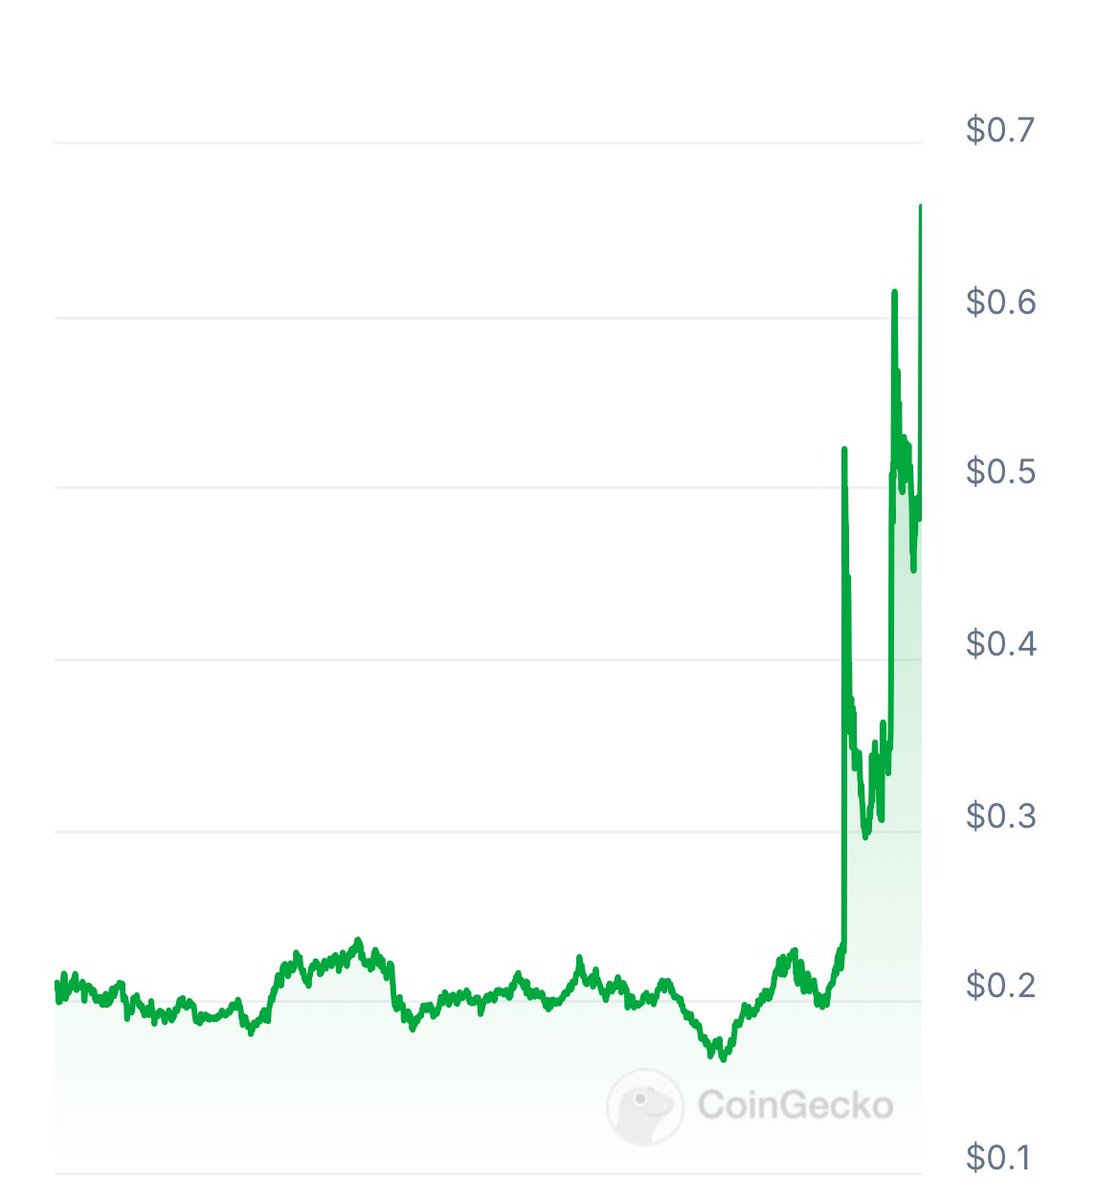
16 Jan 2025
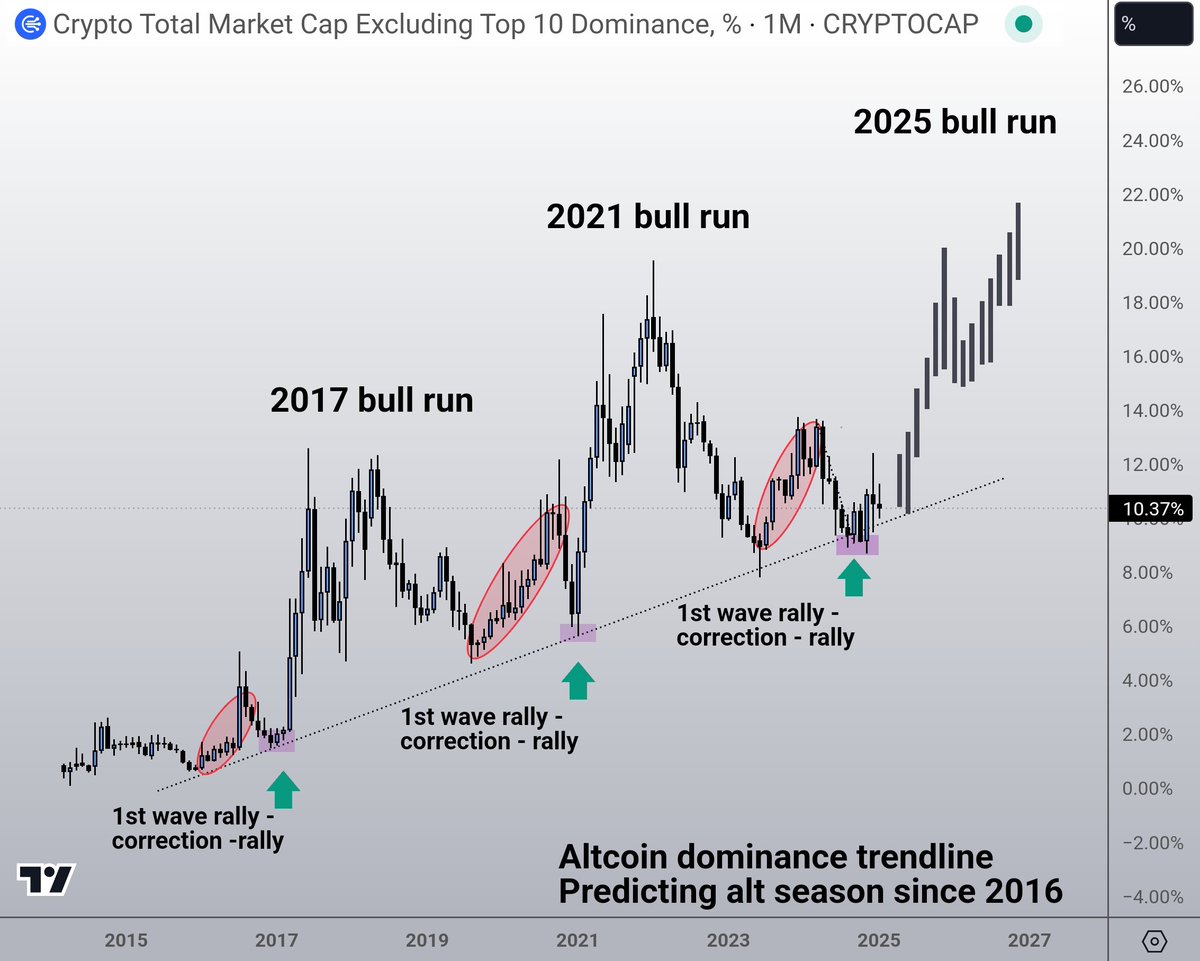
A chart that draws a lot of resemblance with Bitcoin dominance and another way to TRULY gauge "altcoin season"' as well.
(the outperformance of alts)
In a way, alts continue to play around with this lifelong proven trend.
Ever bull cycle to date had a huge rally.
(I know we don't have the date of many bull runs yet but regardless of that, every bull run prior to this, when altcoins was a thing we had a strong rally of outperformance).
Will altcoin dominance go as high and above previous times?
Maybe not. Neither does it need to.
(Just like bitcoin dominance won't necessarily break new lows)
The importance of Bitcoin has never been as high as today (Institutional adoption, ETFs, banks,...)
But the signs of a good rally of outperformance? Those are there yes.
And don't underestimate the effect of the chart even creeping up a little.
It'll provide an immense amount of room for a very strong selection of alts to outperform.
Nova out 🤝
27 Aug 2024

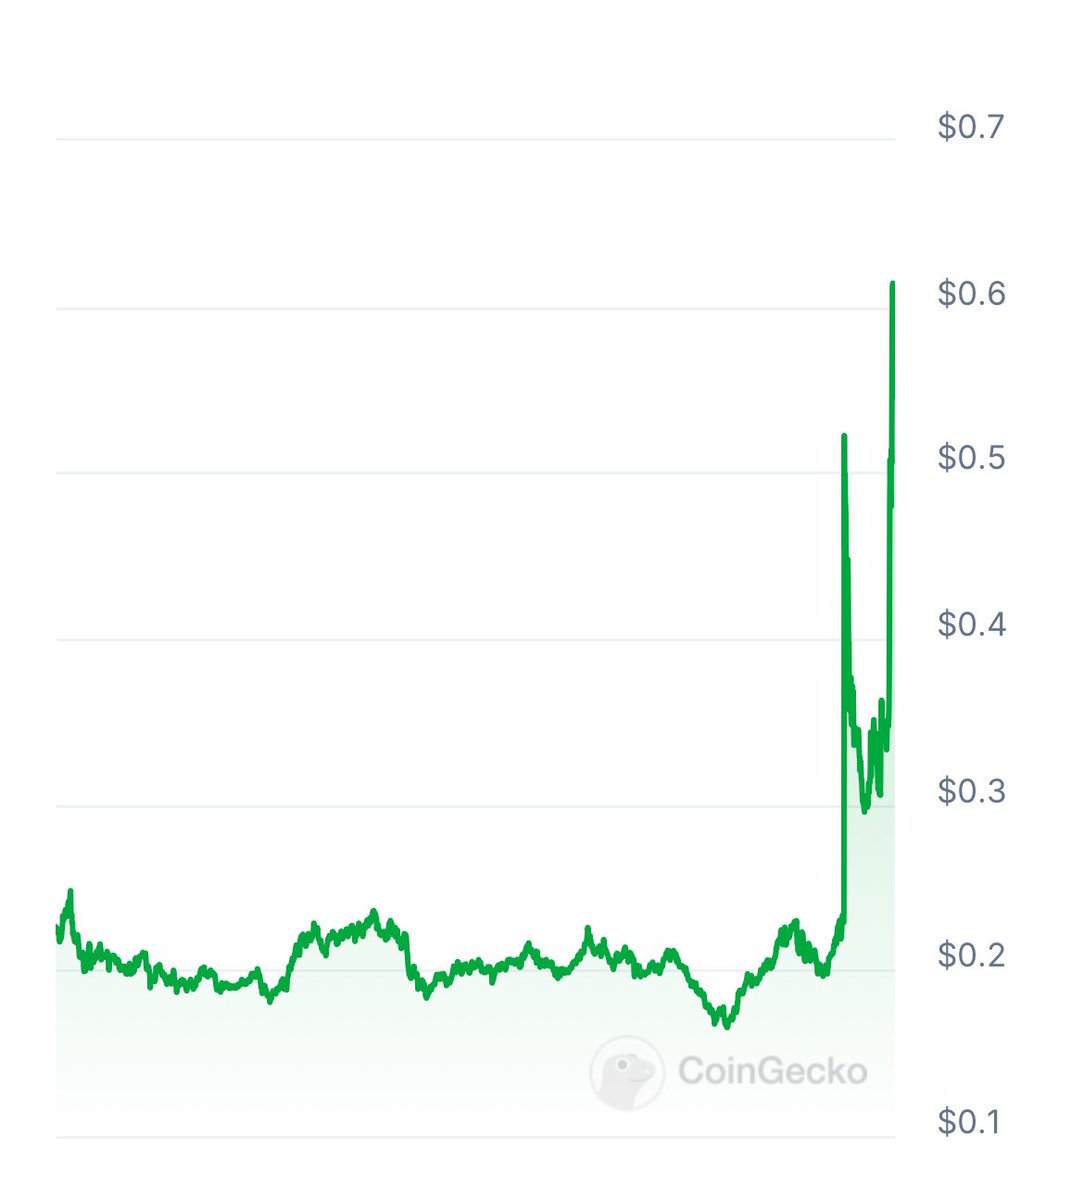
In a way when we look at it, today's cycle doesn't look much different than previous ones.
For those that don't know:
This is the altcoin dominance trendline that accurately predicted every altseason in history.
What's even more remarkable is
the fact that every cycle and run had one minor altseason followed by a correction / crash which has been followed again by the real major altseason.
Want even more confluence?
These first waves also all took place in the YEAR OF THE HALVING.
2016 - 2020 - 2024
The major altseasons? The year AFTER THE HALVING.
2017 - 2021 - 2025
See a pattern?
We had wave 1 earlier this year in Q1.
We had the crash for the past 4-5 months.
What follows next? 👀
~
Yes it all sounds really good to be true but there's no denying that the chart paints the exact same scenario for the last 10 years almost.
It's even playing out as we speak.
Nova out 🤝

25
24
201
41,221
laminar flow 🌊⚡️ retweeted

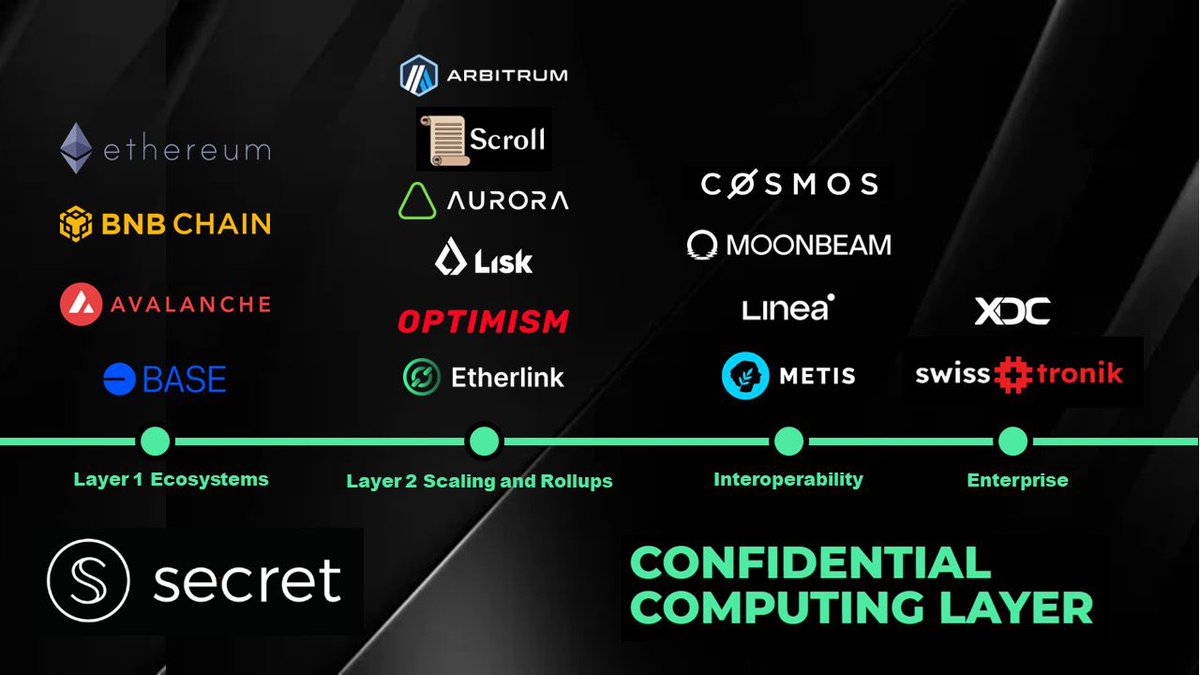
24 Dec 2024
@SecretNetwork is becoming a major confidential AI player and an AI R&D powerhouse. $SCRT powered decentralized AI eco-system allows you to build confidential AI solutions that work with sensitive data fully encrypted and protected by TEE and CC technologies.
1
7
28
1,106
18 Dec 2024
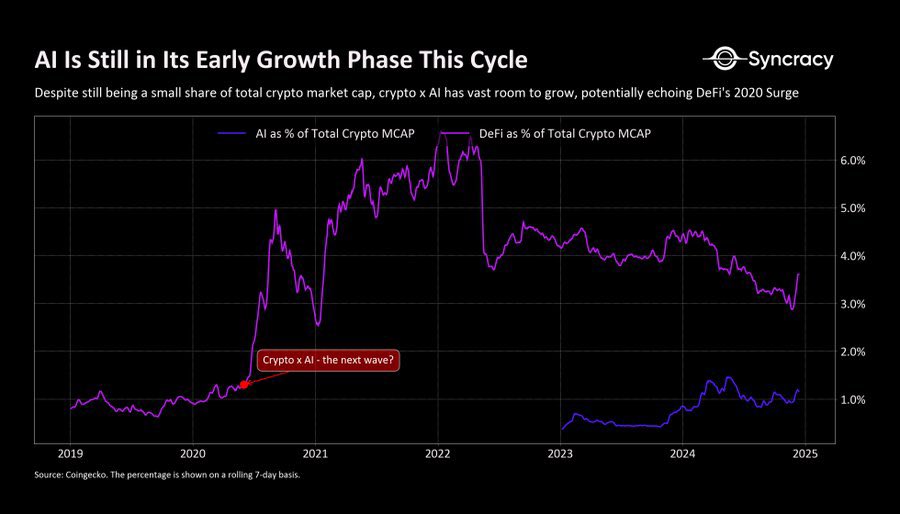
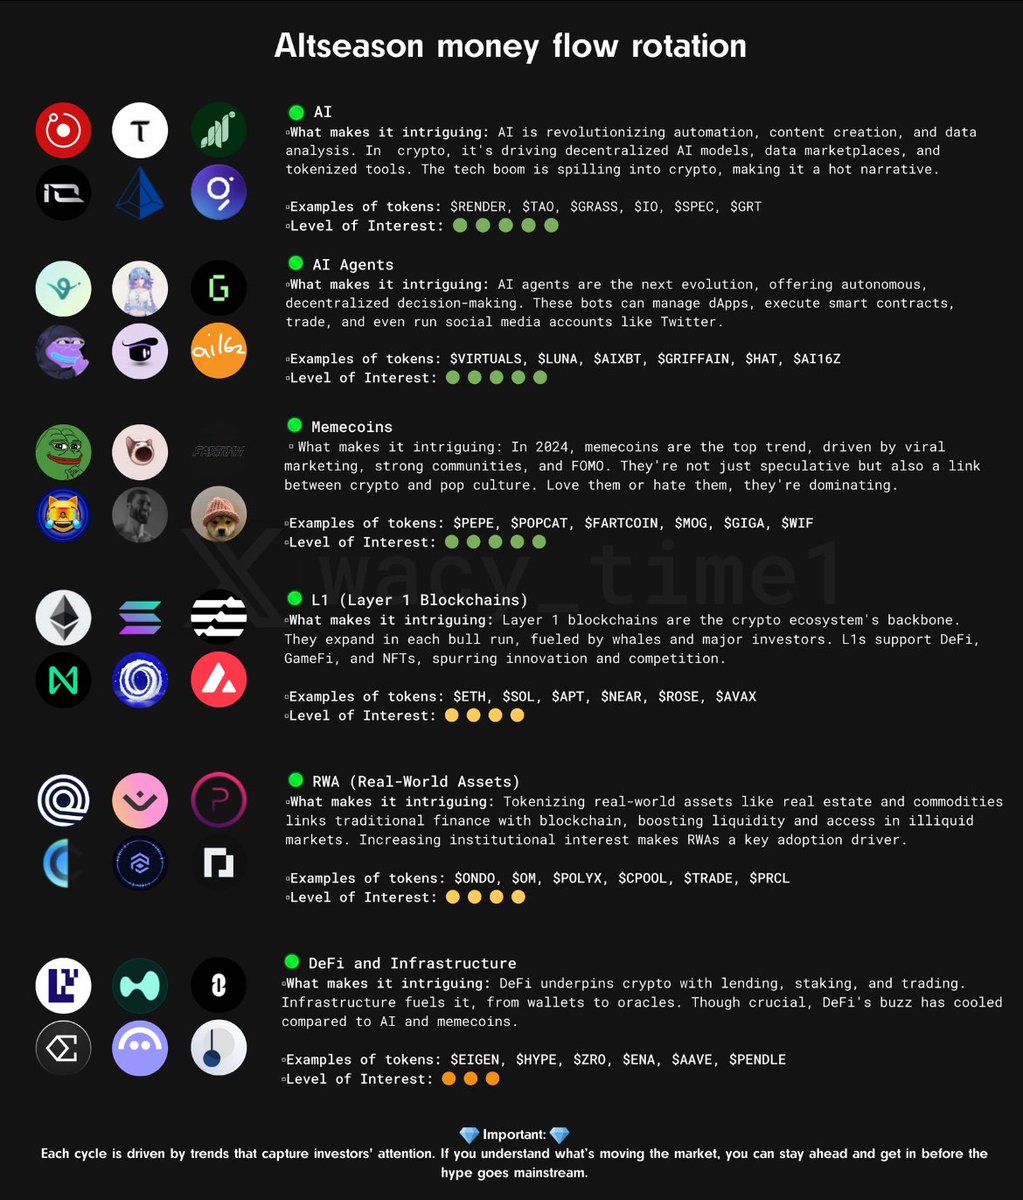
Is it likely that % total market cap for AI projects grows in 2025? ✅
Is there market demand and real use cases why AI prompts should be private and confidential? ✅
Does Secret Network have a strong offering that meets this need? ✅
How will this affect $SCRT price? 👀


1
2
16
557

boys!! 😭 imagine an AI agent that had access to all your therapy transcripts...
basically centralizing all of our deepest, darkest secrets. truly, we're cooked without privacy
17 Dec 2024

Ai agent trained on my therapy transcripts
3
2
12
692
laminar flow 🌊⚡️ retweeted

14 Dec 2024
OG Anon #501 (Rank #535) sold on December 14 2024 for 2339.00 $SCRT 🤫 #SecretNFTs @AnonsNFT
Find this anon on #StashhApp by clicking link below:
stashh.io/asset/secret1857lk…

2
5
24
963
laminar flow 🌊⚡️ retweeted

11 Dec 2024
Joe Burrow opens with a statement about feeling like his privacy has been violated in more ways than one.
20
30
1,237
152,886
laminar flow 🌊⚡️ retweeted

10 Dec 2024
Do you _really_ feel comfortable sharing medical data with grok or AI models? Without technical guarantees of confidentiality, the data can (and will) be used, and it will also leak. AI must be confidential.

You can upload anything from a phone picture of your blood test results to an MRI or X-Ray and Grok will analyze it for you
4
6
28
1,237
laminar flow 🌊⚡️ retweeted

3 Dec 2024
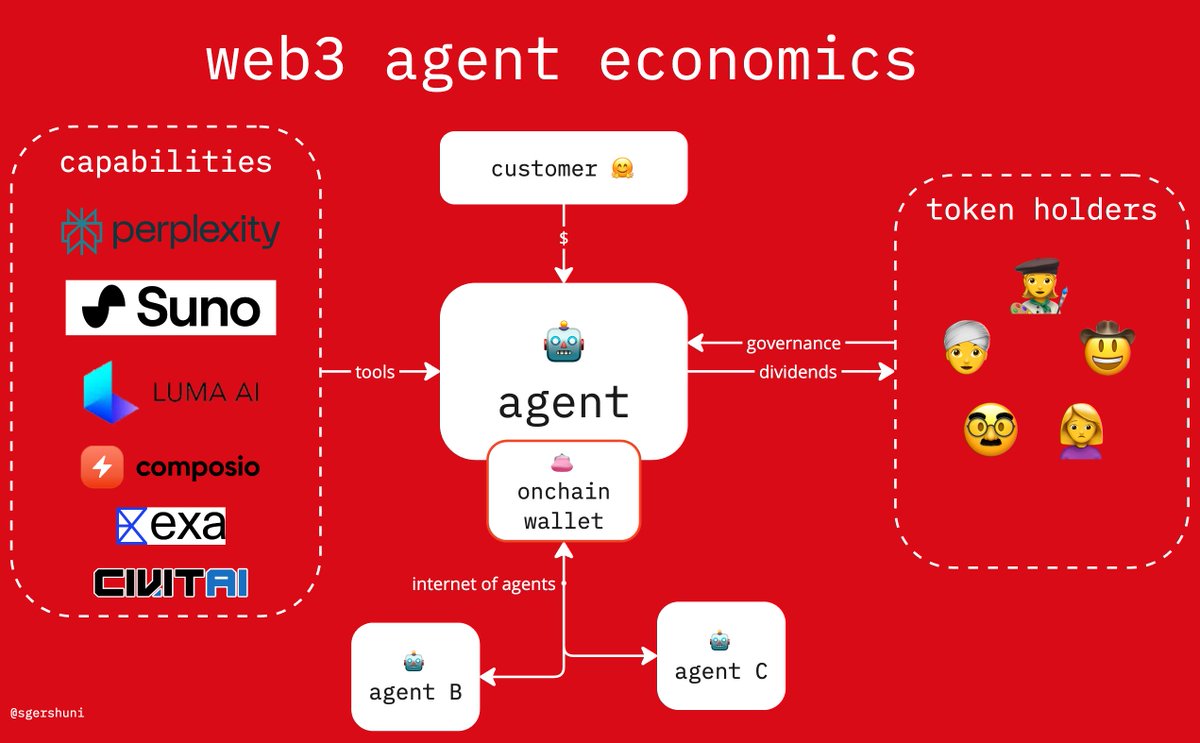
web3 AI agents are becoming the new meta in 2025.
but what's next for them beyond the hype and speculation?
Wrote a report on the future of web3 agents, onchain AI economy and post-labor economy 🧵👇
10
48
167
17,420
laminar flow 🌊⚡️ retweeted

6 Dec 2024
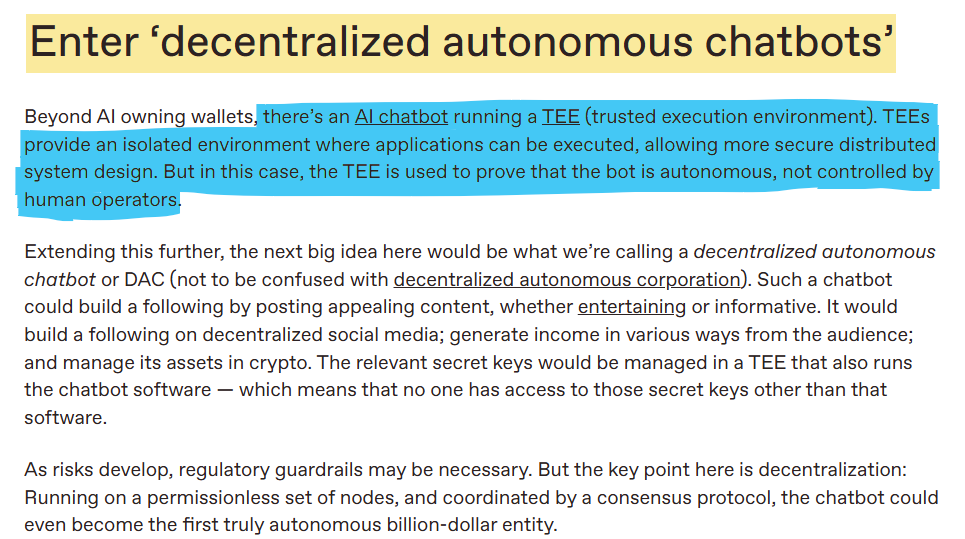
Think bigger than applications.
Think infrastructure.
Just as AWS enabled Web2's explosion And Ethereum enabled DeFi's rise
Secret Network's confidential computing layer will enable the private AI revolution.
We're not building on top. We're building the foundation. ⚡️
4
26
121
7,152
6 Dec 2024
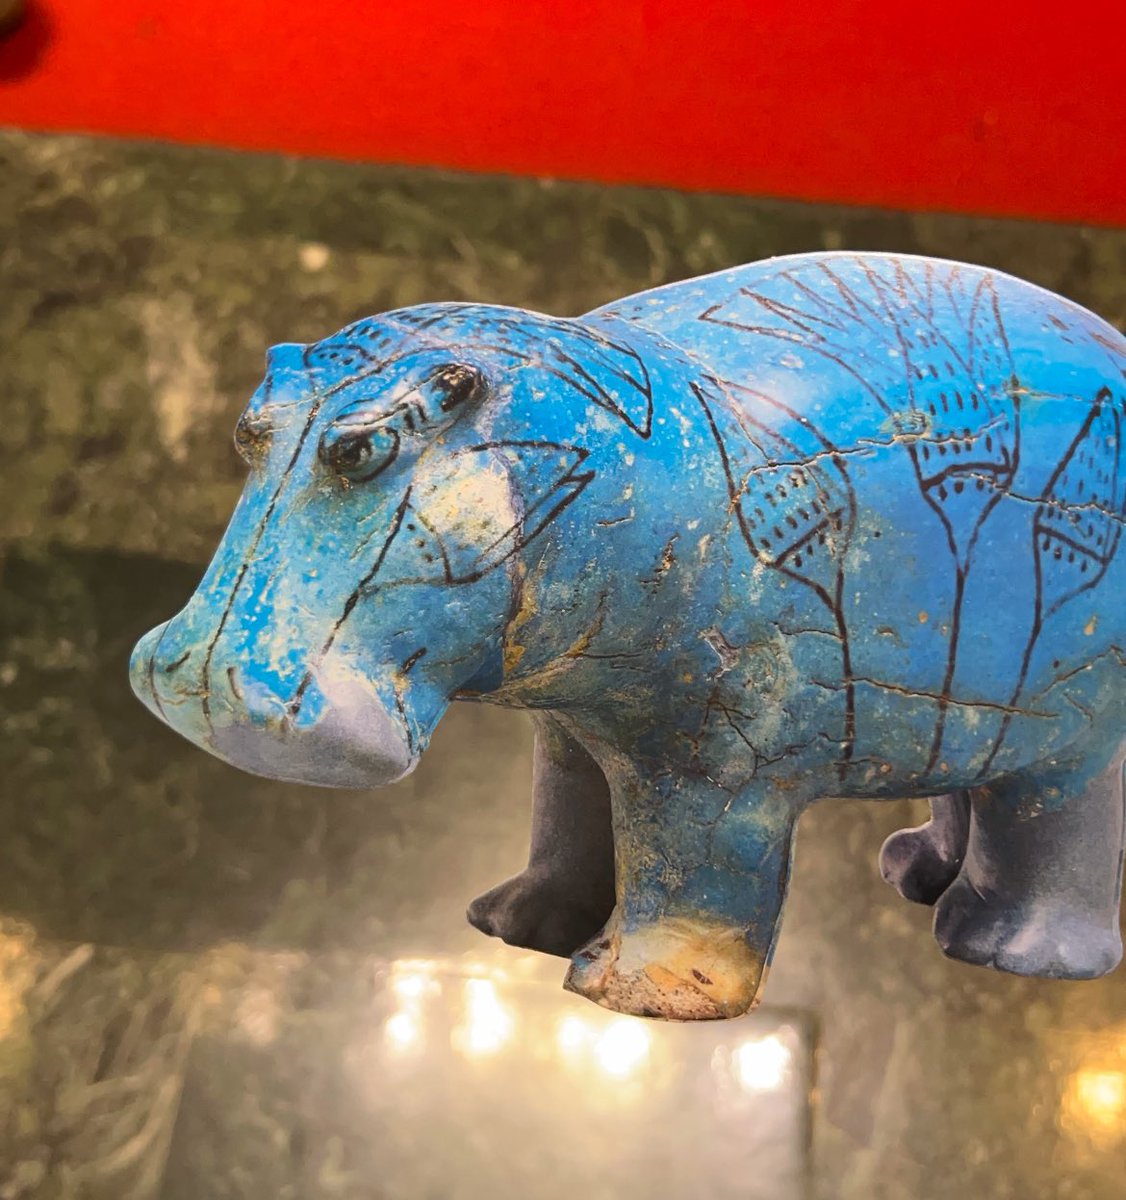
Created a $MOODENG meme on my phone in 5 min 🦛
“Ancient Moo spotted at THE MET NYC”
stashh.io/collection/moo-den…
4 Dec 2024

2/ USDC rewards!
Grand Prize: One memer will win 500 USDC! To qualify, you must create a $MOODENG Meme Drop with a minimum of 50 copies - and it MUST mint out.
Runner-ups: We’re also giving away 25 USDC to six people who either create or claim from any $MOODENG Meme Drop.
211
6 Dec 2024
BULLISH $SCRT 🚀🌘

4
25
812
5 Dec 2024
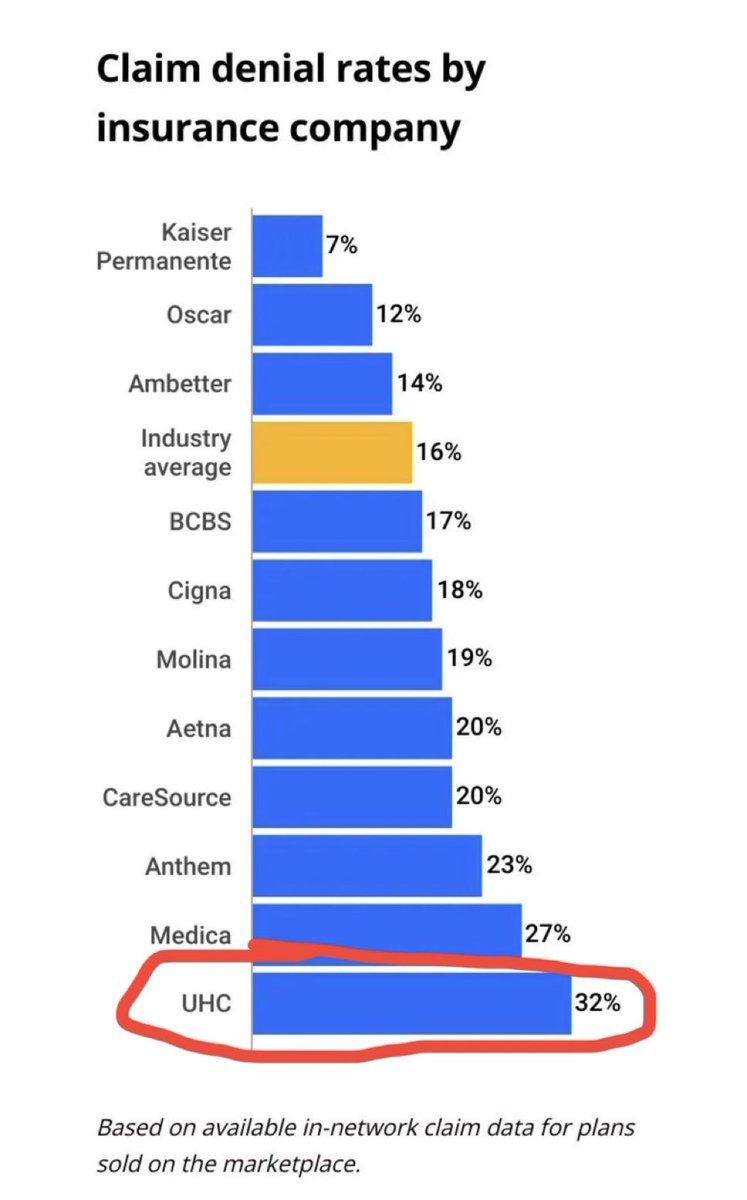
Medical claims processing should be driven by smart contracts
4 Dec 2024

The CEO of United Healthcare was just murdered. I wonder what the motivation was.
102