
Making software and entertainment, editorial technology nerd. Senior Software Engineer in Video Engineering at Netflix and a helper guy on OpenTimelineIO.
Joined April 2007
- Tweets 655
- Following 206
- Followers 197
- Likes 419
39 Photos and videos


Eric Reinecke retweeted

11 Mar 2024
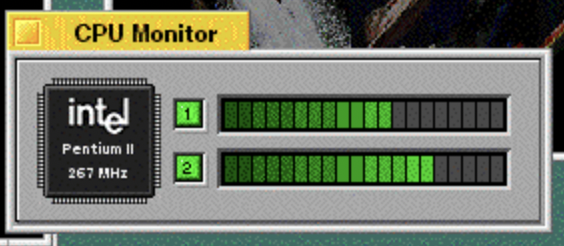
Exciting news for video lovers! Released in January, AOMedia's open specification for film grain synthesis brings remarkable coding efficiency gains to movies, streams, and TV shows. #AFGS1 @Andrey_Norkin To learn more, visit the blog here: brnw.ch/21wHLLP
2
4
14
3,839
Eric Reinecke retweeted

29 Jun 2022
ASWF members @Autodesk_ME, @UnrealEngine, @TheFoundryTeam, and @ftrackhq shared how their tools are expanding support for #OpenTimelineIO - get the details here! aswf.io/blog/project-spotlig… #OpenSource
1
6
8

21 Jan 2022
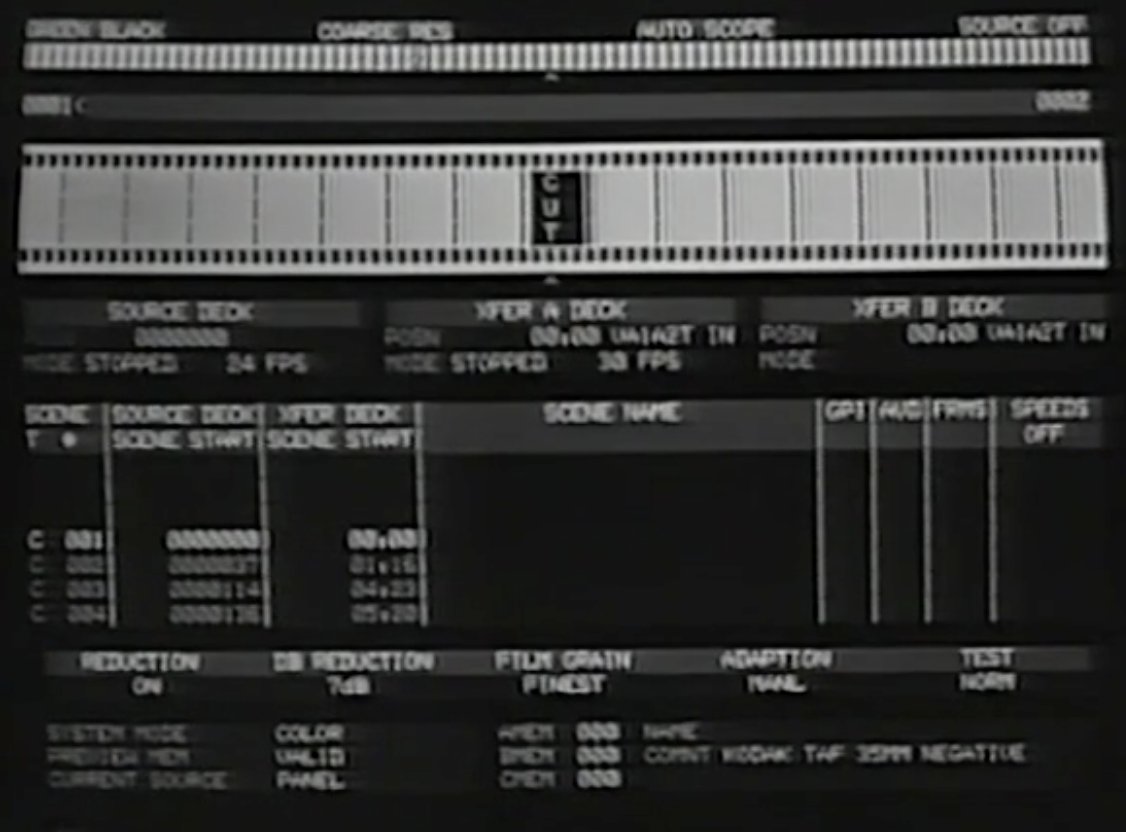
This 1987 timeline visualization from from the DaVinci color correction system is EVERYTHING. Source: vimeo.com/49614045?embedded=…
2
Eric Reinecke retweeted

3 Dec 2021
OpenTimelineIO (OTIO) is now natively supported in ShotGrid RV! OTIO is an open-source initiative that helps you handle important editorial cut information in your timeline. Learn more here: autode.sk/31ptTUe
6
10
27 Oct 2021
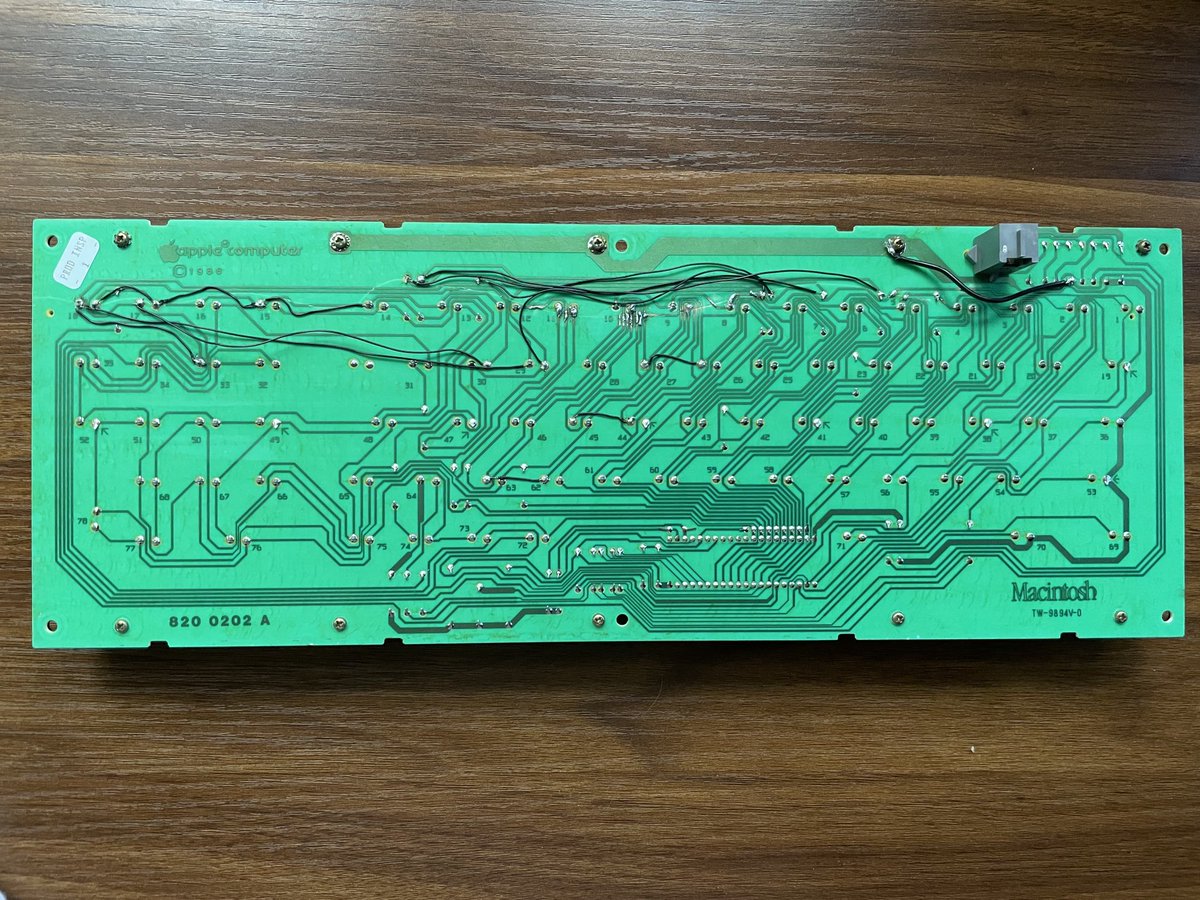
Cracked Mac plus keyboard fixed up with a combo of sanding traces to the copper to solder across the crack and adding jumper wires where the crack intersected multiple times or the traces were too small. A super fun fix!
2
Eric Reinecke retweeted

18 Oct 2021
how it started: how it’s going:
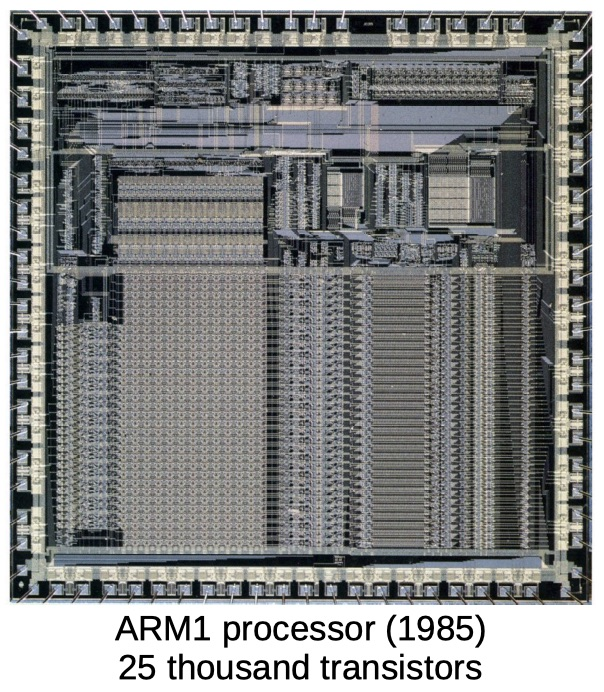
ALT Die photo of the ARM1 processor (1985) with 25 thousand transistors.
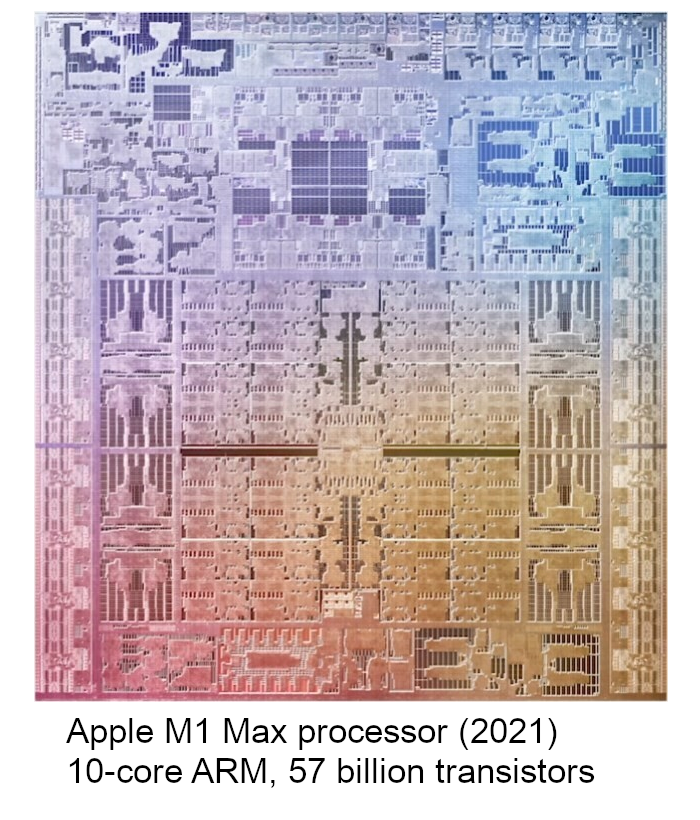
ALT Die photo of the Apple M1 Max processor (2021) with 10-core ARM and 57 billion transistors.
154
4,943
28,054
24 Sep 2021
Sorry, one more. Rusty Goins is my new default state.
1
1
24 Sep 2021
I don’t even care what movie it is, I’m in.
1
21 Aug 2021
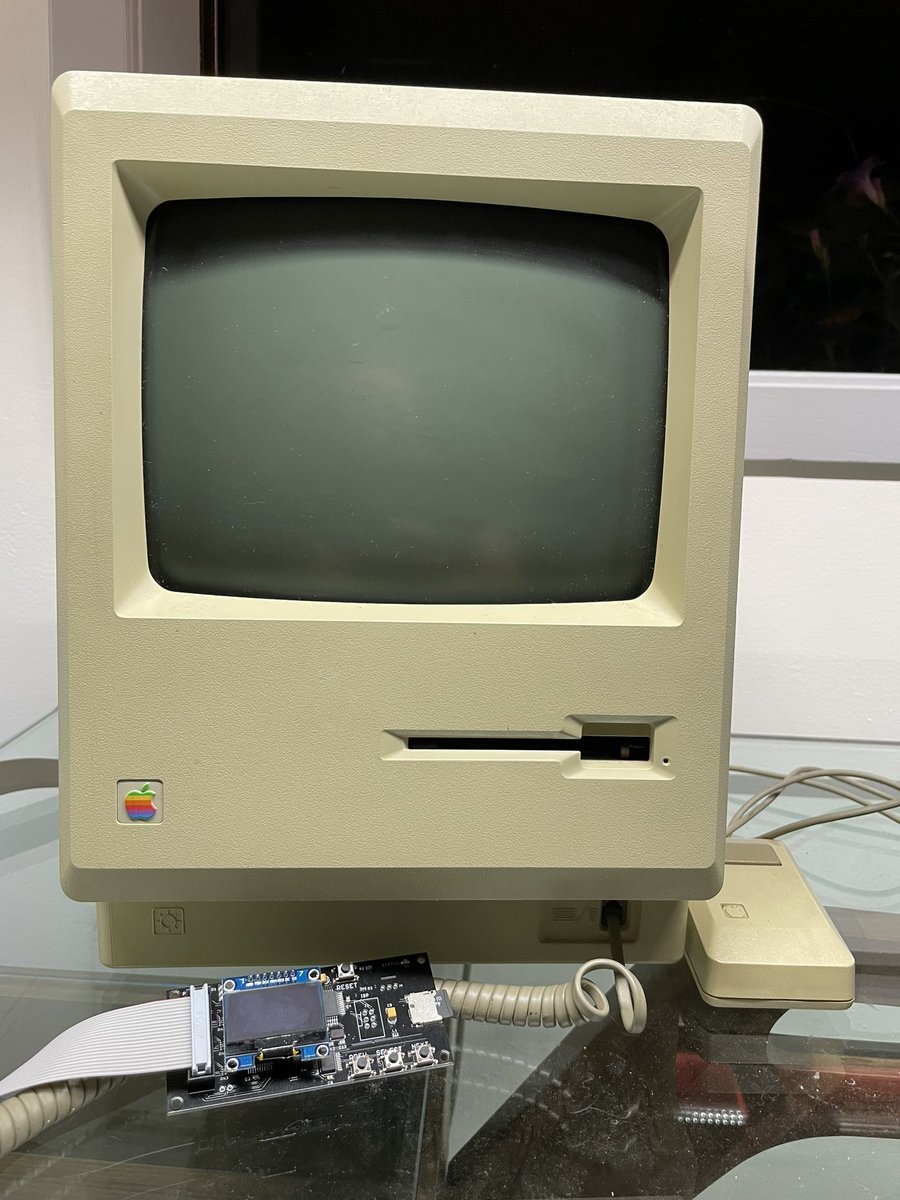
This little Mac 512k that’s gotten a RAM, SCSI, and ROM upgrade to effectively make it a Mac Plus runs great except the top half of the keyboard didn’t work.
Found this crack running the length of the board, looks like I’ve got a lot of traces to patch with bridge wire…
2
20 Aug 2021
I have no problem with fractional frame rates disappearing, but I'm also a frame rate Nihilist - I do my best to build tools that don't care about what timestamps are on samples. I guess I'm not building displays though...
nomore2398.com
1
1
20 Aug 2021
However, if we're calling for frame rate reform to restore mathematical purity, 24fps isn't the answer - 25fps has frames samples at exactly 40ms intervals. It would resolve issues like this one (container duration often mismatching stream duration): github.com/FFmpeg/FFmpeg/blo…
1
20 Aug 2021
I think we can all agree fractional frame rates are not ideal, but if we're doing this reform the choice of 24fps or 30fps feels like it may be an overly Americentric one.
28 Jul 2021
I'm excited to be presenting for #OpenTimelineIO with @jminor, @stephan_gfx, and @meshula at Open Source Days 2021 sched.co/kM5P
5 May 2021
Had a great time using (maybe abusing) #OpenTimelineIO for our @netflix Winter Hack Day 2021 project. Go check out "Where Was I!?!" in the blog post to see more! netflixtechblog.medium.com/n…
1
1
Eric Reinecke retweeted

19 Mar 2021
And the natural way to view this circular image is on a hemispherical dome - looking at it on a flat screen is against the laws of nature
1
1
3
1 Dec 2020
Wow, this is a fun new world to be pulled into! I have no context, what is this teaser hinting at?
Eric Reinecke retweeted

7 Nov 2020
GEORGIA: The January 5 runoff elections for control of the U.S. Senate are fast approaching. Make your voice heard by requesting your ballot now at ballotrequest.sos.ga.gov #LetsGetItDoneAgain #gapol
2,337
45,264
135,148
Eric Reinecke retweeted

7 Nov 2020
7 Nov 2020

#BREAKING: Joe Biden has been elected President of the United States, according to an AP race call. trib.al/bljwLRx

1
2
6 Nov 2020
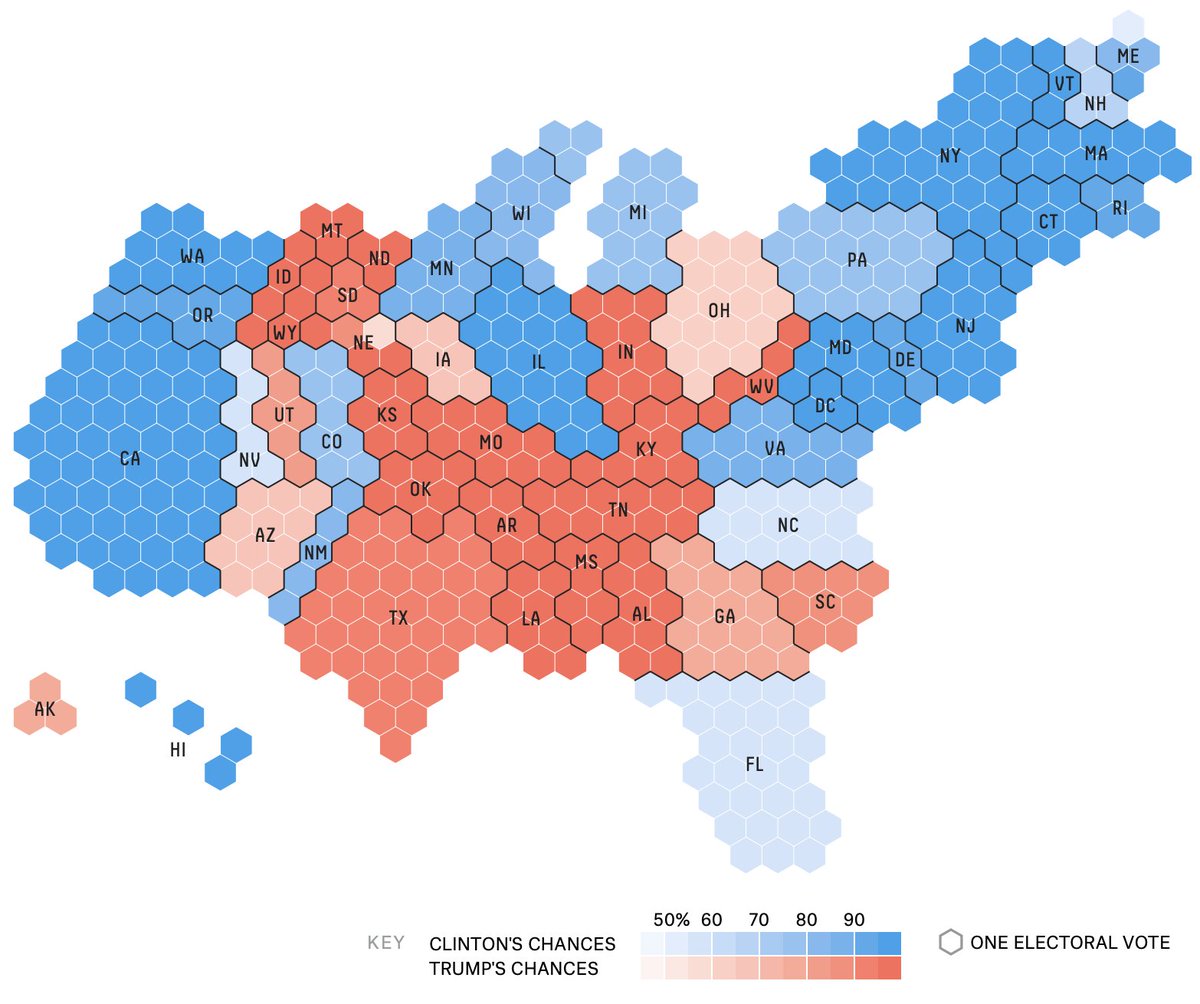
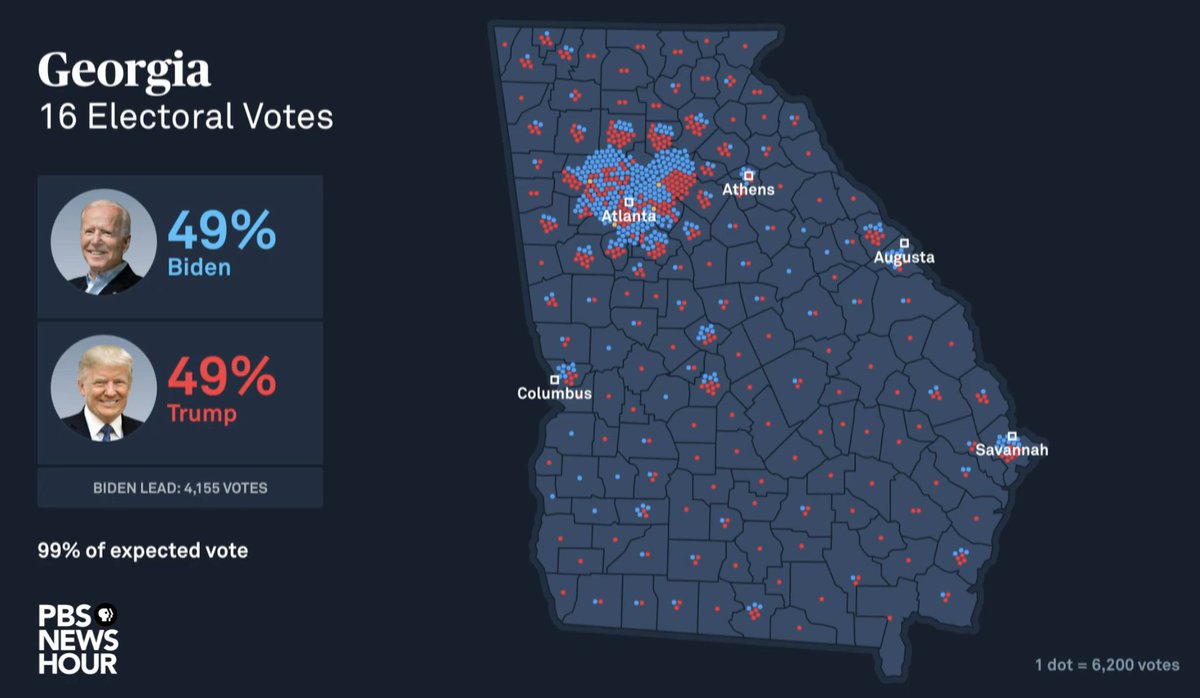
Data visualization is important for making complex information (like election data) comprehendible. This election I've been paying close attention and most outlets have been failing. This is a great start addressing the most common offender:
washingtonpost.com/politics/…
1
1
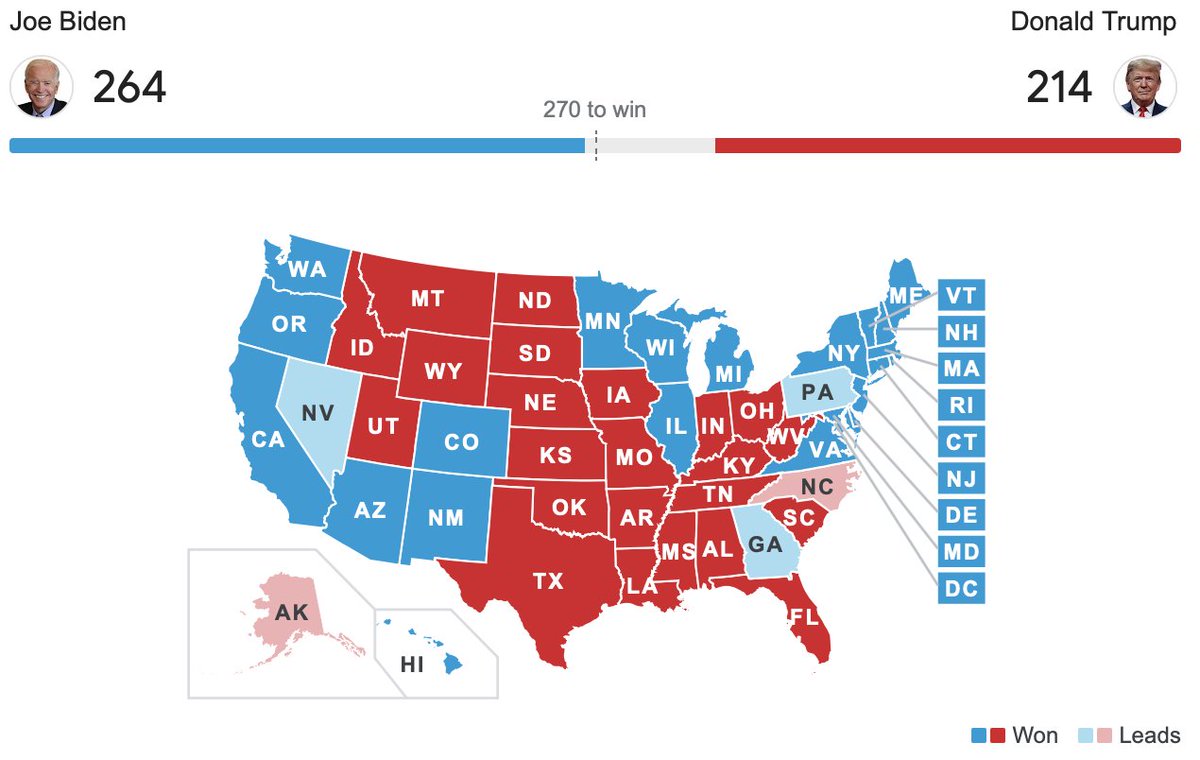
6 Nov 2020
Google's visualization is probably one of the worst variants. It applies colors to states regardless of how much data is in. If 24 votes have been tallied for a state, a candidate's lead is visualized the same as 12,000,000 votes tallied.
1
1
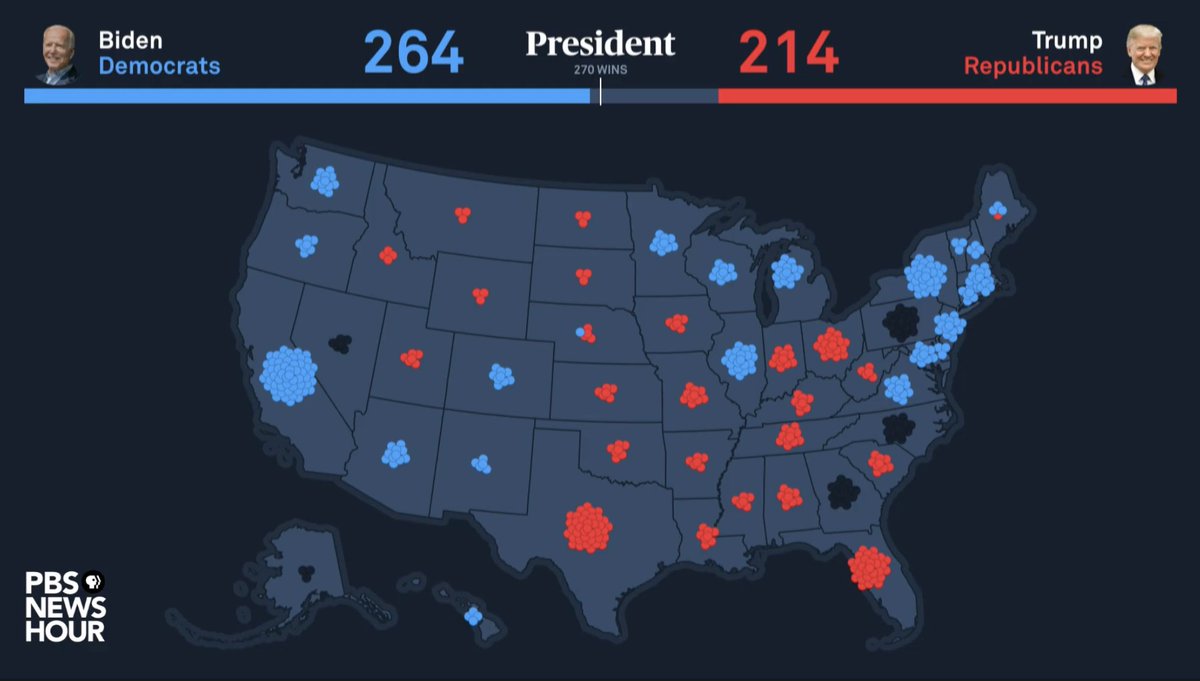
6 Nov 2020
This is a place where @NewsHour has done much better. In this image they're telling us which states are called, which aren't and what electoral votes are going where. (Note the elegant handling of NE and ME too!)
1