
JavaScript diagramming library powering exceptional UIs
Joined February 2011
- Tweets 417
- Following 106
- Followers 376
- Likes 43
94 Photos and videos


We’re excited to launch the JointJS MCP Server, a completely free tool that connects your AI coding assistants (Claude, Cursor, Copilot, and more) directly to up-to-date JointJS docs, APIs, and demo code.
Instead of guessing or relying on outdated training data, your AI agent can now:
• Use the correct JointJS APIs
• Follow official best practices
• Generate higher quality code
Learn more about JointJS MCP Server: jointjs.com/blog/introducing…
If you’re building with JointJS, adding MCP to your AI tooling is a no-brainer.
1
1
100
After seeing a cool demo on Reddit, this flowchart was rebuilt in JointJS to recreate the effect of flowing dashed lines and animated dots moving along the links.
#JointJS #flowcharts #diagramming
1
60
See the live demo here: changelog.jointjs.com/galler…
It’s a single-page app, so the full source is available in `index.html` for anyone who wants to take a look. 🧑💻
36
We (and by we I mean @DavidDurman) built a small JointJS app that lets you track tournament results. It's handy for sports events where you or your kids participate, and you can even use it to play guessing games for tournaments you watch. (The upcoming FIFA World Cup is a nice example here.) ⚽️🏀🏒
I peeked at the code and singled out some coding patterns I thought might be interesting for you to 'steal' and use in your JointJS apps.
📝 The article: jointjs.com/blog/building-to…
🏆 Tournament Studio JointJS app: tournament-studio.apps.joint…
ALT JointJS Tournament Studio.

ALT FIFA World Cup 2026 simulated results of the knockout stage showing Croatia winning the upper bracket.
1
42
Are you sharing your MCP server configuration and setup with your team? 🤔
It's really easy in Claude Code. Just add a flag `--scope project` while installing an MCP, and a file `.mcp.json` will be created. You can commit that to your repository, and whenever a team member enters Claude Code, the config will be read, and servers will be connected (after granting permission). 🔥
#claudecode #mcp
1
1
103
You'll also find a short write-up on our blog: jointjs.com/blog/how-to-easi…
27
Can your diagramming library handle 100,000 elements and still feel this smooth and performant? 💨
We put JointJS to the test to see whether it could turn a massive diagram into a performance masterpiece.
See it in action below. 👇
#WebPerformance #JointJS #TechTips
48
Wonder how JointJS performs with massive diagrams and workflows?
Here's a written overview on our blog, testing diagrams with 100,000 nodes. 🚀
jointjs.com/blog/jointjs-per…
34
Can a JavaScript diagramming library render 100,000 elements on a single canvas without dropping frames?
Short answer: Yes.
Long answer: We tested it. From 600 nodes to 100,000, with and without performance optimizations applied, recording everything in the DevTools Performance tab.
The video covers:
🚀 How JointJS holds up at 600, 1,000, 6,000, 11,000, and 100,000 nodes
⚡️ The five techniques that make the biggest difference at scale
🤖 How to get specific, doc-backed performance advice with the JointJS MCP server
If you're evaluating diagramming libraries and care about performance, this one's worth a watch.
Link in the comments.
#JointJS #DataVisualization #Diagramming
1
1
131
JointJS performance overview: youtu.be/vMLLgK7Lb2g
29
Want a clearer view of your YouTube channel performance?
With our YouTube Channel Visualizer, you can:
🚀 map your channel as an interactive diagram
📊 spot key metrics that help you make better content decisions
🎆 export a visual snapshot to share with your team or audience
Watch the short video to see how it works.
#YouTube #ContentStrategy #DataVisualization #CreatorTools #Analytics
1
36
What if your Claude Code Playground diagrams were actually interactive?
Draggable nodes. Smart link routing. Animated transitions.
One HTML file, no build steps.
Here's how to do it with the open source version of JointJS 👉 youtube.com/watch?v=GSYSbJo6…
#claudecode #diagramming #javascript #webdev
4
284
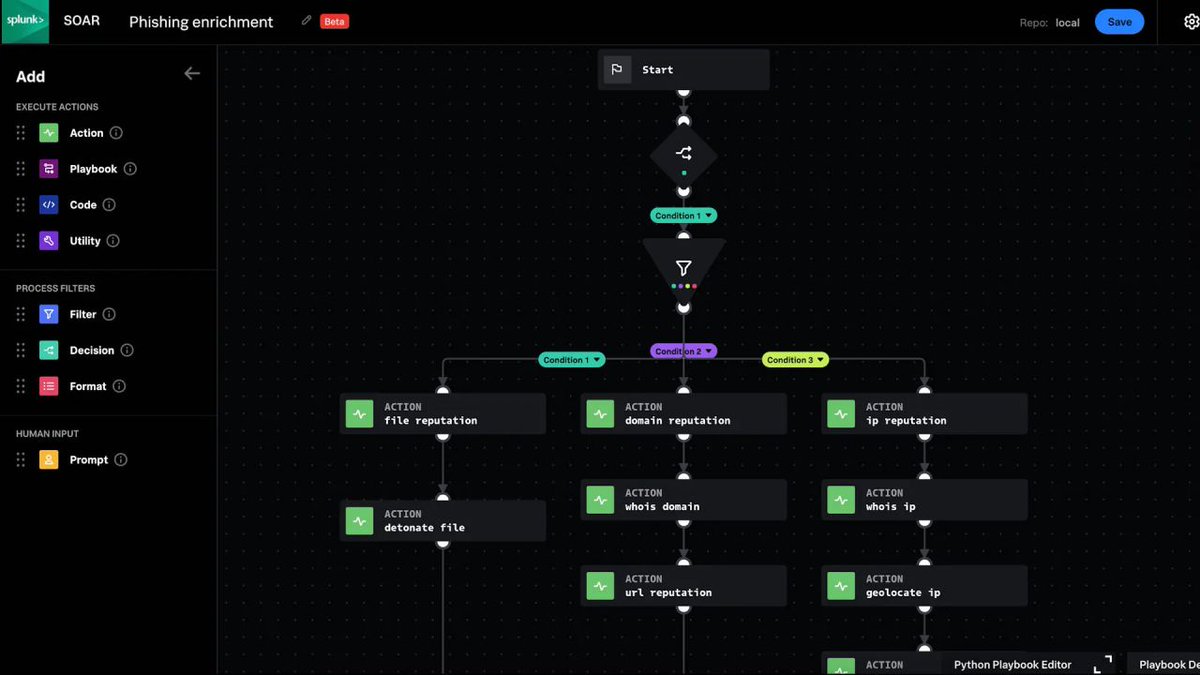
🎬 From JointJS demo to working apps — in minutes, with Claude Code
1/ Pick a JointJS demo app close to your use case.
2/ Tell Claude Code what to change.
3/ Have a working prototype before your next meeting.
In our latest tutorial, Zoran walks through customizing our AI workflow builder demo — branding, UI tweaks, new workflow actions, SVG export — without deep JointJS knowledge.
We have 180 demos to start from. The rest is just prompting.
Watch the full tutorial: youtube.com/watch?v=5A2ktOK1…
#JointJS #ClaudeCode #Diagramming #AI
111
Do long links make your complex diagrams hard to read? 😵💫
As diagrams grow, connections start crossing the entire canvas, overlapping elements and adding visual noise.
✅ In our new demo, we solve this with link teleports.
Long links are replaced with small markers at each end. Click a marker and the viewport jumps to the connected shape. Short links stay visible. Long ones switch automatically.
Cleaner canvas. Same connectivity.
Play with teleport links here: jointjs.com/demos/link-telep…
#JointJS #diagramming
1
38
itemis DE uses JointJS to power a visual statechart editor in itemis CREATE, enabling teams to model, simulate, and validate complex state-based system behavior.
➡️ jointjs.com/showcase/itemis
--
See more real-world products built with JointJS 👉 jointjs.com/showcase
#CustomerShowcase #itemis #JointJS #Diagramming #StatechartEditor #StateMachine
1
1
2
66
Big news for JointJS 🚀
We’re excited to welcome @ZoranJambor as our new Developer Advocate.
Many of you may already know Zoran as the person behind @CSSWeekly — a developer newsletter with 40,000 subscribers — and a YouTube channel followed by 13k developers. For years, he’s been curating, explaining, and breaking down complex frontend topics for a global audience.
Now, he’s bringing that experience to JointJS.
Zoran will help us double down on:
😎 clearer technical content
👌 better demo apps
📄 deeper tutorials
❤️ stronger connection with the dev community
JointJS has always been built for developers solving complex diagramming problems. With Zoran onboard, we’re investing even more into education, hands-on examples, and real-world use cases.
If you're building workflow editors, BPMN modelers, data modeling tools, network visualizations, or any serious diagram UI — you’ll be seeing a lot more practical content from us soon.
Welcome to the team, Zoran 👋
4
146
👫 We’ve just released a new Genogram (family tree) demo.
Turn structured family data into a clean, interactive, multi-generational diagram — automatically.
No manual positioning.
No layout headaches.
If your app works with relationship or hierarchical data, this shows how to visualize it clearly and instantly.
👉 Explore the live demo: jointjs.com/demos/genogram-f…
Full tutorial linked below.
#genogram #familytree #diagramming #jointjs
1
49
Curious how it’s built? Read the full tutorial:
jointjs.com/blog/build-genog…
25
Have you ever wondered how to render Angular components inside JointJS shapes?
Our latest tutorial shows how to do this with Angular’s native createComponent() API — no migration or workarounds required.
What you get:
✅ Reuse existing components
✅ Stay in the Angular ecosystem
✅ Full two-way binding
✅ Complete lifecycle management
Perfect for teams that:
1️⃣ Have existing Angular components they need to visualize in diagrams
2️⃣ Want to build diagramming features without stepping outside Angular's patterns
3️⃣ Need interactive diagram elements with forms, inputs, or complex UI
🔗 Get started: Follow the complete step-by-step tutorial: docs.jointjs.com/learn/integ…
26