
I have a mullet, Tryna make it for my family and retire my bloodline
Joined January 2023
- Tweets 19,874
- Following 1,162
- Followers 642
- Likes 40,540
3,385 Photos and videos


Pinned Tweet

18 Aug 2025
Just got fired from my 9to5. Feel numb to it just gotta be a man and get on with it.
Generational come back loading.
God bless
6
1
7
1,737
MulletMan 🏴 👨🍳 retweeted

The Rape Gang Inquiry Report.
bit.ly/4uE5odw

3,306
21,993
69,752
7,304,502
MulletMan 🏴 👨🍳 retweeted

Jun 15
Keir Starmer has ruined my country 🏴 as a white British man I’m absolutely ashamed. STAND UP PEOPLE
716
324
4,359
598,079
MulletMan 🏴 👨🍳 retweeted

Jun 15
What is going on in the UK lmao
Jun 15

JUST IN: UK Government clarifies adults will still be able to use social media by verifying their identities with digital IDs, facial recognition, passports and credit cards.
24
2
116
22,442
MulletMan 🏴 👨🍳 retweeted

Jun 12
GM
Who remembers... trillions?
51
6
172
35,054
MulletMan 🏴 👨🍳 retweeted

Pattern on bitcoin:
Top to top: around 1430 days: 2013 ➡️ 2017 ➡️ 2021 ➡️ 2025. Repeated 3 times
Bottom to bottom: around 1430 days: 2014 ➡️ 2018 ➡️ 2022. Repeated twice
Bottom to top: around 1064 days: 2015-2017, 2018-2021, 2022-2025. Repeated 3 times
Top to bottom: around 364 days: 2017-2018, 2021-2022. Repeated twice
Check the graph yourself and verify it. Obviously the first cycle we could not know this, the second cycle might have been coincidence, but after the third it is obvious a pattern is here
Paterns tend to change of course, not a lot of datapoints, but still…
If all this repeats, bottom is in October 2026, looks to be going that way again
17
14
273
22,643
MulletMan 🏴 👨🍳 retweeted

May 21
Don’t let anyone or anything stop you from dreaming big
163
89
634
16,870
MulletMan 🏴 👨🍳 retweeted

May 20
I recommend losing it all at a younger age, you’ll still experience huge personal losses at some point in your life anyways, the earlier/faster the better

18
35
572
30,825
MulletMan 🏴 👨🍳 retweeted
May 5
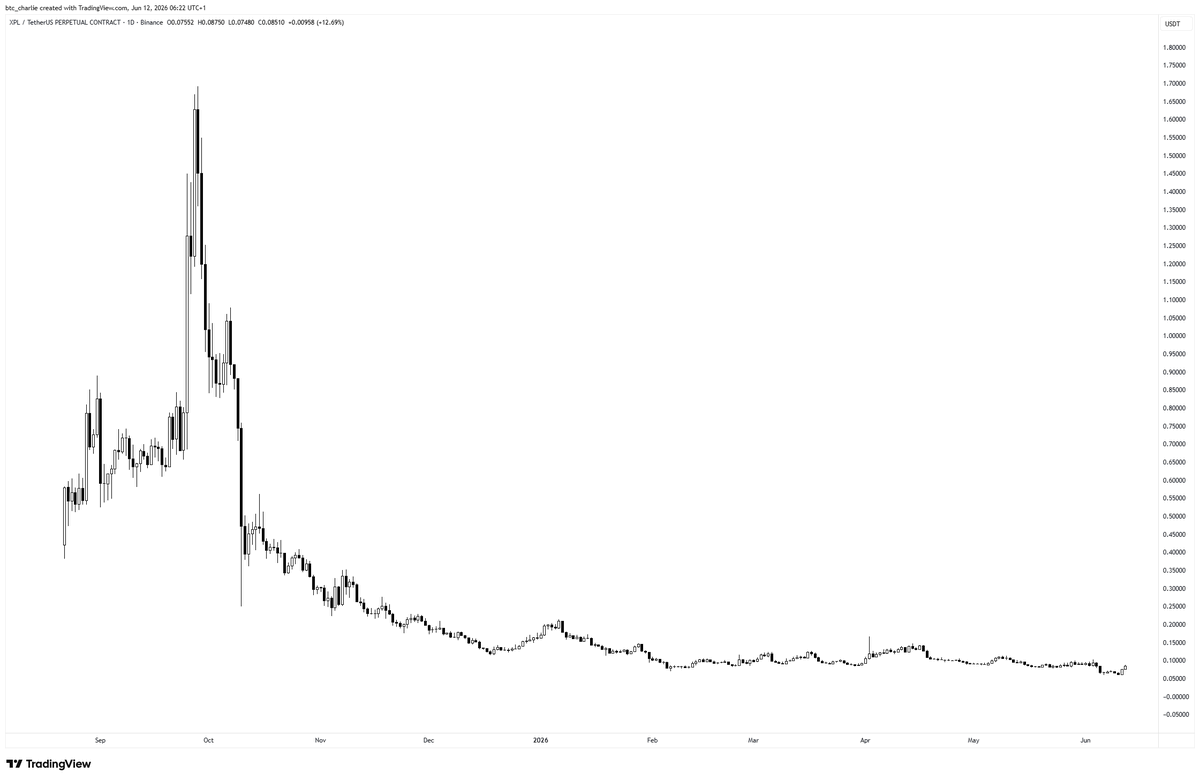
Buttcoin is ready
This could get crazy VERY fast.
Being sidelined with this one isnt wise imo, nfa of course
$buttcoin
118
88
450
15,050
MulletMan 🏴 👨🍳 retweeted

Apr 8
How it feels coming back to your prime after a long downfall
98
4,332
52,575
1,288,427
MulletMan 🏴 👨🍳 retweeted
Apr 8
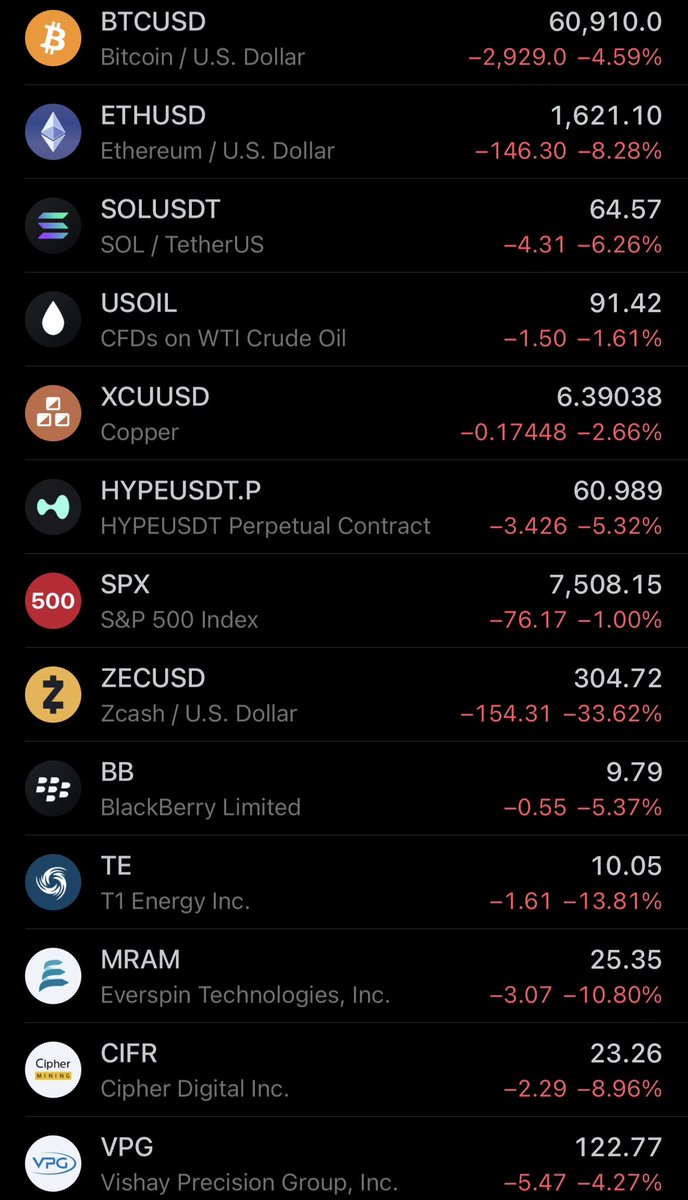
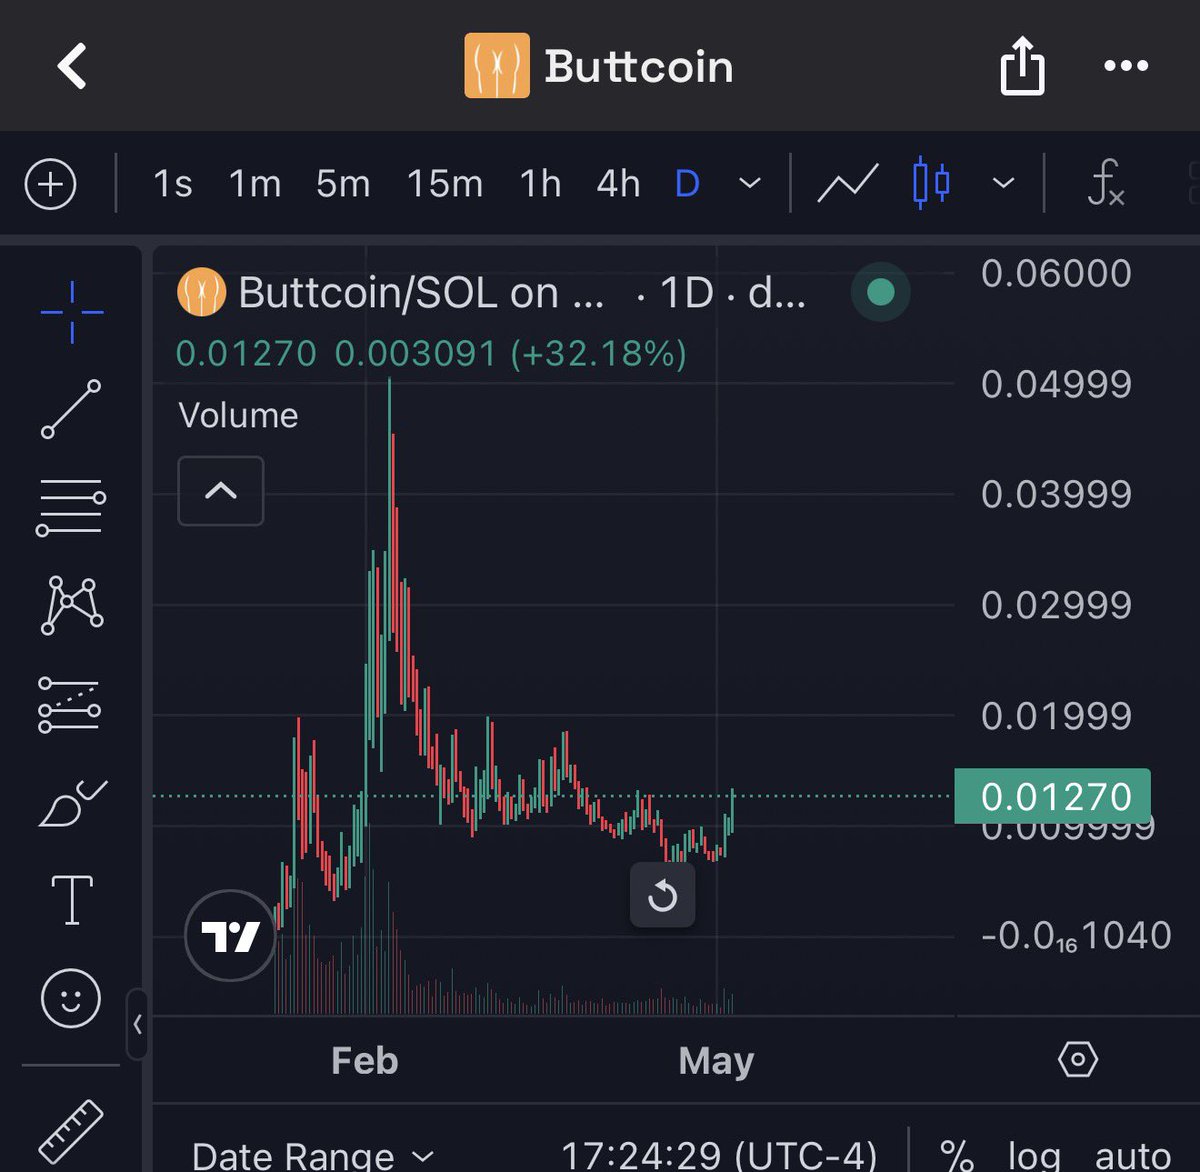
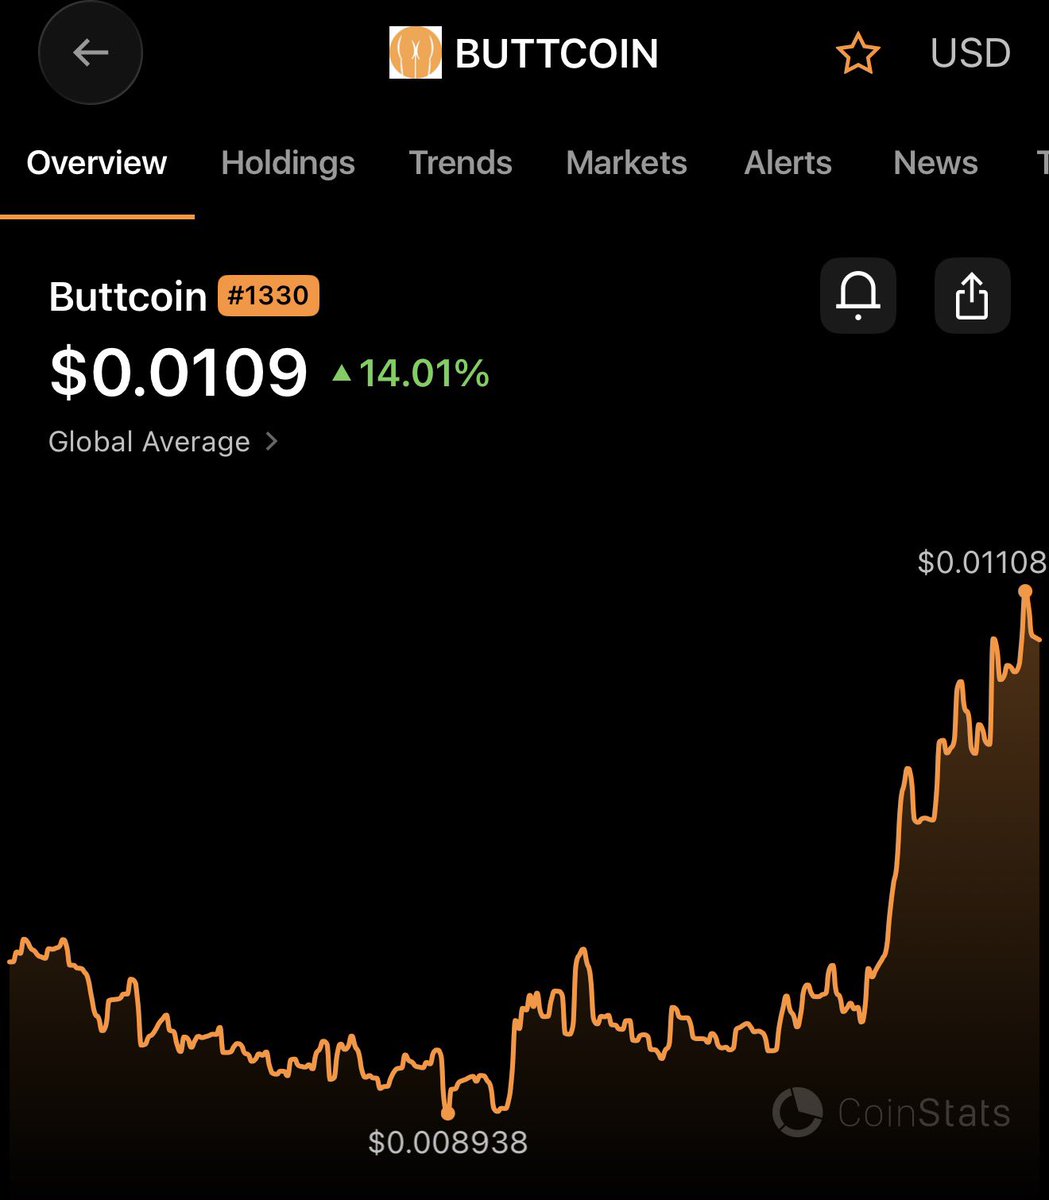
🚨Breaking news🚨
$Buttcoin is up 14% on the day after reports of a ceasefire.
Apparently People find comfort in butts.
Higher!
45
41
229
8,735
MulletMan 🏴 👨🍳 retweeted

Mar 24
Yes, yes they did
Mar 24

Did the Jews who took over TPUSA really delete all of Charlie Kirk’s videos criticizing Israel?
1
1
3
362
MulletMan 🏴 👨🍳 retweeted
Mar 24
gm
The more yall keep buying into these pvp’s
The more I buy $buttcoin
Have fun😃
139
36
356
14,343
MulletMan 🏴 👨🍳 retweeted

“Claude can now open apps, navigate your browser, fill in spreadsheets - anything you would do sitting at your desk.”
That’s literally all of white-collar work.
It is over.

You can now enable Claude to use your computer to complete tasks.
It opens your apps, navigates your browser, fills in spreadsheets—anything you'd do sitting at your desk.
Research preview in Claude Cowork and Claude Code, macOS only.
154
583
11,616
1,296,944
MulletMan 🏴 👨🍳 retweeted

Mar 16
Ben Stiller launched a soda line, made a public appearance at a grocery store and literally no one gave AF.
The world is healing.
2,012
5,881
69,393
4,383,937
MulletMan 🏴 👨🍳 retweeted

Mar 16
crazy it feels like we might be back
but the ~365 days from btc top to bear market bottom prophecy is strong
its held true every other cycle
why would it break now??????
dca spot hold, dont sell anything is my approach
if the prophecy is true again the bottom is in october
we will see
still a good place to dca btc or hype here imo
by the time $btc hits a new ath $hype will be $200
some thoughts for u on this fine day
tldr = dca and chill
we might be back or we might not be 😂
66
6
189
13,177
MulletMan 🏴 👨🍳 retweeted

Mar 6
> expected: 55,000 jobs
> actual: –92,000 jobs
pack it up boys, it's so over
Mar 6
JUST IN: The US economy lost 92,000 jobs in February.
They expected a gain of 55,000.
271
5,195
116,107
5,634,149