
Joined April 2026
- Tweets 191
- Following 2
- Followers 38
- Likes 3
78 Photos and videos


Jun 12
Kitabımın adı "Live to Sell Another Day" — yani "Yarın da Satabilmek İçin". Aslında hisse satmakla değil, zaman satmakla ilgili.
Covered call'da çoğu kişinin kaçırdığı nokta şu.
Elinde 100 adet $MSFT var, $420'dan. 30 gün vadeli $440 call'unu $5.00'a satıyorsun. Sat tuşuna bastığın an cebinde $500.
Üç şey olabilir:
- MSFT $420'de kalır -> call değersiz biter. $500 da senin, hisseler de. Maliyetin artık $415.
- MSFT $450'ye koşar -> hisseler $440'tan elinden alınır. Hisse başına $25 ($2,500) kazandın, primi de tuttun. $440-$450 arası hareketi "kaçırdın" ama bu anlaşmayı baştan kabul etmiştin.
- MSFT $400'e düşer -> $5 prim düşüşü yumuşatır. $20 yerine $15 zarardasın.
Dikkat et: üç senaryonun ikisinde kazanıyorsun, üçüncüsünde daha az kaybediyorsun. Bu şans değil. "Beklemek için para almak" tam olarak böyle görünür.
Hata covered call satmak değil. Hata onu körlemesine satmak — delta, vade ve volatilite primi nasıl şekillendiriyor hissetmeden strike seçmek.
Strategy Sandbox'ta bu pozisyonu kur, strike'ı $430'dan $450'ye kaydır. Primin küçüldüğünü, hisseyi tutma olasılığının yükseldiğini canlı izle. On dakika kaydırmak, on sayfa teoriden fazlasını öğretir.
Sanal $10K bankroll ile pratik et: optionslabpro.com
$MSFT #opsiyon
1
108
Jun 12
The title of my book — "Live to Sell Another Day" — isn't really about selling stock. It's about selling time.
Here's the part most beginners miss about covered calls.
You own 100 shares of $MSFT at $420. You sell the $440 call, 30 days out, for $5.00. That's $500 in your pocket the moment you click sell.
Three things can happen:
- MSFT sits at $420 -> the call expires worthless. You keep the $500 and your shares. Cost basis is now $415.
- MSFT runs to $450 -> shares get called away at $440. You made $25/share ($2,500) and still kept the premium. You "missed" the move from $440 to $450, but you agreed to that trade up front.
- MSFT drops to $400 -> the $5 premium cushions the fall. Down $15/share instead of $20.
Notice the pattern: in two of three outcomes you win, and in the third you lose less. That's not luck. That's what getting paid to wait looks like.
The mistake isn't selling covered calls. It's selling them blind — picking a strike without feeling how delta, days-to-expiry, and IV reshape that premium.
In the Strategy Sandbox you build this exact position and drag the strike from $430 to $450. Watch the premium shrink and your probability of keeping the shares climb in real time. Ten minutes of that beats ten pages of theory.
Practice with virtual capital: optionslabpro.com
$MSFT #thetagang
55
Jun 12
Oracle priced a ~12-13% earnings move. It printed last night and fell about 9-10%, from ~$201 into the report to ~$183 now. The band held.
An implied move is a range, not a target. ORCL dropped hard - a genuine directional miss - and still landed inside what the options market charged for it. Anyone who sold the elevated event premium got paid even though they were on the wrong side of direction, because the move came in under what was priced.
Stack it against ORCL's recent prints and the pattern is familiar: implied magnitude tends to run a touch rich versus what the stock actually delivers. That gap is the premium seller's edge - small, repeatable, and easy to give back on the one print that gaps clean through the band.
Direction is the trade everyone watches. Magnitude versus implied is the trade that actually pays the short-premium crowd. Know which one you are in before the print.
$ORCL #options #earnings
43
Jun 12
Next week is a one-event week, and the event is Kevin Warsh's first FOMC as Chair on Wednesday 6/17.
After a 4.2% CPI print - the hottest since 2023 - the market has quietly stopped pricing cuts. Roughly 97% odds of a hold next week, but about 70% odds of at least one hike by December. That is a regime flip: the question is no longer when do they cut, it is whether they have to hike into an oil shock.
The week stacks up as Mon 6/15 Empire State manufacturing, Tue 6/16 retail sales, Wed 6/17 the FOMC decision and Warsh's first press conference. SPY's options price the weekly band around that Wednesday vertical - most of the week's expected range is back-loaded into one 2pm headline.
When a week's volatility is concentrated in a single event, calendar structure matters more than direction. Selling the front and owning the event, or simply sizing down into the print, beats guessing the dots.
$SPY #FOMC #macro
1
25
Jun 11
Adobe reports tonight after the close, and the options market is pricing a ~9.2% move - roughly plus or minus $21 on a $232 stock.
That implied move is just the at-the-money straddle: the 232.5 call (~$11.35) plus the 232.5 put (~$9.90) equals ~$21.25 of premium buyers are paying for one print. Sellers collect that and keep it only if ADBE settles inside roughly $211 to $253 by Friday.
The setup is loaded. ADBE is down ~30% YTD on the fear that generative AI eats Creative Cloud instead of feeding it. The Street wants $5.81 EPS on $6.45B revenue, with a $25B buyback underneath. A beaten-down name into a binary is exactly where implied vol gets fat.
This is the classic event-vol decision: pay up for the move, or sell the inflated premium and bet the stock stays inside the band. Either way, size it like a coin flip, because that is what tonight is.
$ADBE #options #earnings
54
Jun 11
Most traders overpay for their bullish bets. Here's the math on why.
TSLA is at $200. You think it climbs to $210 in 45 days. Two ways to play it:
Buy the $200 call outright — costs $8.00. You need TSLA above $208 just to break even. That's a 4% move before you make a dime.
Or build a $200/$210 Bull Call Spread: buy the $200 call, sell the $210 call. Net cost drops to $3.50. Break-even falls to $203.50 — TSLA only has to climb 1.75%.
The trade-off: the spread caps your profit at $210. Max gain is the $10 spread width minus your $3.50 cost = $6.50 per share, or $650 per contract. That's a 186% return if TSLA hits your target.
The single call keeps unlimited upside — but you paid 2x the premium and accepted a higher break-even for a move you don't even expect to exceed $210.
And the short leg does more than cut cost: its theta partially offsets the decay on your long call, so the spread bleeds slower as time passes.
When your target is specific, capping upside you were never going to capture is basically free money.
Don't take my word for it. Drag the strikes in the Strategy Sandbox and watch cost, break-even, and max profit reprice live: optionslabpro.com
$TSLA #options
26
Jun 10
Did you know your delta can quietly betray you in the final week before expiration?
Most traders watch delta and ignore the Greek sitting underneath it: Gamma. Gamma is how fast your delta changes. And it doesn't stay constant - it accelerates as an at-the-money option approaches expiry.
Here's the trap. You sell an at-the-money call 45 days out. Delta is 0.50, gamma is low, the position feels calm. Each $1 move in the stock barely nudges your delta. Manageable.
Now fast-forward to the last week. Same strike, same 0.50 delta - but gamma has multiplied. A single $1 move can swing your delta from 0.50 toward 0.65 almost instantly. The position that felt sleepy for a month suddenly whips around on every tick - right when you have the least time to react.
That's why "it was fine yesterday" is the most expensive sentence in options. The risk wasn't in the price. It was in the acceleration.
In the Greeks Explorer, drag the DTE slider from 45 down to 10 and watch the gamma curve spike into a sharp peak right at the strike. You don't memorize this. You feel it happen.
Practice with $10K virtual capital: optionslabpro.com/pricing?ut…
$SPY #Greeks #FeelTheMarket
24
Jun 10
ADBE goes into its print Thursday after the close with a 9.2% implied move band — about $22 on a $243 stock.
The implied move band is the one-standard-deviation range the options market is pricing through Friday expiration. Roughly two-thirds of the time the stock settles inside it; one-third it breaks out. That band is the number every premium seller and every straddle buyer is negotiating around right now.
ATM IV on the event weekly sits in the low-120s. Adobe is carrying a $25B buyback underneath the print, which can soften downside follow-through but does not change what the options are pricing into the event itself.
Selling the band — iron condor or short strangle outside ±9.2% — pays if ADBE stays contained and IV collapses post-event. Buying it needs a move bigger than what is priced. Pre-print, the only honest question is whether 9.2% is too much or too little. Pick a side of that, not a direction.
$ADBE #options #earnings
30
Jun 10
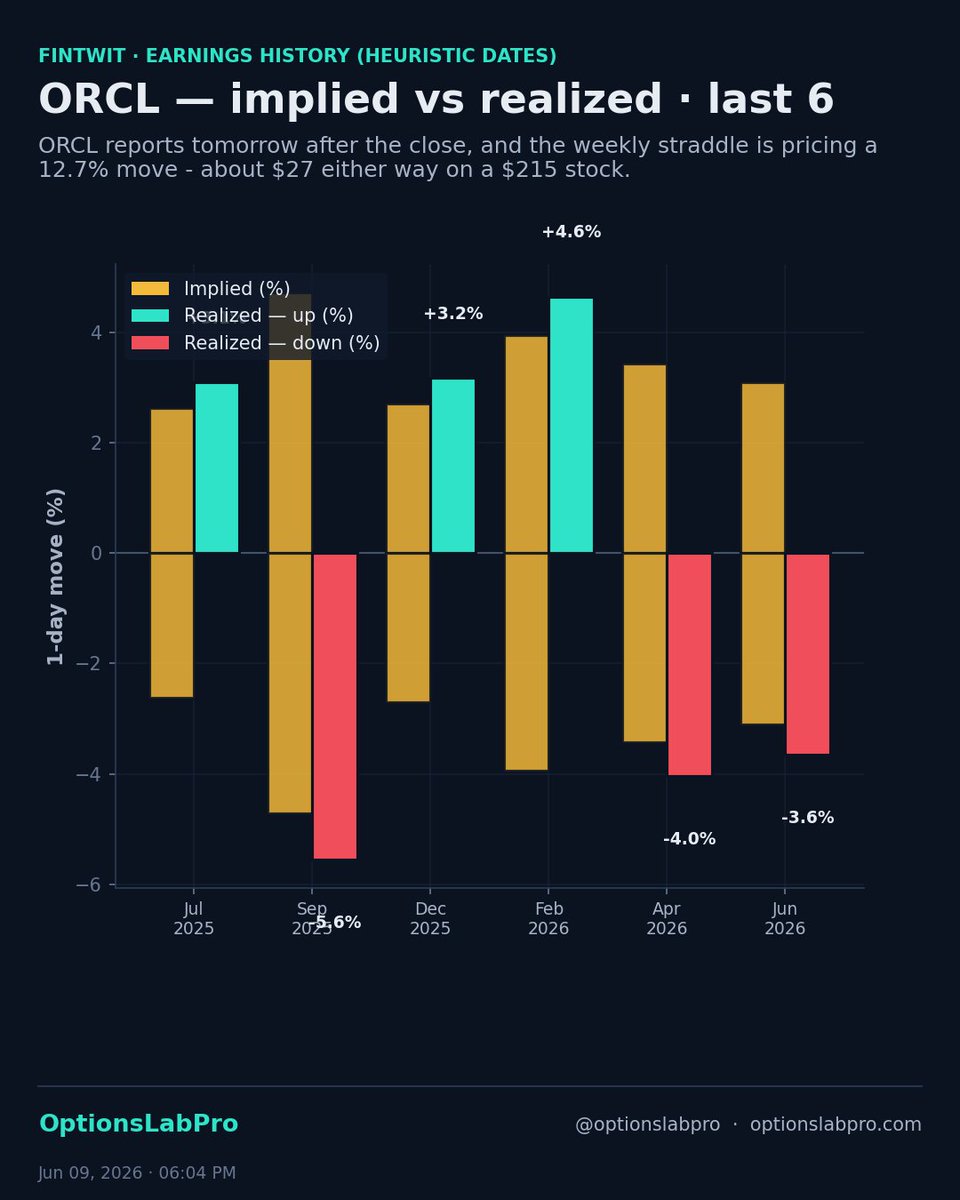
ORCL reports tomorrow after the close, and the weekly straddle is pricing a 12.7% move — about $27 either way on a $215 stock.
That number is not a forecast of direction. It is the market renting you the entire distribution through Friday. To judge whether 12.7% is rich or cheap, you do not guess — you compare it to how ORCL has actually moved on its recent prints. Implied vs realized, quarter by quarter.
ATM IV on the event weekly sits near 176%. The track record grid shows whether those options have historically over- or under-paid the people selling them into the print.
If realized keeps landing under implied, the edge is selling the band with defined risk — an iron condor or credit spread parked outside ±12.7%. If ORCL routinely blows through the band, it is a long-gamma name and you do not want to be short premium. The history picks the side, not the headline.
$ORCL #options #earnings
59
Jun 9
The session before a CPI print, VIX is sitting at 18.
That is the options market's pre-event posture: not panicked, not asleep. May CPI lands Wednesday at 8:30am, one week before the June 17 FOMC — so this print feeds straight into rate-cut odds. A hot number (consensus 4.2% YoY) pushes the next cut further out; a cool one pulls it forward.
When VIX is in the 15-20 band going into a CPI release, SPY's path over the following 10 trading days carries a measurable historical signature. The chart traces the average forward path and the ±1σ cone around it across past instances.
A sub-20 VIX into a binary macro event tells you the market is pricing the noise as contained. That is the moment to decide your posture deliberately: own event vol into the print (long strangle), or fade the post-event crush by selling the elevated front-week with a hedge. The forward-path study frames which side the history leans.
$SPY $VIX #options
1
99
Jun 9
You can be 100% right on direction and still lose money. That's Vega - the Greek nobody warns you about.
Vega measures how much your option's price moves when implied volatility shifts by one percentage point. Not the stock. The market's expectation of how much the stock will move.
Here's the trap that catches new buyers every earnings season:
Stock sits at $100. You buy the $100 call, 30 days out. IV is 80% because earnings are tomorrow - the option is loaded with fear premium. Earnings hit. The stock... stays at $100. You were dead right on direction. But IV collapses from 80% to 30%, and your call loses most of its value anyway.
That's IV crush. Vega is the dial that does the damage.
In OptionsLabPro's Greeks Explorer, the "Vega vs IV" chart shows exactly how much price you're exposed to per IV point. Then open the IV Crush simulator: pin the spot at $100, drag the IV slider from 80 down to 30, and watch the option value bleed out without the stock moving a single cent.
Feel that one drop and you'll never buy a naked call into earnings the same way again.
Try it yourself: optionslabpro.com
$TSLA #ImpliedVolatility #FeelTheMarket
31
Jun 8
Most traders pick a strategy because of how it feels. A put credit spread feels safe. A long call feels exciting. But feelings aren't edge. Expected value is.
Here's the number almost no retail tool shows you: whether a trade is actually worth taking, after wins AND losses are weighed against each other.
The Probability & EV Calculator in OptionsLabPro runs a Monte Carlo simulation, 5,000 simulated price paths, on any setup you build. Take a $TSLA put credit spread at $200 spot, 30% IV, 45 DTE. Drag the strikes and watch two numbers move in real time:
POP (Probability of Profit) - how often this trade wins across all 5,000 outcomes.
EV (Expected Value) - what it's actually worth once the rare big loss is priced in.
The lesson that breaks people: a trade can have 80% POP and still be a loser. High win rate, but the one loss is so large it eats every small win. The histogram shows you exactly where that fat left tail hides.
Flip on Casino Mode and the 5,000 paths play out one at a time. Your edge stops being a theory on a page and becomes something you can feel.
You stop asking "will this win?" and start asking "is this worth it?" That shift is the whole game.
Practice it with $10K virtual capital. Drag a slider, watch the distribution reprice: optionslabpro.com
$TSLA #thetagang #FeelTheMarket
1
40
Jun 5
Opsiyon alıcılarının çoğu aynı yerde yanıyor: yön doğru, zamanlama yanlış. Hisse beklediğin tarafa gidiyor ama opsiyon yine de eriyor. Suçlu çoğu zaman Theta — zaman erimesi.
Theta'yı en iyi anlatan benzetme: güneşin altındaki buz küpü. Her geçen gün biraz daha eriyor. Ama eriyiş sabit değil — vade sonu yaklaştıkça hızlanıyor.
Gerçek sayılarla, aynı opsiyon:
Vadeye 30 gün → günde ~$0.10 erime. Yavaş.
Vadeye 7 gün → günde ~$0.30. Hızlandı.
Son 1 gün → günde ~$1.00. Uçurum.
Hiçbir şey değişmedi — ne hisse, ne strike. Sadece takvim ilerledi ve günlük erime önce üçe, sonra ona katlandı. 0DTE opsiyonların neden bambaşka davrandığı tam olarak bu.
Alıcı için zaman düşman: hissenin HIZLI hareket etmesi şart.
Satıcı için zaman dost: sen beklerken buz senin lehine eriyor.
Bunu okumak yetmez, hissetmen lazım. Time Decay Explorer'da DTE slider'ını 45 günden 7 güne kaydır — Θ/gün çizgisinin nasıl bir duvara tırmandığını gözünle gör. O eğriyi bir kez gördükten sonra "vade sonuna birkaç gün kala kârını al" tavsiyesi ezber olmaktan çıkıp içgüdü oluyor.
Sanal $10K bankroll ile pratik et: optionslabpro.com
$QQQ #opsiyon #yatırım
35
Jun 5
The title of my book, "Live to Sell Another Day," isn't about making money. It's about not blowing up.
Selling premium is one of the most reliable edges in options — until the one trade that hands back six months of gains. I wrote the book after watching too many sellers collect $400 here, $300 there, then give it all back (and then some) on a single naked position they sized wrong.
Here's the trap. You sell a cash-secured put: collect $400, stock at $310, strike $300. Six green months. Then the stock gaps to $250 on bad news. Now you're assigned at $300 on something worth $250 — a $4,600 loss. Eleven months of those $400 credits, gone in one print.
The fix isn't to stop selling. It's to define your risk and size it so no single trade can end you.
Defined-risk version: instead of the naked put, sell a $300/$290 put spread. Max loss is capped at the width minus credit — you cannot lose $4,600, period. And never put more than 2-3% of the account on one trade, so even a max loss is a flesh wound, not a funeral.
That's the whole philosophy: small, repeatable, defined-risk income that survives the bad print — because the trader still standing next month is the one who compounds.
In the Strategy Sandbox, build the naked put, then add the long leg and watch the left tail of the payoff curve snap shut. You see the difference between "income" and "income you survive."
Practice with $10K virtual capital: optionslabpro.com
$SPY #thetagang #options
206
Jun 5
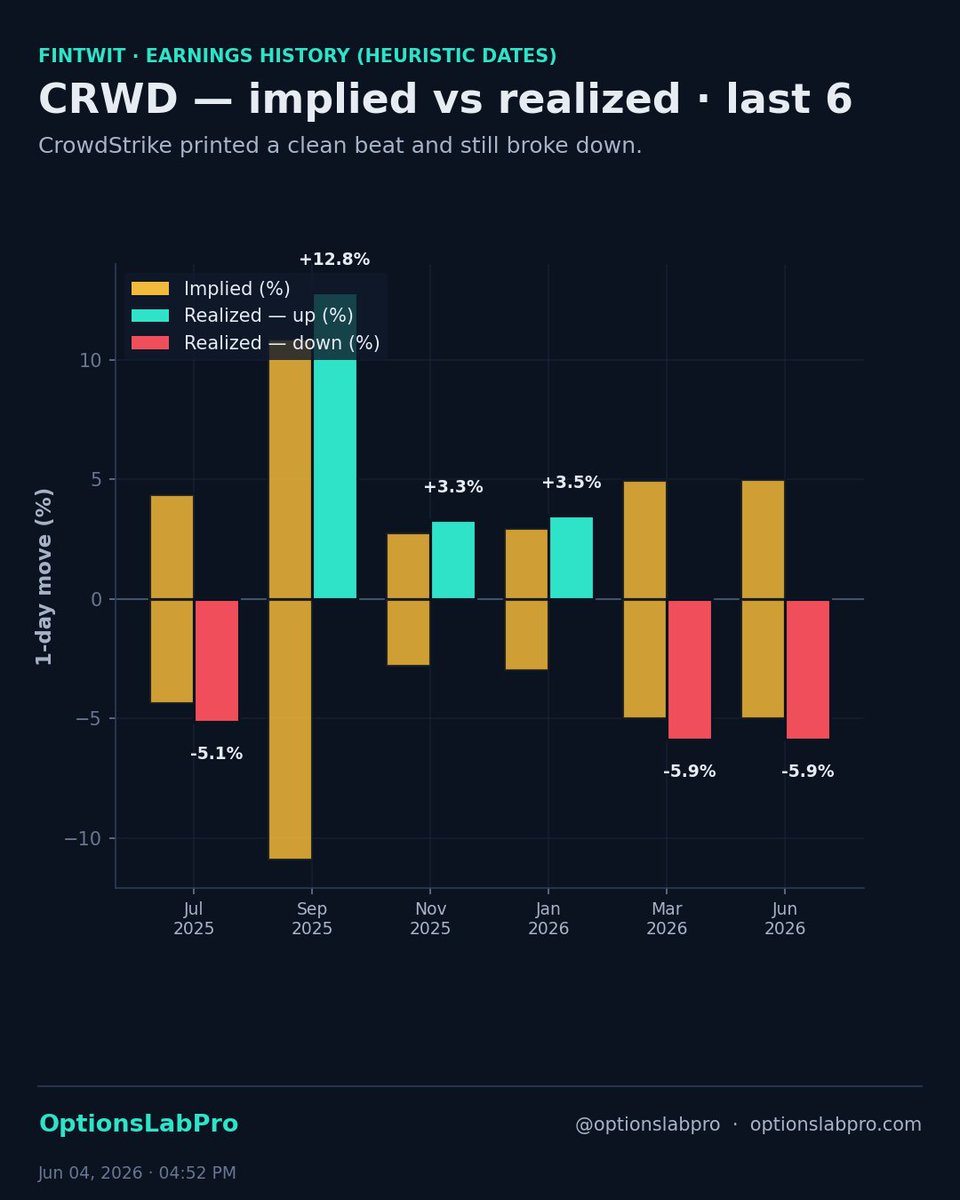
CrowdStrike printed a clean beat and still broke down.
EPS 1.10 against 0.88 expected. Record net new ARR of 256 million, up 32 percent. Record free cash flow of 468 million. Management raised full-year net new ARR guidance by 520 basis points and announced a four-for-one split.
The stock is trading near 673, down about 10 percent from yesterday's close. The options market priced a 10.5 percent move, an implied range of 684 to 847. Price is now below the lower bound.
Yesterday the read was redemption versus friction into the first clean quarter since the outage anniversary. The print resolved it to the upside on the fundamentals and the tape sold it anyway.
Same shape as Broadcom the same night. Two beat-and-raises, both priced for perfection after a vertical run, both pierced the down side of their implied band. The market is selling beats right now.
When the bar is a recovery already in the price, good is not good enough. The structure that survives respects the down-side tail, not a condor pinned to the implied bounds.
$CRWD #options #earnings
40
Jun 5
Broadcom beat last night. Revenue 22.2 billion, up 48 percent. EPS 2.44 against the 2.32 the Street wanted. AI semiconductor revenue 10.8 billion, up 143 percent. The Q3 guide raised AI semi to 16 billion, a 200 percent year-over-year ramp.
The stock is down about 15 percent from yesterday's close.
A beat-and-raise that good getting sold this hard is not about the print. It is about what was already in the price. AVGO ran roughly 80 percent in a month into this report and gained almost 19 percent the day before alone. The options market priced a 10.65 percent move. Realized blew through it.
A slightly soft software line versus the whisper was the trigger. The magnitude was the de-risking of a name everyone already owned.
The lesson lives in the implied move. It is a one-sigma estimate, not a ceiling. When a stock is priced for perfection, the asymmetry is to the downside, and the realized move can run well past what the chain quoted. An iron condor at the implied bounds got run over here.
$AVGO #options #earnings
56
Jun 4
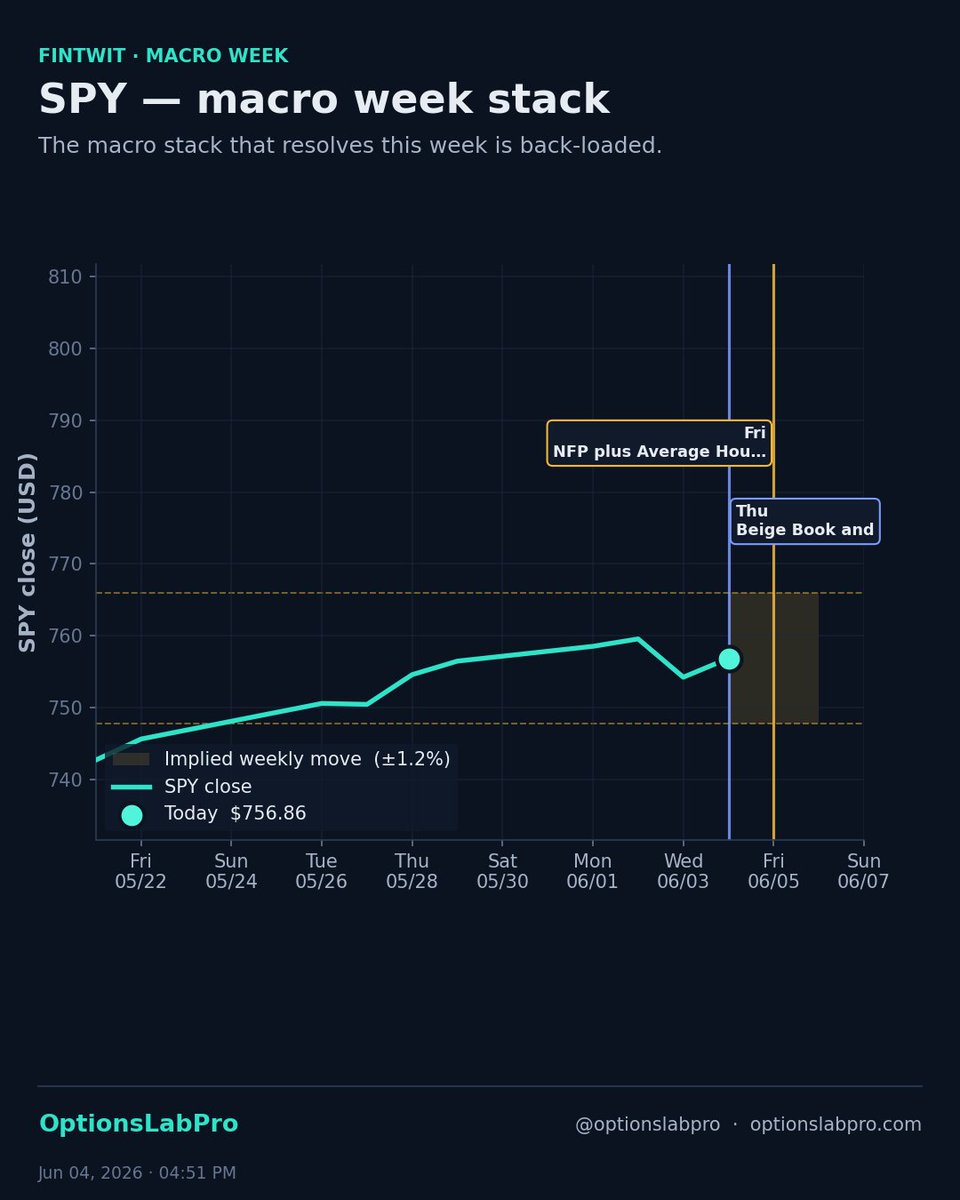
The macro stack that resolves this week is back-loaded.
SPY near 752. The Fed Beige Book lands Thursday. The May jobs report and average hourly earnings print Friday at 8:30 Eastern. Consensus is roughly 95 to 100 thousand payrolls with the unemployment rate holding at 4.3 percent.
The options market is pricing about a 1.2 percent implied move on the weekly straddle. Twenty-day realized has been running closer to 0.7 percent. Implied has sat near twice realized for two weeks.
Friday is the print that decides which way that spread closes. If wage data confirms the sticky path, the spread compresses through realized expansion as the index finally moves. If the labor side cracks, it compresses through implied collapse as the event passes.
Either way the spread is the wrong size for a jobs Friday. The index has been calm because the volatility has been living in single names, not the tape. Beige Book Thursday, NFP Friday.
$SPY #options #macro
34
Jun 4
Most beginners buy a naked call, watch theta bleed it dry, and decide options are a scam.
The problem isn't options. It's the structure.
Same bullish thesis, built two ways. TSLA at $200. You think it reaches $210 in 45 days.
The naked play: buy the $200 call for $8.00. Cost $800. Break-even $208 — you need a 4% move just to reach zero.
The Bull Call Spread: buy the $200 call, sell the $210 call. Net debit $3.50. Cost $350.
- Max loss: $350, defined the moment you enter
- Break-even: $203.50, a 1.75% move
- Max profit: $6.50 ($10 width minus $3.50 cost) = $650 if TSLA hits $210
Same view. 56% cheaper. Break-even cut roughly in half. A 186% return at your target instead of needing a bigger move just to break even on the naked call.
The catch: you cap upside at $210. If TSLA moonshots to $260 you still sell at $210. But if your thesis is moderately bullish, you were never going to ride that move anyway — so why pay for upside you don't expect?
That's the whole trade-off: you swap unlimited upside you don't need for a cheaper entry and a closer break-even.
In the Strategy Sandbox, drag the short strike from $210 to $220 and watch cost and max profit move together in real time. You feel the trade-off instead of memorizing it.
Build it with $10K virtual capital: optionslabpro.com
$TSLA #options
2
63
Jun 4
Apple's WWDC 2026 keynote opens Monday June 8 at 10am Pacific. Three trading days away.
Stock at 313.90. Up 12.5 percent over the last 21 trading days. Just broke out of consolidation.
The options market is pricing roughly a 3.5 percent implied move on the weekly straddle through the keynote. That is a tame implied for what Wall Street is calling the biggest AI catalyst of the year on Apple. The expected headline is a rebuilt chatbot Siri running on a custom Google Gemini model, with a standalone Siri app for the first time.
The implied is pricing this like a normal week. The narrative is pricing it like an earnings event.
Implied magnitudes do not have to match narrative magnitudes. When they diverge into a binary event, the option market is telling you what is in the price, not what is in the news.
The structure that fits is a long-call vertical above the implied band, not a straddle at it. The setup pays if the post-keynote tape extends the 21-day breakout. The implied band caps your premium spend at the level the market thinks does not need to be hedged.
$AAPL #options #fintwit
101
Jun 4
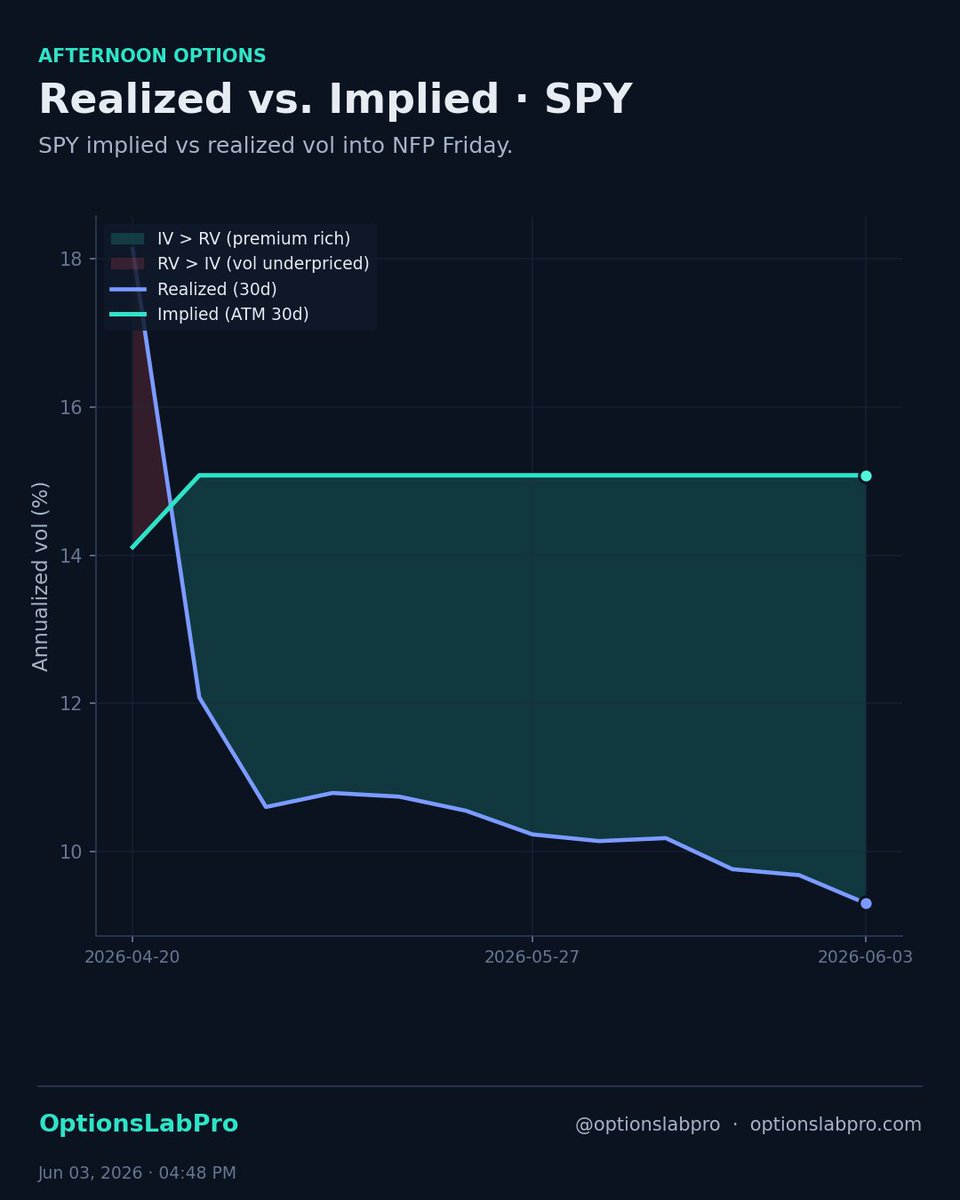
SPY implied vs realized vol into NFP Friday.
The weekly straddle is pricing about 1.2 percent. Realized vol over the last 20 sessions is closer to 0.7 percent. Implied is sitting almost twice realized. The spread has been wide for two weeks.
Two reads. First, the macro stack does the work the index has not done. ADP this morning. ISM Services this morning. Beige Book Thursday. NFP Friday. Four data prints in three sessions. Friday is the catalyst that resolves the spread.
Second, the dispersion is in single names, not the index. AVGO and CRWD print tonight at the same implied magnitude with opposite directional asymmetry. WWDC opens Monday. The index is calm because the moves are happening underneath in distinct names. Implied vol on the index is rich for the realized regime, but it is the right hedge against single-name dispersion that does not show up in SPY itself.
If NFP confirms the wage-sticky path the spread compresses through realized expansion. If NFP cracks the labor side the spread compresses through implied collapse. Either way the spread is the wrong size for NFP week.
The structure is a short SPY weekly straddle paired with long single-name premium. The volatility is in the names, not the index.
$SPY #options #fintwit
32