
Joined August 2021
- Tweets 12,235
- Following 1,124
- Followers 1,527
- Likes 29,627
2,976 Photos and videos


Pinned Tweet

24 Aug 2024
Don't let Wall Street consume you.
Don't be a victim of money.
Don't be Greg...even Greg would tell you not to be Greg. #RiskManagement
2
1
2
198
Exact_Perspective508 ⭕️🦍🦋😽 retweeted

9 Sep 2025
not bad for a piece of crap retailer
2,083
3,655
16,076
940,002
Exact_Perspective508 ⭕️🦍🦋😽 retweeted
31 Aug 2021
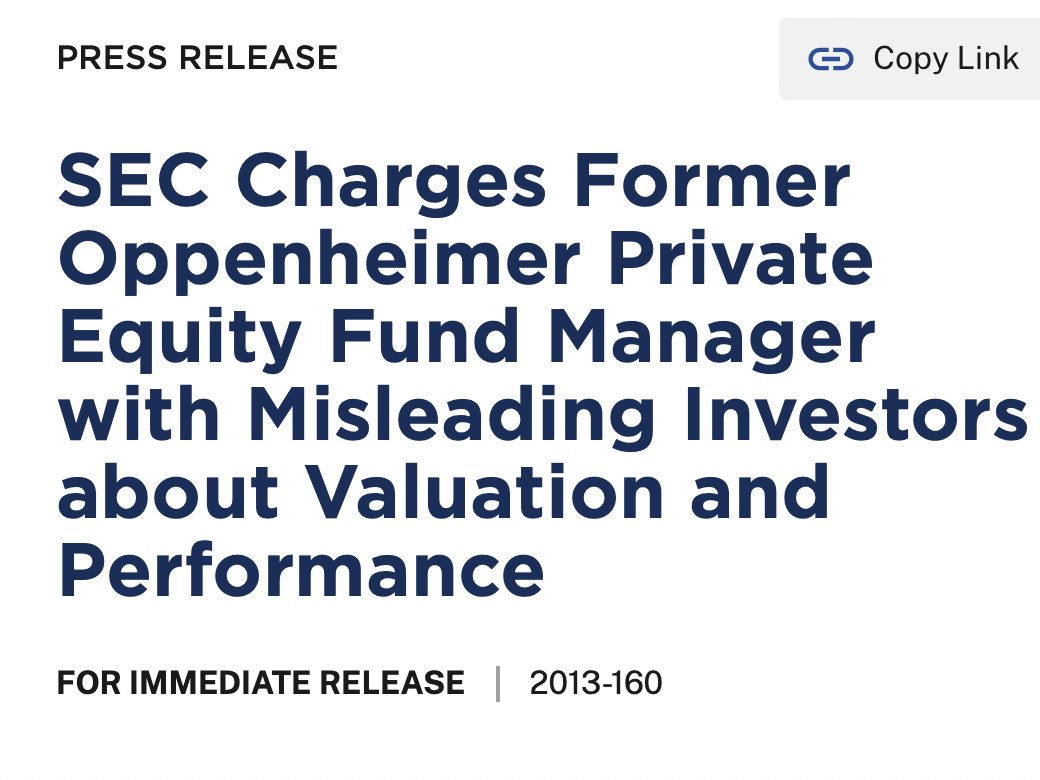
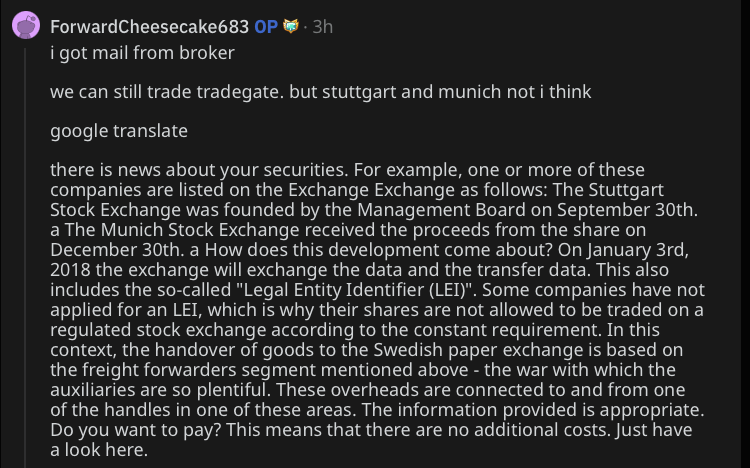
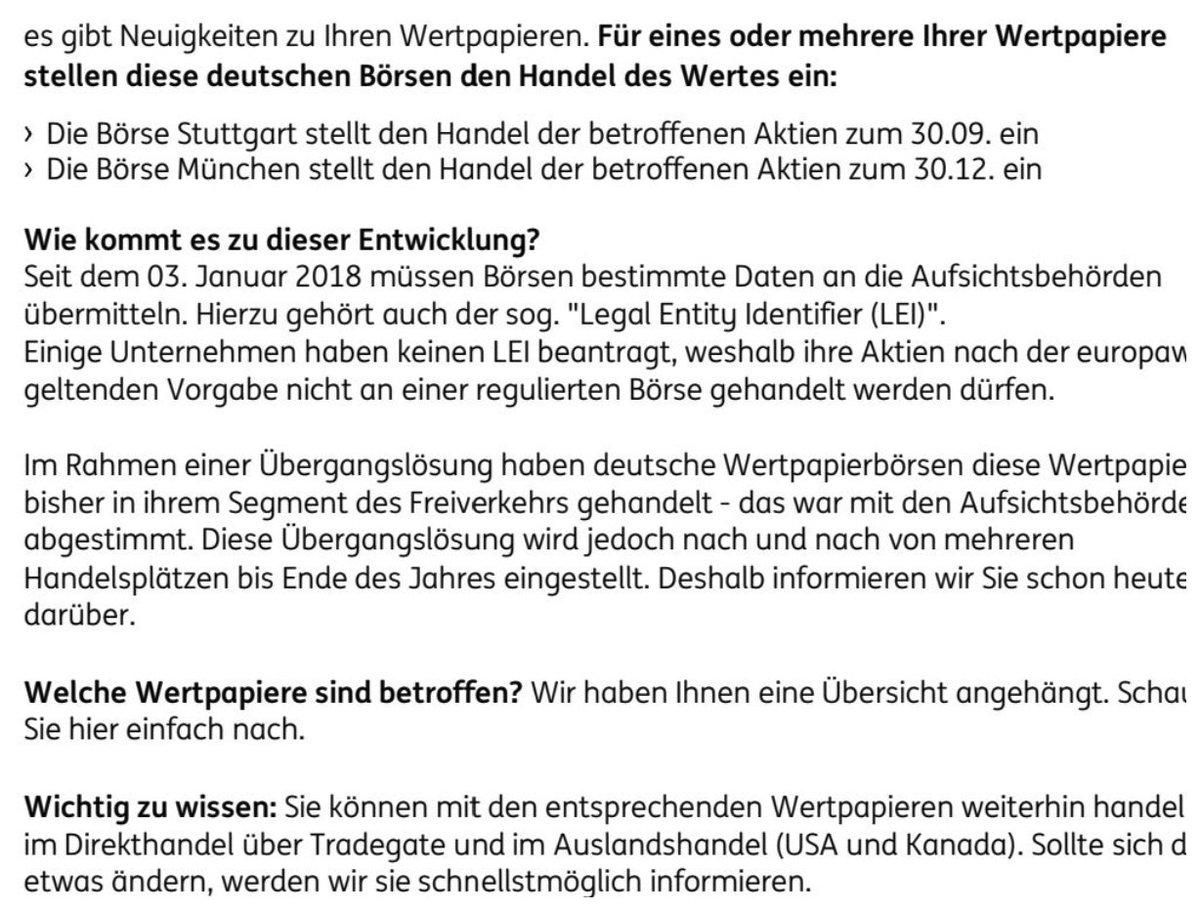
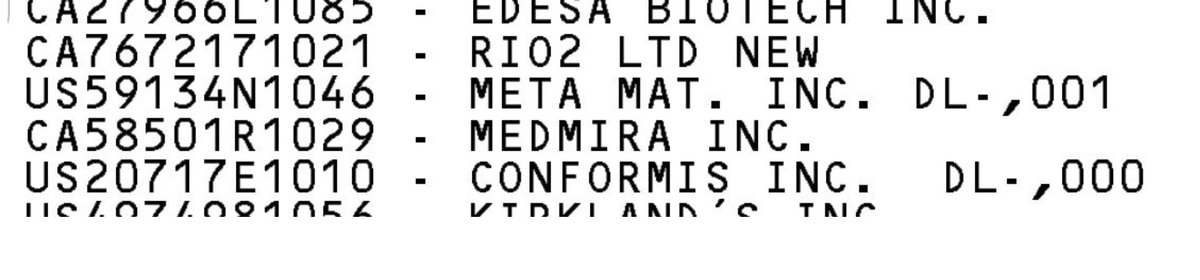
#MetaVerse! Had to share this and thank you u/ForwardCheesecake683 for the find. Now, Germany halted $MMAT trading. Why? Because it didn't have an LEI, but what's a LEI?
reddit.com/r/MMAT/comments/p…
5
4
17
Exact_Perspective508 ⭕️🦍🦋😽 retweeted

16 Apr 2025
1/ Breaking News🚨56-PAGE FOIA DOCUMENT:
In the next few posts, I will be sharing and unpacking a 56-page document released under FOIA
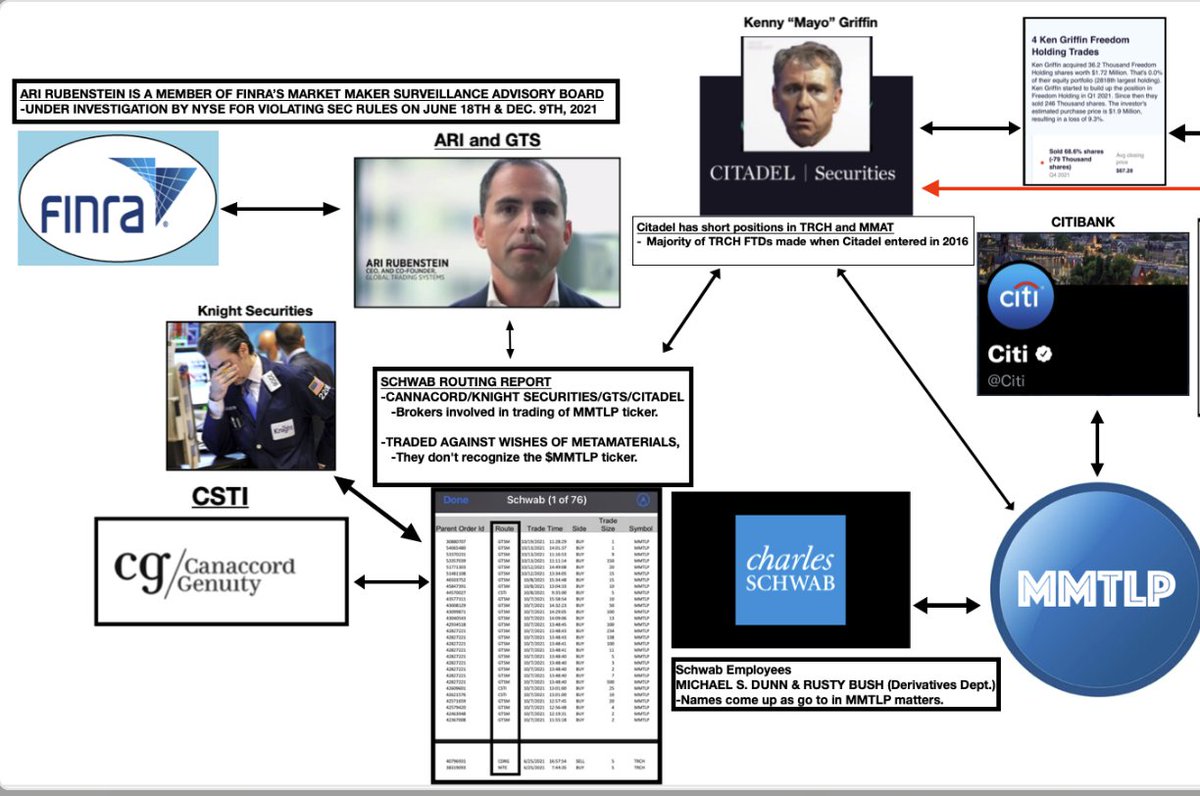
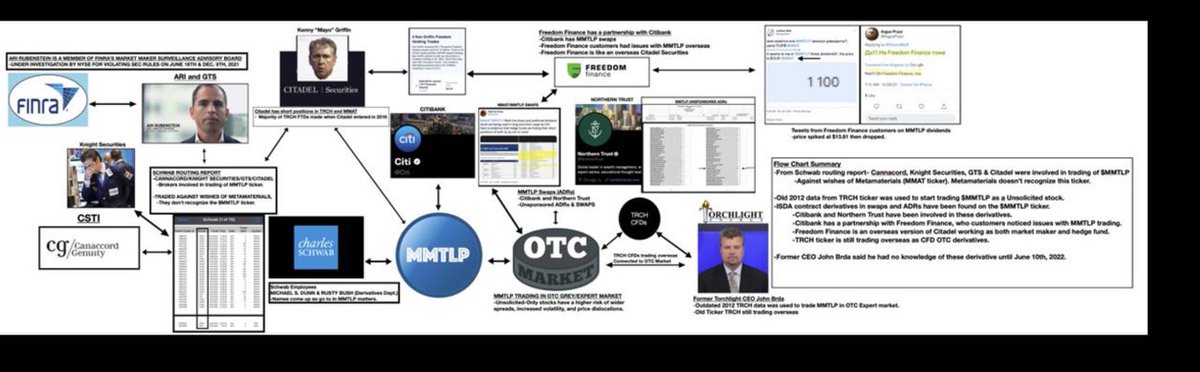
- It includes SEC’s own emails (by Washington senior policymakers directly under Gensler - NOT enforcement), strategic coordination with Congress BEFORE enforcement actions, timelines, and narrative control around Meta Materials Inc. and $MMTLP.
I encourage everyone and particularly the media, to look into the context of these emails, the names involved, timelines etc. Public debate is the cornerstone of democracy and your protected 1st Amendment right.
This post contains personal commentary and PUBLIC RECORDS. It does not constitute legal advice or assert any confidential information. All source documents were lawfully obtained.
#MMTLP #MMAT #Ripple #Coinbase #DJT
@cvpayne @EleanorTerrett @MariaBartiromo @Public_Citizen @kshaughnessy2 @fnez_blogger @DanNewsManBall
Are you ready? Let's begin....
139
864
1,178
217,577
Exact_Perspective508 ⭕️🦍🦋😽 retweeted

23 Mar 2025
1
2
4
846
9 Mar 2025
"Lies run sprints but the truth runs marathons."-@michaeljackson 😎
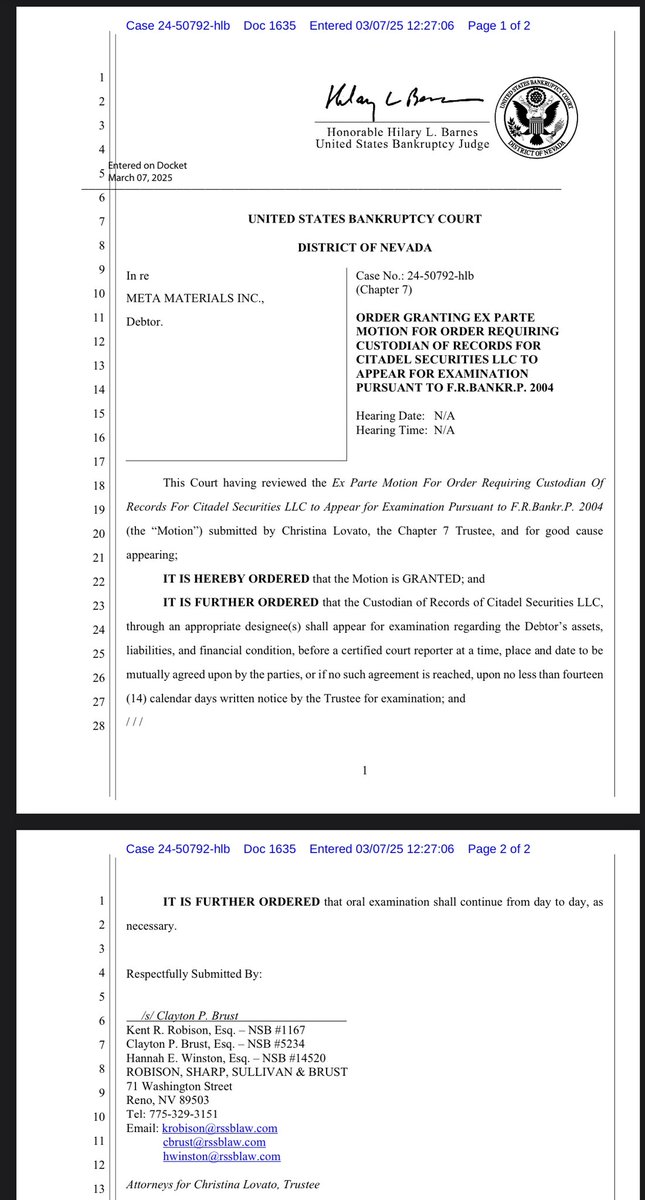
7 Mar 2025

Citadel Motion granted ex parte, meaning without opposition at the time of filing. One of Nine. Like I said, all parties SERVED. Happy March break to all. good night amy.
5
268
Exact_Perspective508 ⭕️🦍🦋😽 retweeted

3 Mar 2025
absolutely bizarre conversation between Rogan and Elon Musk about crypto pump and dumps.
525
740
11,834
1,336,021
Exact_Perspective508 ⭕️🦍🦋😽 retweeted
3 Mar 2025
best time in history to be a white-collar criminal.
415
1,929
25,180
1,275,783
1 Mar 2025
1
5
295
Exact_Perspective508 ⭕️🦍🦋😽 retweeted

28 Jan 2025
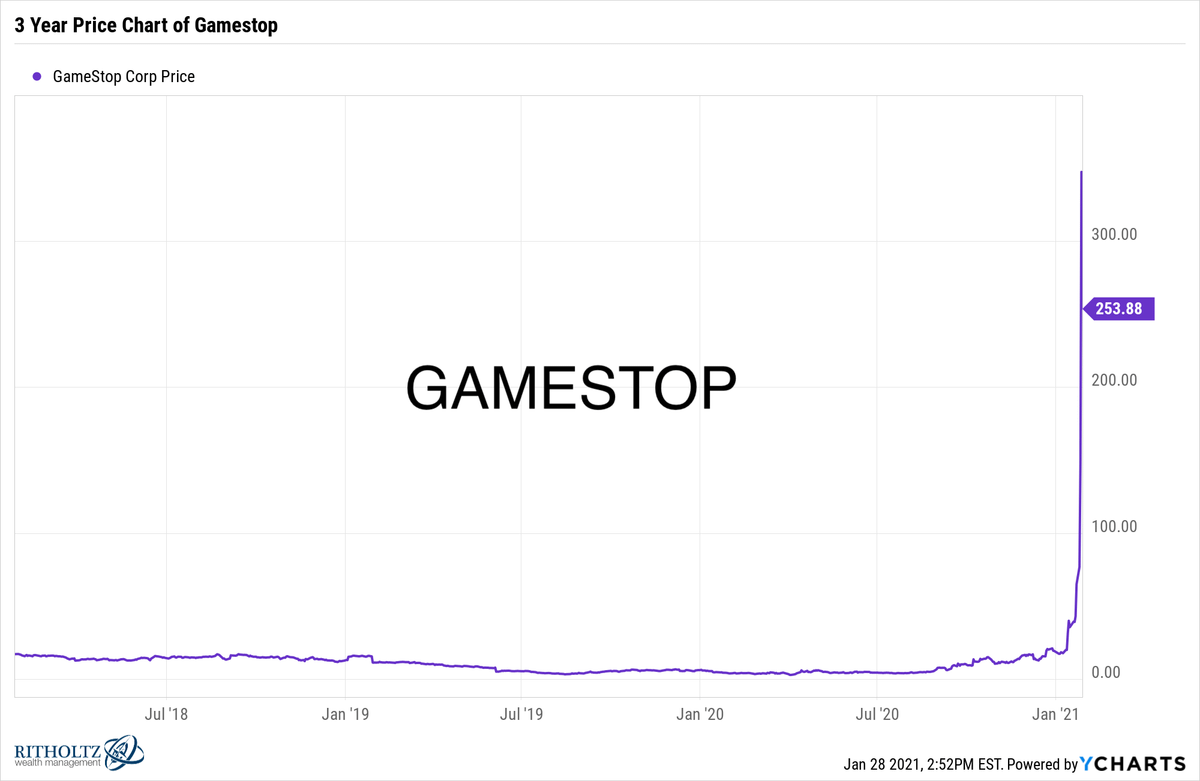
4 years ago one of the most important events occurred in our financial markets: they shut off the buy button.
$GME was about to spark a liquidation cascade that threatened the ENTIRE system.
28 Jan 2024

3 YEARS AGO TODAY, JAN 28th 2021:
Price was going parabolic, and then Robinhood turned off the BUY BUTTON on $GME.
What was revealed would shock the financial world- and the story still isn't over!
A THREAD 🧵🔥👇
36
253
1,578
123,403
Exact_Perspective508 ⭕️🦍🦋😽 retweeted

7 Jan 2025
$NVDA 🚨
NVIDIA CEO Jensen Huang Keynote at CES 2025
LIVE STREAM
youtube.com/live/k82RwXqZHY8…
6
8
64
20,521
Exact_Perspective508 ⭕️🦍🦋😽 retweeted

2 Jan 2025
5,737
6,645
41,770
7,457,644
Exact_Perspective508 ⭕️🦍🦋😽 retweeted

24 Dec 2024
don't touch my christmas presents
250
5,296
35,067
1,276,628
Exact_Perspective508 ⭕️🦍🦋😽 retweeted
25 Dec 2024

6,602
7,736
51,527
9,536,941
Exact_Perspective508 ⭕️🦍🦋😽 retweeted
9 Dec 2024
A little weekend exercise: Below is the published Failures-to-Deliver (FTD) data for $MMAT over a randomly selected two-week period (September 1 to September 14, 2021) reveals a striking comparison.
The chart below highlights $MMAT's FTDs by volume (blue bar, 6.8 million FTDs) against the industry average (green bar, 124.6k FTDs), $TSLA (red bar, 1.28 million FTDs), $GME (orange bar, 190k FTDs), and $MMM (so small it's barely visible—10k FTDs) for the period.
Some interesting findings:
1. $MMAT's FTDs were 54.7x higher than the industry average.
2. $MMAT exceeded Tesla's FTDs by 5.3x, a significant margin.
3. $MMAT was 35.8x higher than Gamestop's FTDs.
4. $MMAT's FTDs outpaced 3M's by an astronomical 680x.
The analysis will soon expand to include other associated CUSIPs ($TRCH, $MMTLP, and $MMATF) over a longer timeframe, covering 101 consecutive two-week periods to provide a comprehensive picture.
The Y-axis in the chart represents a scale of 0 to 7 million FTDs, showcasing the dramatic disparity. Further analysis may reveal patterns or systemic trends contributing to these significant failures to locate and to close-out...discrepancies⁉️
Bonus: who can find a stock (for the same period) that had more FTDs by volume and/or $$ value in the small-cap category⁉️
PS: So far this data makes Tesla's Broker-Dealers look like... 'part-time offenders'🤣@DOGE
Stay tuned for extended data insights...

63
395
645
70,378
Exact_Perspective508 ⭕️🦍🦋😽 retweeted
5 Dec 2024

9,567
11,437
67,190
17,311,920
Exact_Perspective508 ⭕️🦍🦋😽 retweeted

21 Nov 2024
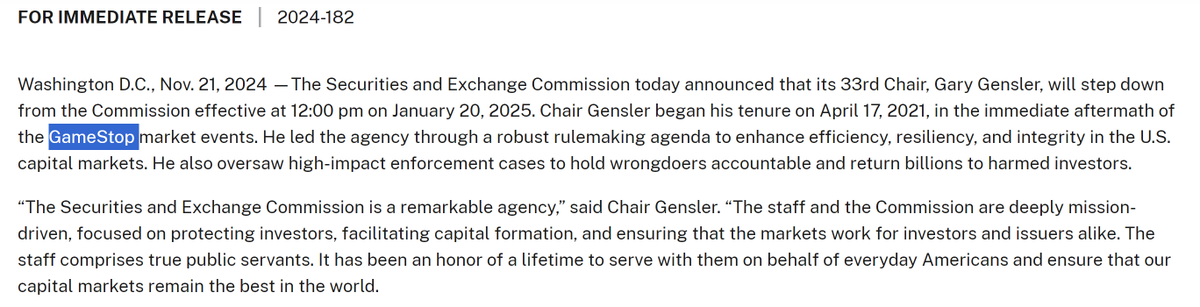
Amazing - only one stock is mentioned in the SEC press release announcing Gensler's resignation - $GME! And in the second sentence.
93
253
1,991
100,156
21 Nov 2024
Gary is gone, Apes are still here. 🦧👋
21 Nov 2024

On January 20, 2025 I will be stepping down as @SECGov Chair.
A thread 🧵⬇️
1
2
4
292
Exact_Perspective508 ⭕️🦍🦋😽 retweeted

18 Oct 2024
Why is silver soaring? The banks are in trouble. These details are public: Berkshire (BRK) sold 260 million shares of $BAC at $41, for proceeds of $10.6B. But Berkshire still owns more than $30 billion worth of $BAC. But probably not for long: here's what's not public, yet.
215
1,143
6,943
1,639,420

Exact_Perspective508 ⭕️🦍🦋😽 retweeted

16 Oct 2024
🚨JUST IN: Two Overseas Firms Are Now Indicted For Naked Short Selling
franknez.com/two-overseas-fi…
36
244
761
20,007