
Market research specialist & ex journalist interested in energy & tech. Bilingual (English/Japanese), father/EV owner/music geek. All comments are mine.
- Tweets 20,939
- Following 579
- Followers 908
- Likes 930


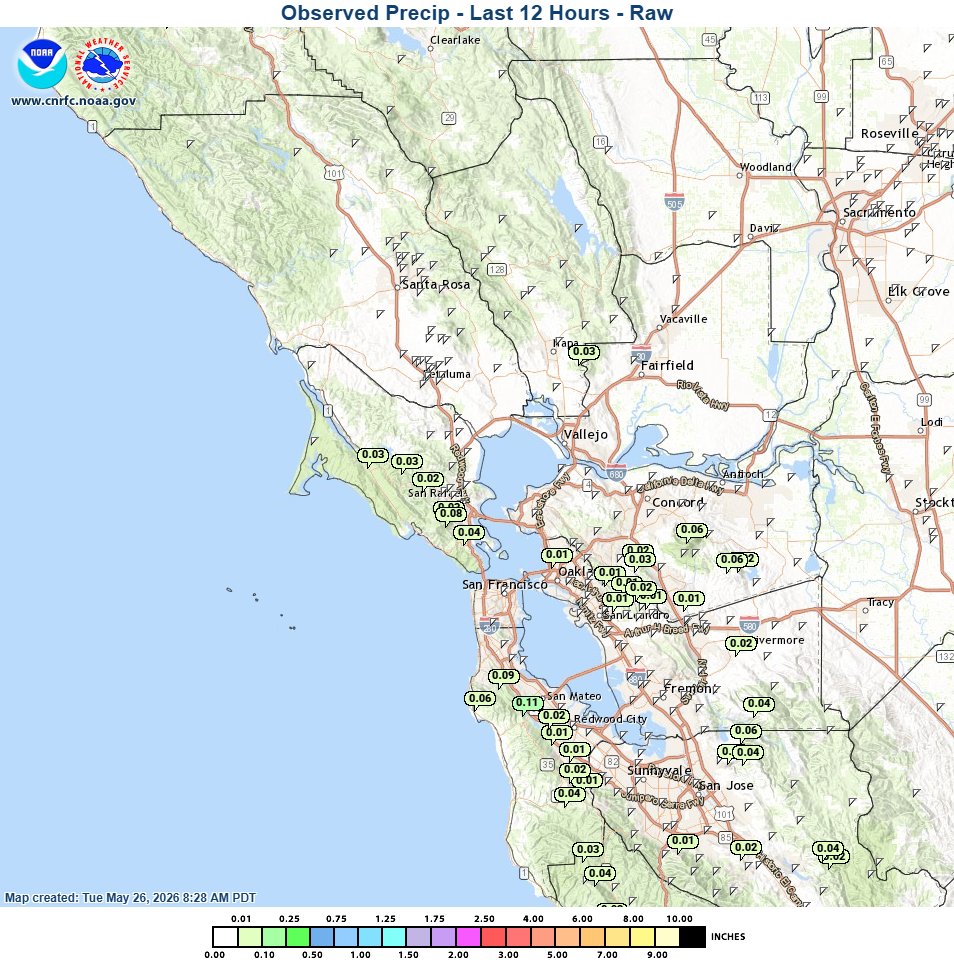
ALT A National Weather Service regional map showing observed 12-hour raw precipitation totals for the San Francisco Bay Area and North Bay, created on Tuesday, May 26, 2026, at 8:28 AM PDT. The map features a light green terrain background overlaid with dozens of small, circular green data bubbles containing rain totals in inches. Most numbers throughout the North Bay, East Bay, and South Bay range from 0.01 to 0.06 inches. The highest totals are clustered along the San Francisco Peninsula near San Mateo, showing values up to 0.09 and 0.11 inches. A precipitation scale is displayed at the bottom, indicating all totals are under a quarter of an inch.
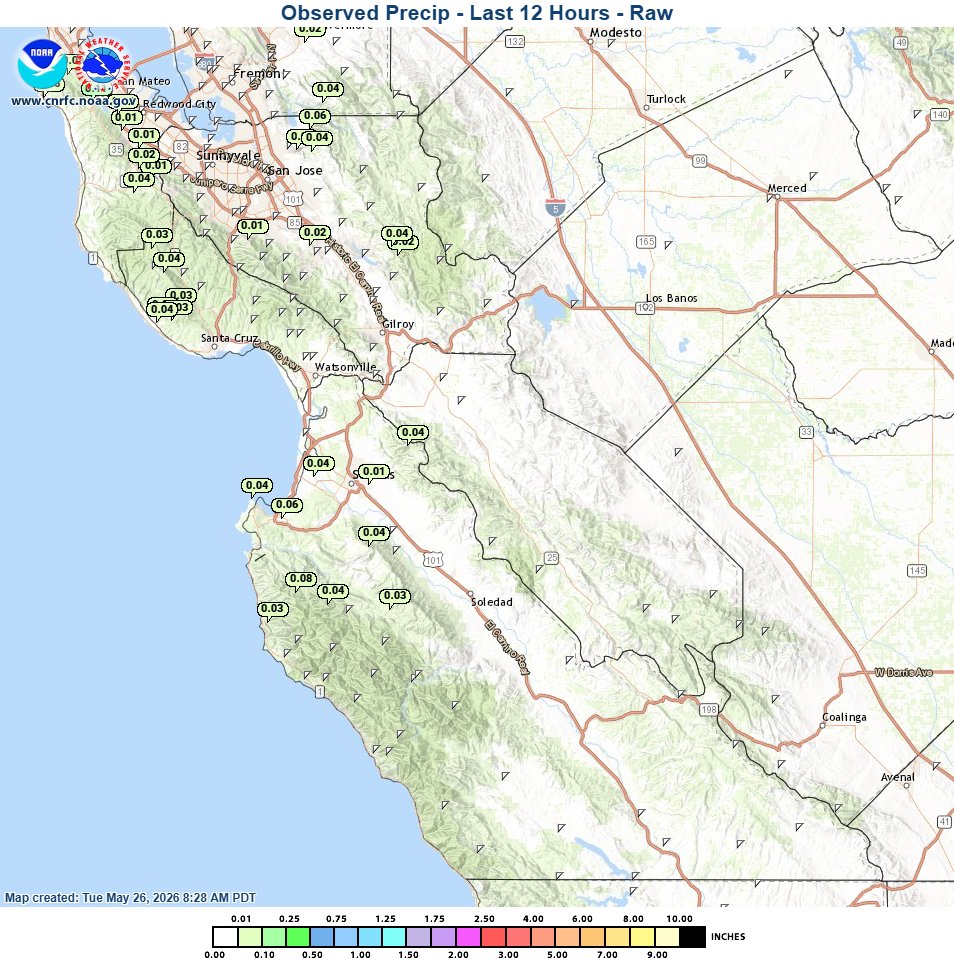
ALT A National Weather Service regional map showing observed 12-hour raw precipitation totals for the California Central Coast, created on Tuesday, May 26, 2026, at 8:28 AM PDT. The map captures the coastline stretching from Santa Cruz down past Big Sur and Soledad. Scattered small green data bubbles mark light precipitation totals ranging from 0.01 to 0.06 inches across Santa Cruz, Watsonville, and coastal areas. The maximum accumulation of 0.08 inches is observed along the rugged coastal mountains of Big Sur. The precipitation color-scale bar at the bottom confirms values remain entirely within the lowest bracket (under 0.25 inches).