
Tweets my own | Interested in community and regional development | @PurdueAgEcon Associate Prof. | @LifeAtPurdue VP for Engagement
Joined July 2009
- Tweets 10,313
- Following 1,234
- Followers 1,409
- Likes 1,326
1,101 Photos and videos


Roberto Gallardo retweeted

May 19
First: US business applications are diverging. Total new filings are accelerating — but applications likely to hire employees have stalled. The gap is a signal of solopreneurs. We think in part AI tools are lowering barriers to launching a business without ever adding payroll. /2

8
20
75
139,902
Roberto Gallardo retweeted

SOARING HIGHER: Purdue Engineering is now the No. 2 ranked public engineering college in the country.
With three specialties in the Top 5 and eight in the Top 10, our 2026 research and graduate engineering performance builds on this triple crown of national distinctions:
-No. 1 producer of engineering graduates
-No. 1 engineering college for market demand
-No. 1 ranked online engineering master’s degrees in all 5 specialties ranked by @usnews
More: bit.ly/41fFIHY
#VictoryLap #VictoriesAndHeroes
4
35
239
12,802

May 20
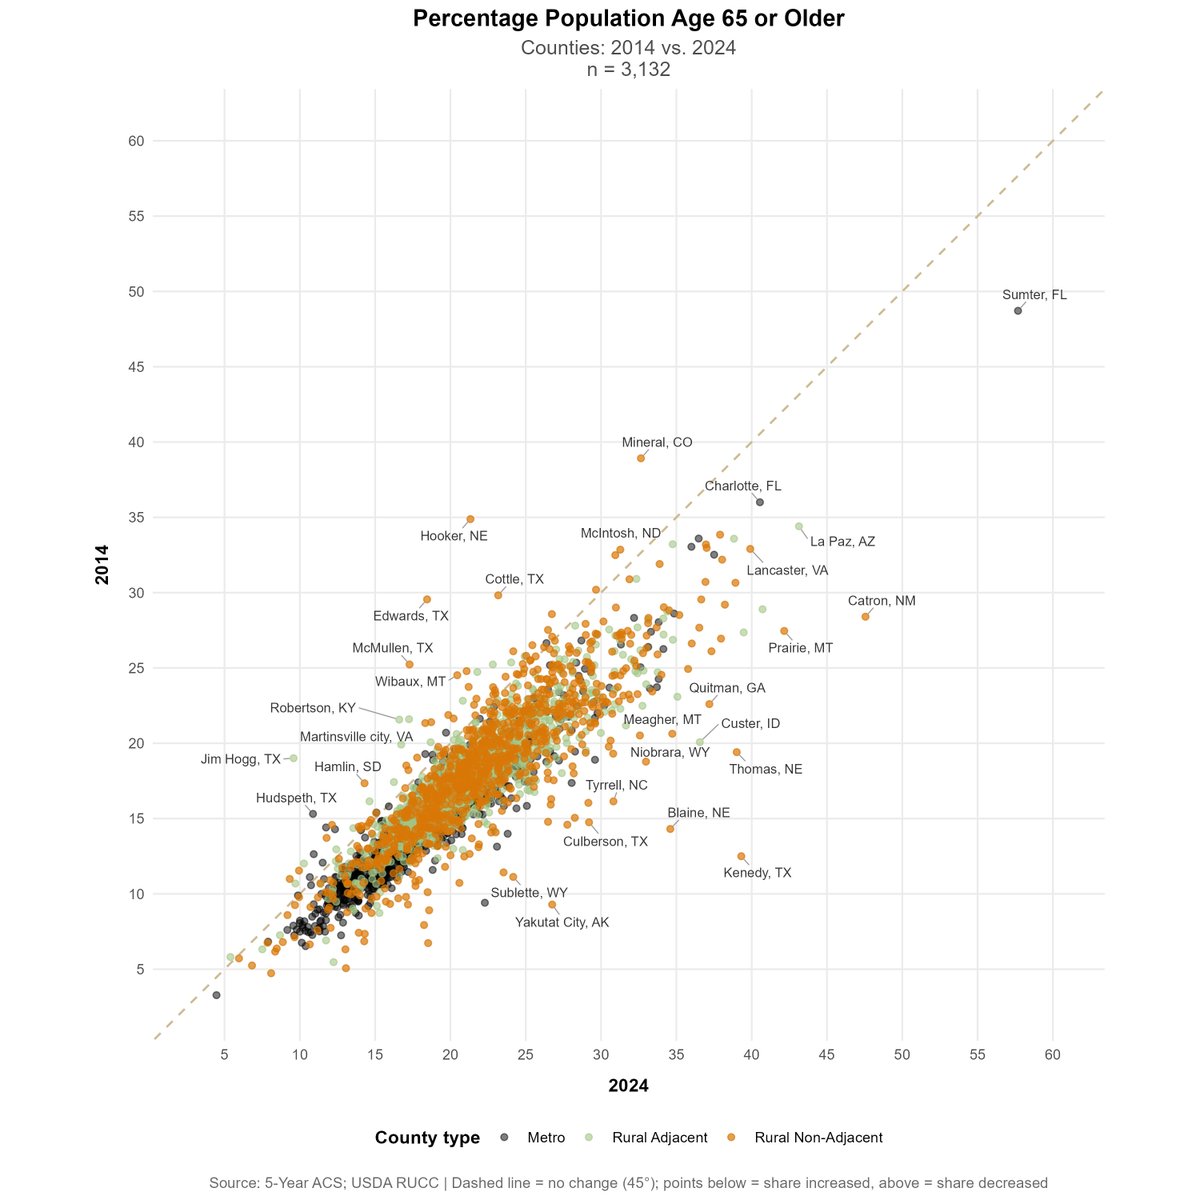
#DataInsights
According to the 5-Year ACS from the @uscensusbureau, females ages 16 to 64 increased by a little more than 2.5 million between 2014 and 2024. Of these, 69.5% were in the labor force in 2014, increasing to 71.8% in 2024. In raw numbers, more than 4.2 million joined the labor force, a ratio of about 1.6. Males age 16 to 64 increased by roughly 4.3 million during this period. Of these, 78.1% were in the labor force as of 2014, increasing to 79.2% in 2024. In raw numbers, a little more than 4.5 million joined the labor force, a ratio of 1.
In other words, more females joined the labor force after controlling for their respective overall increase.
By the way, if the female labor force participation rate were the same as the male rate as of 2024, the labor force would have 7.7 million more workers.
30
May 18
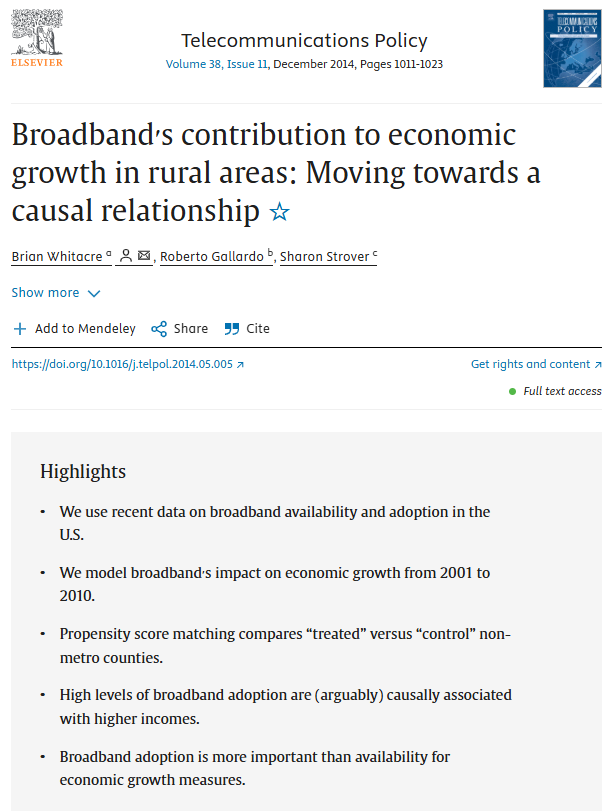
"The OpenVault report also compared the way that homes and businesses use broadband. The analysis showed that households use 23 times more download than upload. For households, video represents 48% of all download data use. Businesses use broadband in a very different way, and businesses use 7.3 times more download than upload. Said a different way, businesses use a lot more upload, with 20% of all business usage used to connect to the cloud."
potsandpansbyccg.com/2026/05…
31
Roberto Gallardo retweeted

May 14
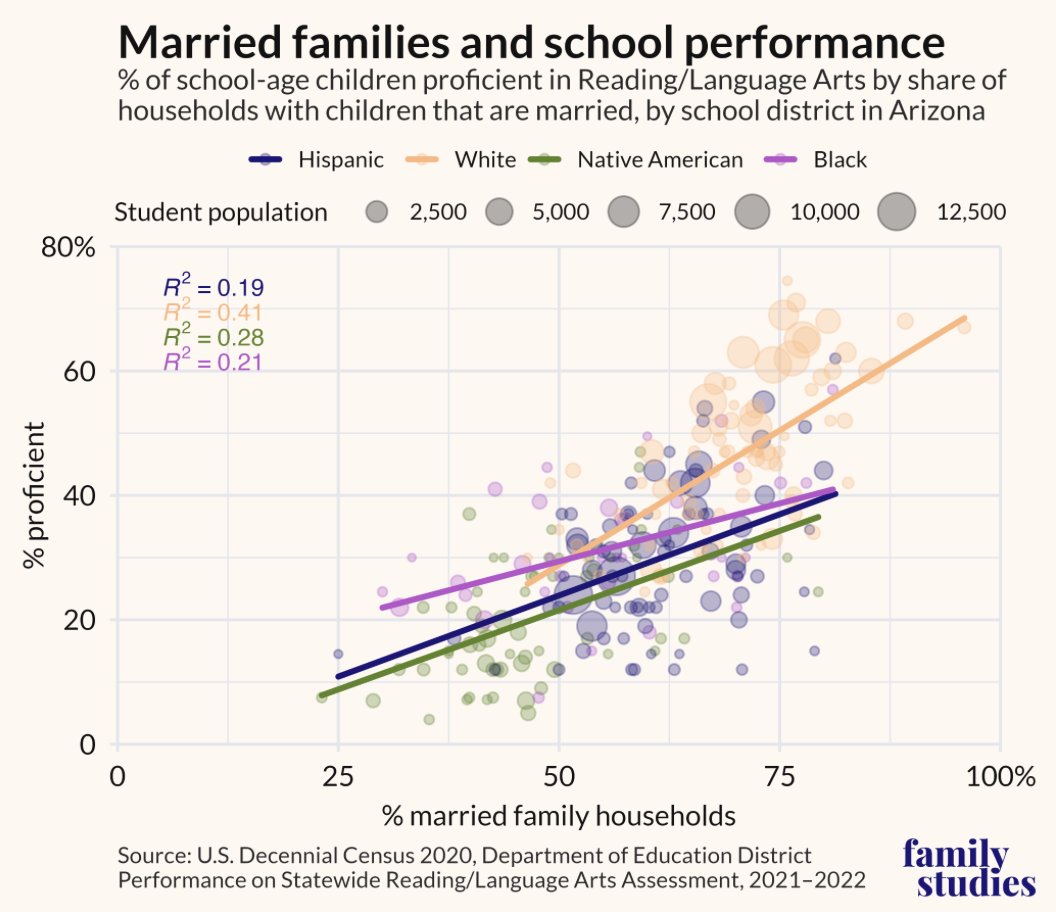
What predicts kids' reading proficiency across Arizona school districts better than race, ethnicity, or family income?
The share of married families.
A truth almost never mentioned in education circles.
New @FamStudies @azpolicy:
18
96
322
27,235
May 14
Public Policy 101: define a problem. #rural is almost always measured using variables developed with #urban communities in mind. This leads to distorted findings/measurements, followed by incorrect or misaligned solutions.
In addition, there is no parity between #rural and #urban when it comes to many things. Both are running a marathon. One is running it with a backpack filled with rocks.
Consider grantmaking organizations: a report from @USDA found that "of the roughly 75,000 grantmaking organizations active in the U.S. between 2014 and 2021, just 6,300, or 8% were based in a rural community"
rd.usda.gov/media/file/downl…
1
47
Roberto Gallardo retweeted

May 12
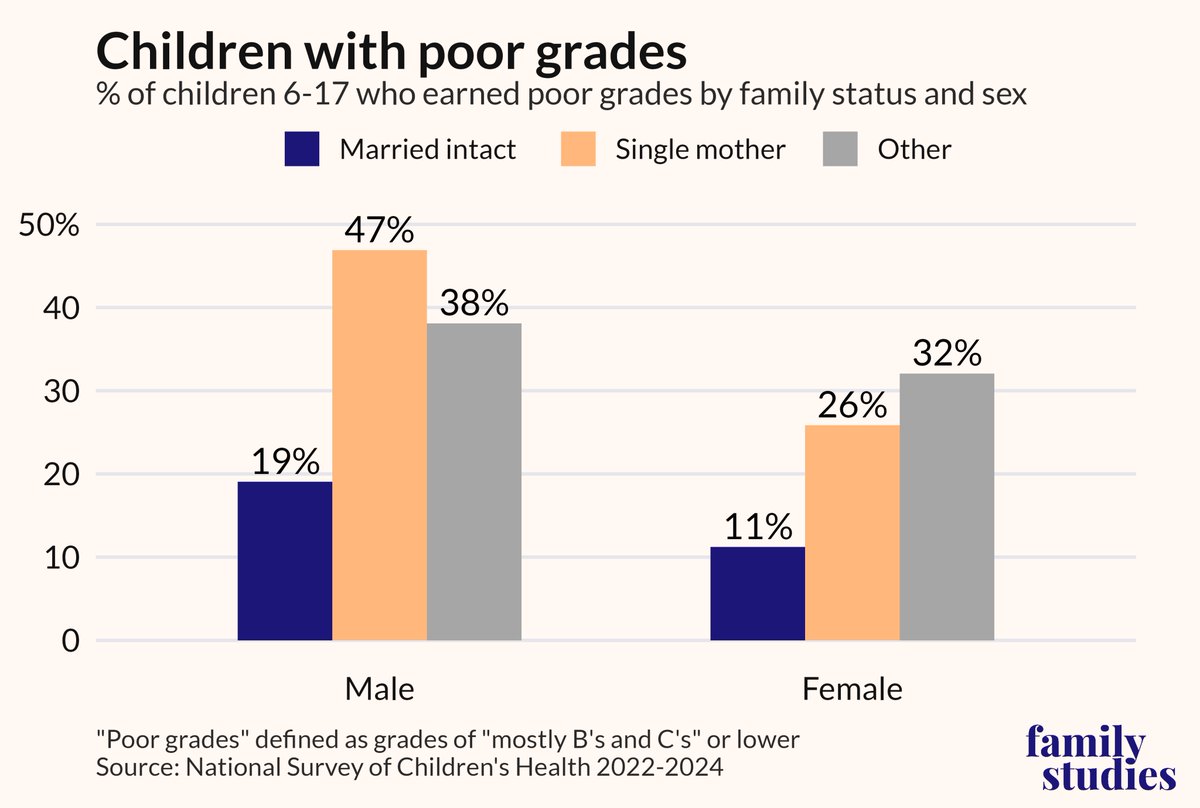
Children from non-intact families are about 91% more likely to be earning poor grades than children from intact families. This is a profound difference.
@FamStudies @BradWilcoxIFS @grantjbailey @azpolicy
6
17
59
3,887
May 12
🥴
May 12

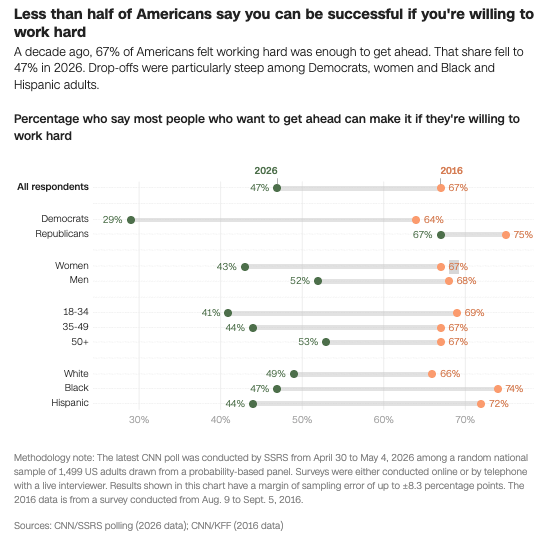
In 2016, 67% of Americans agreed that most people can get ahead if they were willing to work hard.
Today, it's 47%.
(via new @CNN poll)
1
63
Roberto Gallardo retweeted

Skills Clusters group occupations together based on the skills they require. Using data from O*NET, 800 jobs are organized into 38 clusters that reflect the full range of work in the labor market!
🔗 RegionalClusters.com
Source: pcrd.purdue.edu/regionalclus…

1
30
May 11
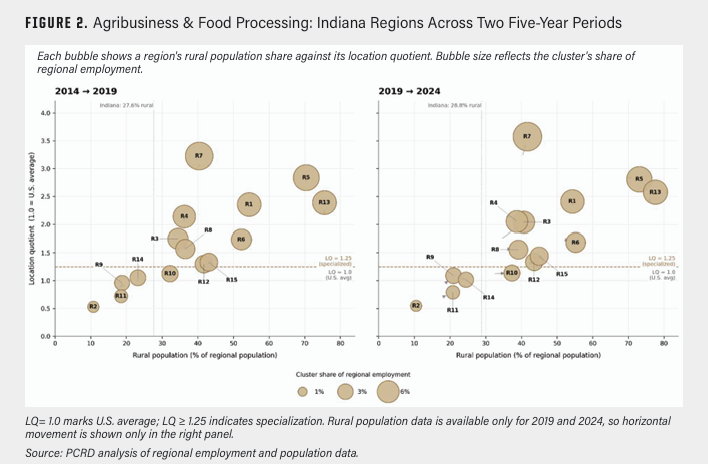
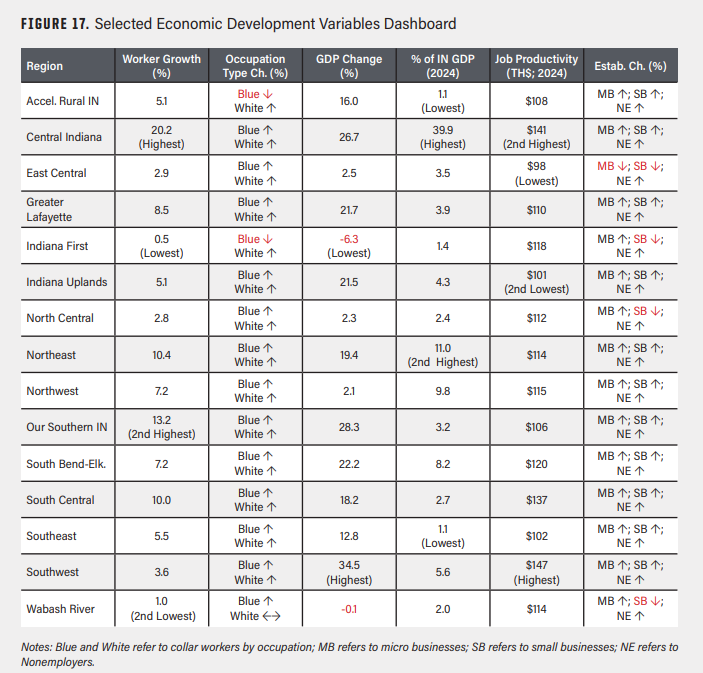
#DataInsights #RegionalDevelopment
@pcrd recently published updated clusters based on industries, knowledge-based occupations, and skills-based occupations. We crunched the industry-based clusters for our latest research & policy insights. Read more here: pcrd.purdue.edu/wp-content/u…
Below is the bubble chart for the agribusiness and food processing industry cluster across all 15 #Indiana regions. A couple of regions became more specialized both in 2014-2019 and again in 2019-2024.
1
38
Roberto Gallardo retweeted

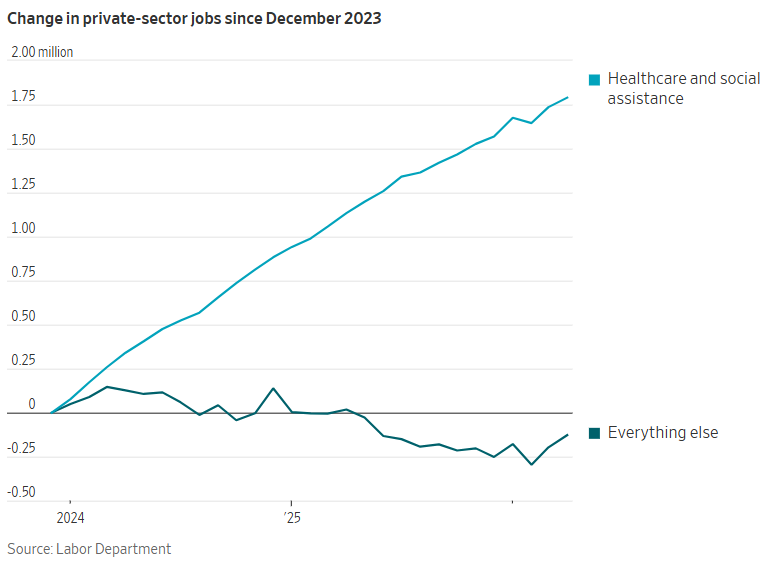
Insane stat: Healthcare and Social Assistance have added nearly 1.8 million private-sector jobs in the US since the end of 2023 while all of other industries combined have lost 127,800 jobs.
91
364
1,343
237,773
Roberto Gallardo retweeted

73.6% of women ages 20-64 with children under the age of 18 were employed in 2024.
Here's to all the moms out there! ⭐🌷
Learn more about moms: census.gov/programs-surveys/…
#MothersDay #StatsInSchools #ACSdata

1
3
5
628
Roberto Gallardo retweeted

May 8
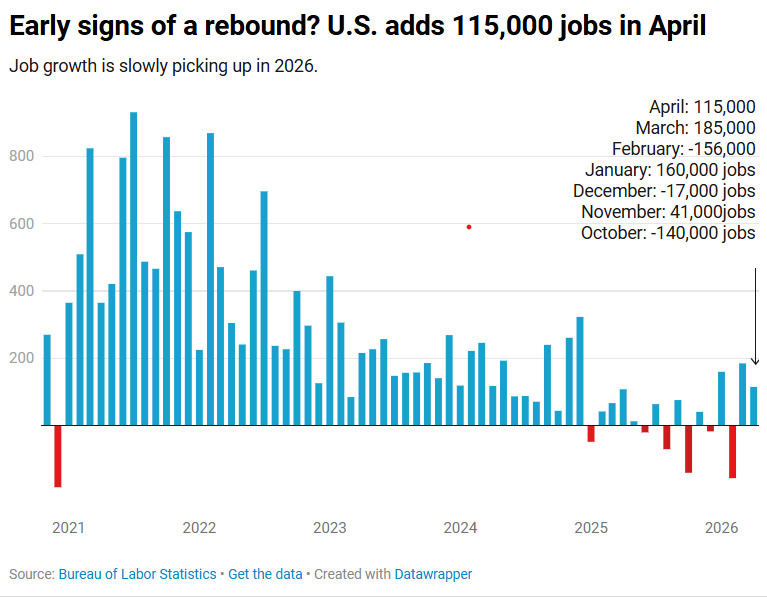
JUST IN: Good news. The US economy added a strong 115,000 jobs in April (and March was revised higher to 185,000!) The unemployment rate stayed at 4.3%. Hiring was strong in healthcare (about 1/3 of job gains in April), retail and transportation/warehouse.
The bad news = Inflation is about to eat up wage gains.
Wage growth: 3.6% in past year --> That’s likely to be eaten up by April inflation of ~4%
#jobs
174
191
446
161,085
May 8
"Labor Department data from March showed that 1 in 3 men [age 16 or older] across the United States are not working or looking for a job."
washingtonpost.com/business/…
51
May 7
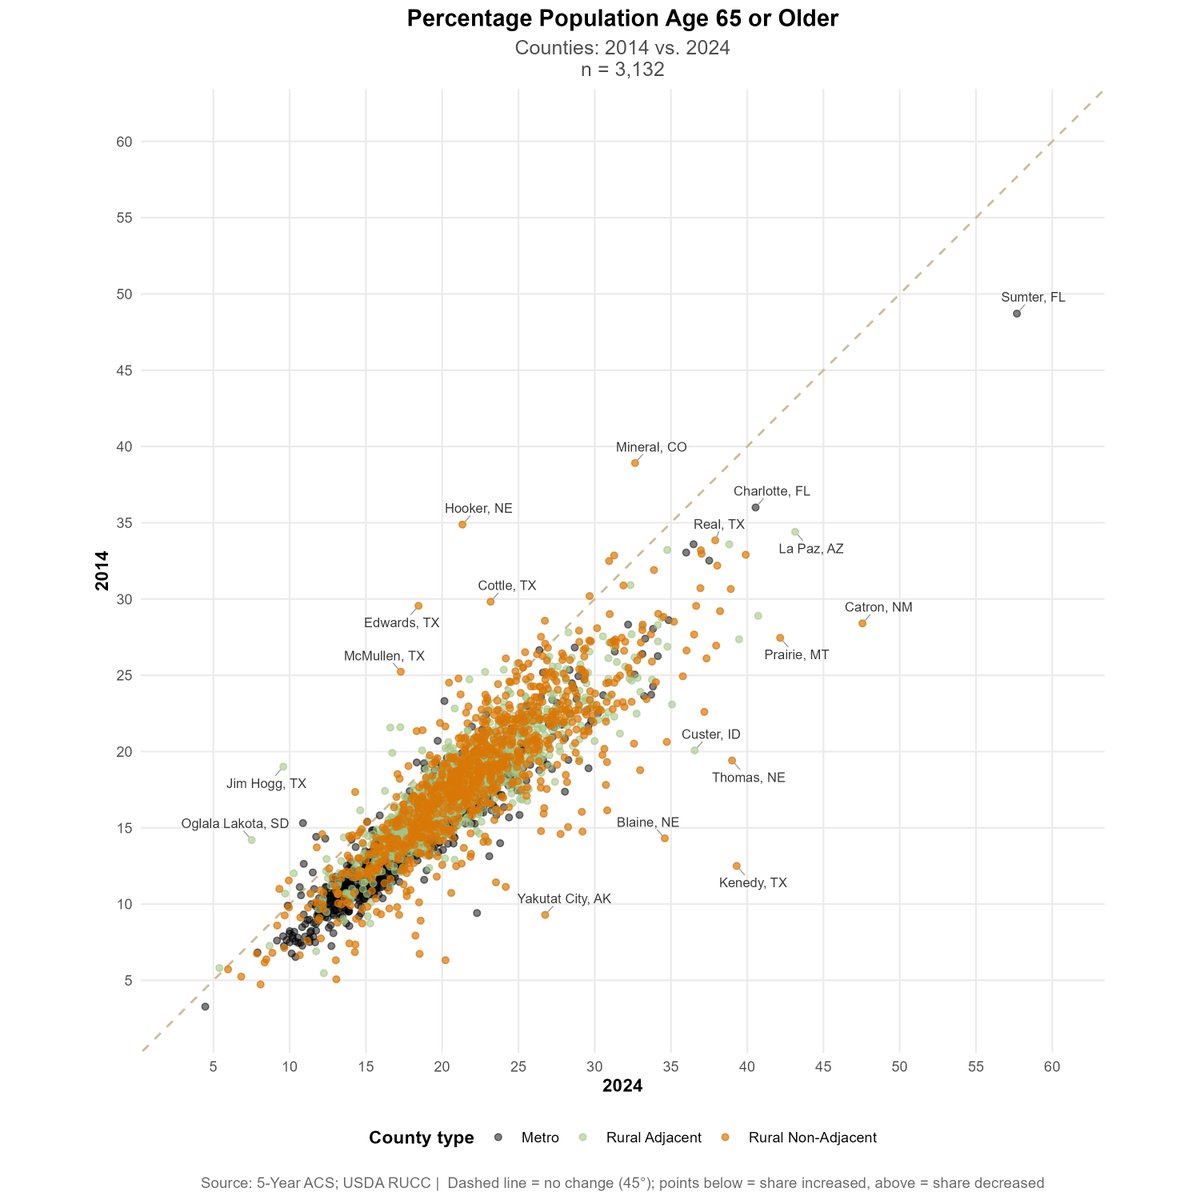
#DataInsights #RegionalDevelopment
The scatter plot below shows all 92 #Indiana counties by type (metro, rural adjacent, rural non-adjacent) and their share of population age 65 or older in 2014 (y-axis) and 2024 (x-axis). A county below the diagonal means its share increased during this period.
The share of the population age 65 or older increased across *ALL* Indiana counties.
2
6
339
May 5
#DataInsights
Map below shows the Older-Younger (OY) Ratio which divides the number of residents 65 or older by those under 15. An OY greater than 100 means there are more residents age 65 or older than those under age 15. Map shows 2000 versus 2024.
An OY value of 150 (dark blue counties) means the population age 65 or older is 50% higher than the population under age 15.
#AnimatedGIF #RegionalDevelopment
1
1
107
May 4
#DataWhisperer
In my latest number-crunching I looked at geographic mobility among children and seniors using 5-Year American Community Survey data. Which counties gained the most? Where is this taking place?
Not surprisingly, Florida and Texas were the top 2 states where the number of children and seniors moving from other states or abroad was highest.
Read more: datawhisperer.substack.com/p…
#DataInsights #RegionalDevelopment
1
1
1
921