
TechnoStats: Where Economics meets Tech. 🔗 PhD in Econ | Data Analysis | Predictive Modeling. Simplifying the world’s noise through data. 🧠
Joined February 2026
- Tweets 1,207
- Following 158
- Followers 96
- Likes 145
259 Photos and videos


Pinned Tweet

📌 Welcome to TechnoStats!
Here, I analyze the most critical macroeconomic data (ISM PMI, JOLTS, ADP, Jobless Claims, PPI, etc.) with charts every day.
With my PhD in Economics:
• I interpret the data clearly and concisely
• I derive its realistic implications for the stock market and the economy
• I provide short, simple, and actionable insights
No hype—just data charts logical analysis.
New charts will be posted here every morning and evening 🚀
Follow me, and let’s learn together through the data.
#Econ #Tech #Macro #DataInsights
110
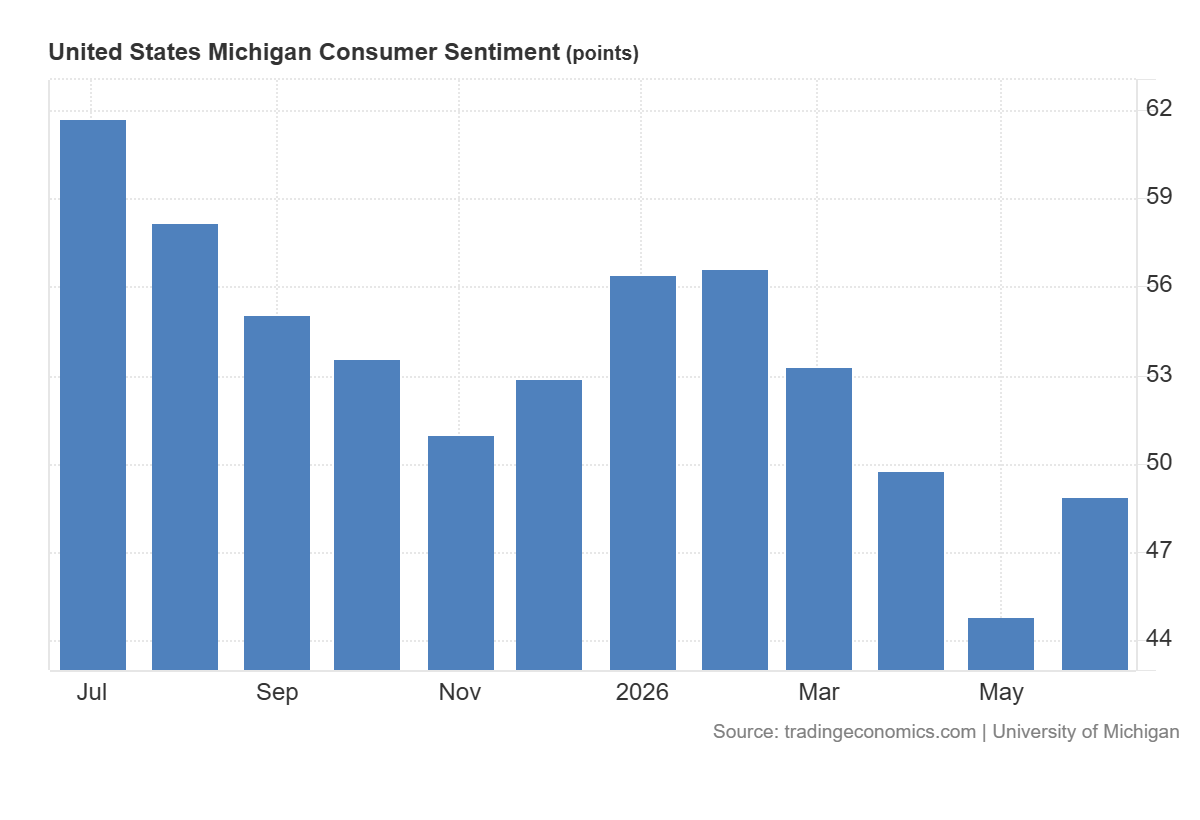
📊 The University of Michigan’s Consumer Sentiment Index rose to 48.9 in early June 2026, recovering from May’s all-time low of 44.8 and outperforming the market expectation of 46. While this subtle rebound offers short-term relief, the broader historical perspective indicates that economic sentiment remains deeply compressed.
📉 Despite the monthly gain, index values are still tracking 13% below January 2026 levels and 19% below the same period last year. Let's break down the macro drivers behind these figures.
#Macroeconomics #ConsumerSentiment #UofMichigan #USData #QuantitativeAnalysis
1
9
🔸 Crucially for monetary policy outlooks, inflation expectations showed moderate softening. Year-ahead expectations edged down to 4.6% from 4.8% in May, while long-run expectations fell back to 3.4% from 3.9%.
🔸 However, everyday financial pressures remain the primary focus for households, with short-term inflation anxieties keeping overall baseline confidence near historical lows.
#Inflation #MonetaryPolicy #MacroData
1
8
🎯 The June index movement illustrates how sensitive aggregate consumer behavior remains to volatile headline variables like energy inputs. While the immediate reversal from the historical low is a constructive data point, the annual contraction highlights a persistent structural squeeze on the consumer side.
❓ Considering the drop in long-run inflation expectations alongside still-depressed overall sentiment, do you think the Federal Reserve will interpret this as a stabilization signal or a sign of an encroaching slowdown?
Let's discuss below. 👇
#FederalReserve #Macroeconomics #EconomicIndicators
6
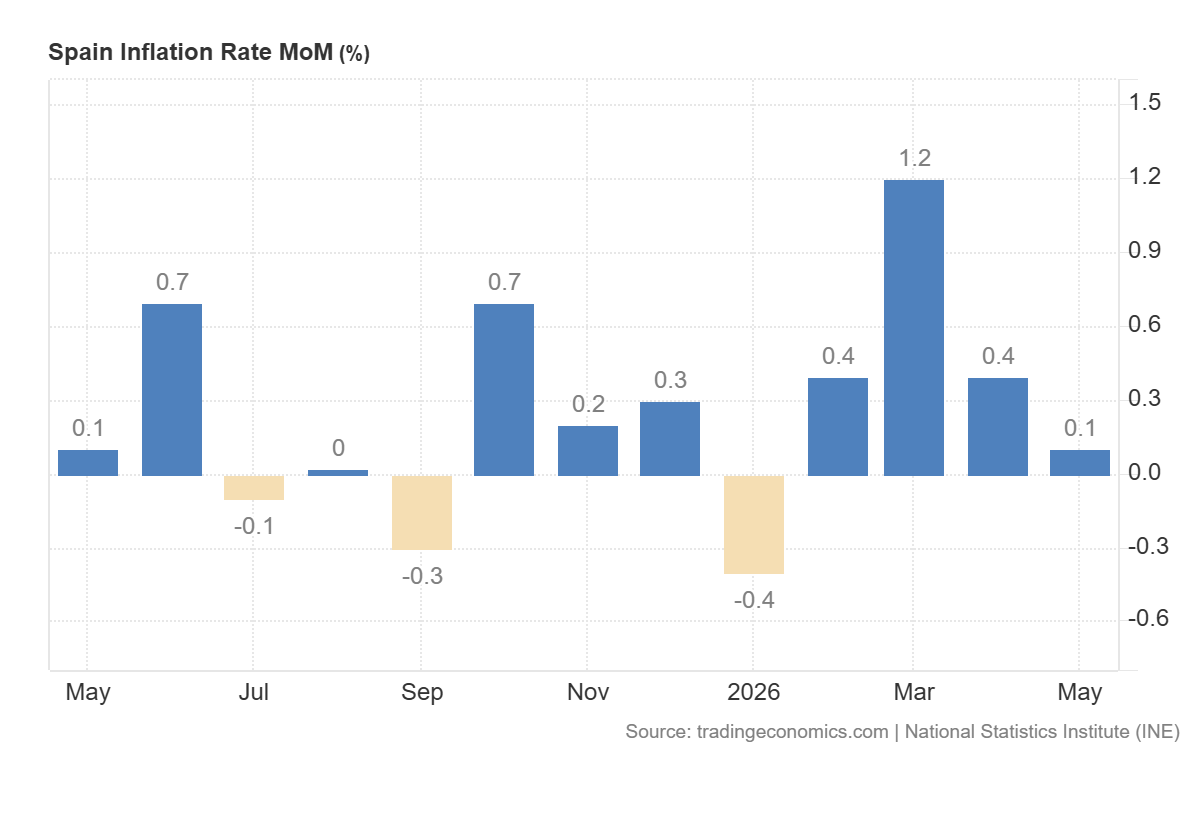
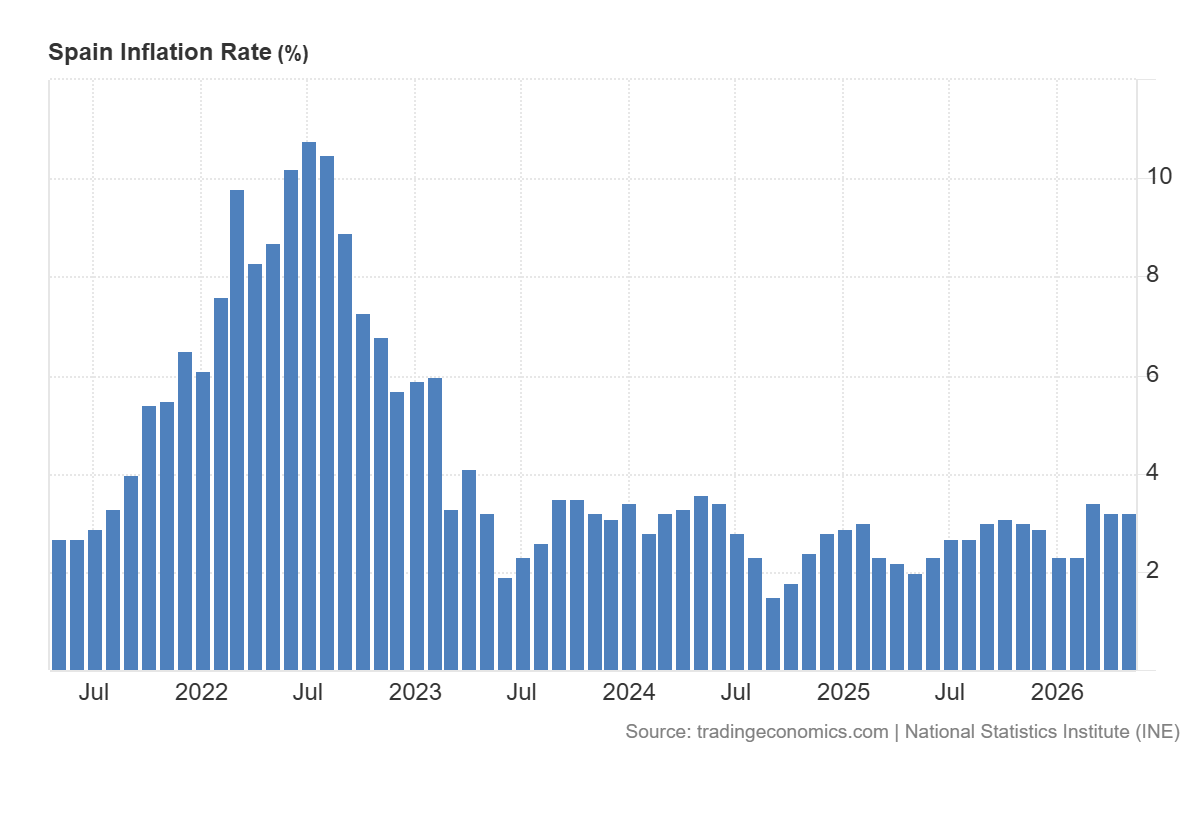
📊 Spain’s annual inflation rate held steady at 3.2% in May 2026, unchanged from the previous month and matching initial market estimates. While the headline index shows stabilization, underlying consumer dynamics reveal shifting sectoral pressures.
📉 On a monthly basis, consumer prices edged up by 0.1%, marking a slower pace compared to the 0.4% expansion recorded in April.
#Macroeconomics #Spain #Inflation #DataAnalytics #INE
1
19
🔸 A critical point for monetary analysis is the core inflation rate (excluding volatile food and energy), which ticked slightly higher to 2.9% from 2.8%.
🔸 This persistent core metric suggests that structural price pressures within the domestic economy are remaining steady, even as broader headline commodity inputs stabilize.
#CoreInflation #Statistics
1
12
🎯 With the EU-harmonized annual rate edging toward 2.9%, Spain continues to display stickier price components than some of its Eurozone peers, presenting an ongoing challenge for regional policy synchronization.
❓ Given the divergence between accelerating transport costs and cooling food prices, do you expect Eurozone core inflation to remain stickier than expected throughout the summer?
Let's discuss in the comments. 📊✍️
#MonetaryPolicy #Eurozone #EconomicIndicators
19
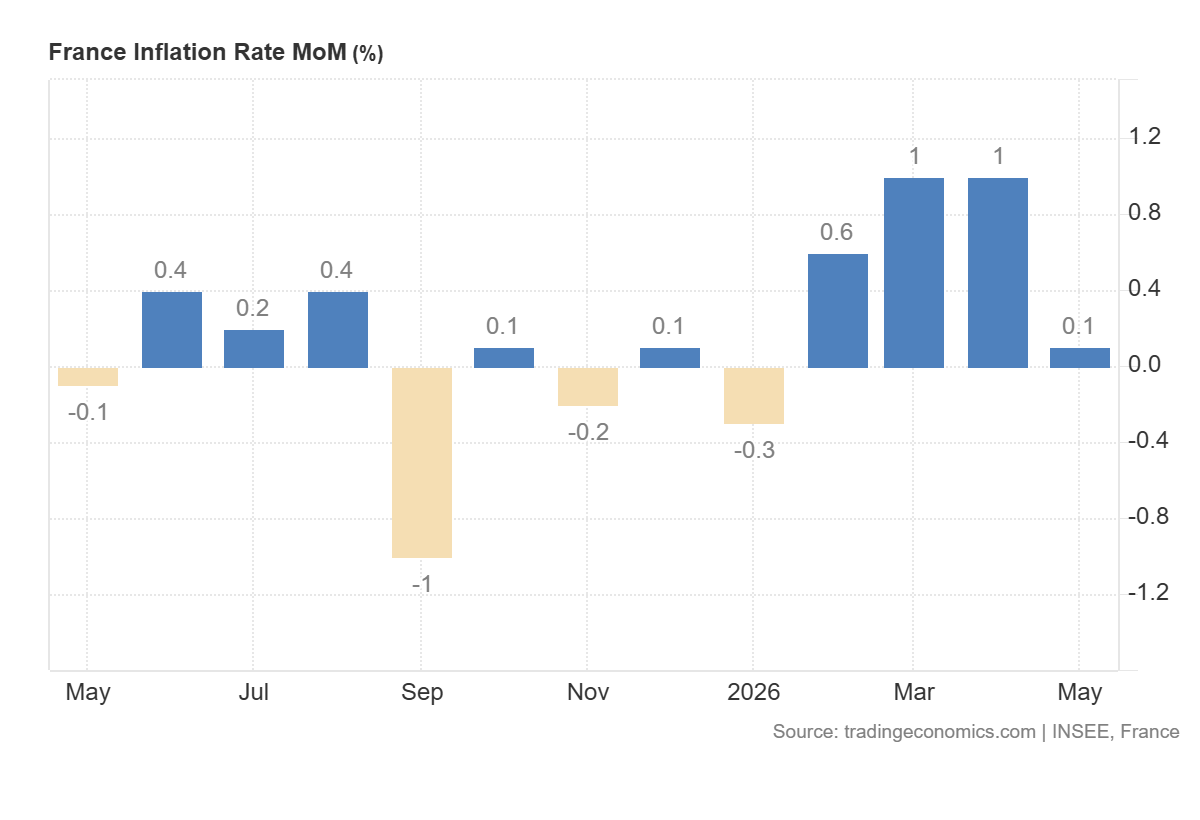
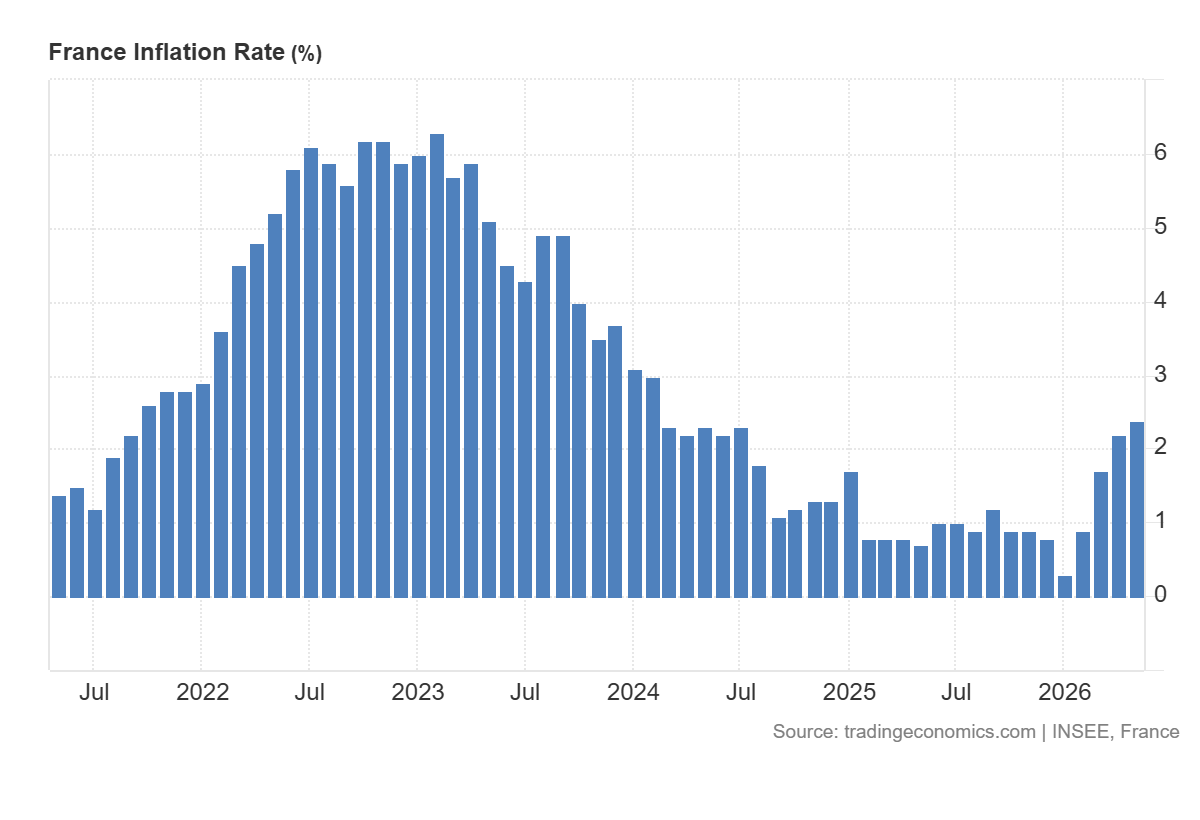
📊 France's annual inflation rate accelerated to 2.4% in May 2026, up from 2.2% in April, confirming initial estimates. This marks the highest year-on-year reading since February 2024, driven primarily by persistent base effects and shifting energy dynamics.
📉 On a monthly basis, however, consumer prices slowed significantly, edging up just 0.1% compared to the 1.0% jumps recorded in both March and April.
#Macroeconomics #France #Inflation #DataAnalytics #INSEE
1
16
🔸 Beyond energy, core components show signs of stabilization. Services inflation picked up slightly to 2.1% (from 1.8%), while food price growth moderated to 1.1%. Manufactured goods extended their downward trend, contracting by 0.6% year-on-year.
🔸 This divergence suggests that structural domestic demand pressures remain relatively contained outside of volatile commodity segments.
#Statistics #Eurozone #QuantitativeAnalysis
1
13
🎯 With the EU-harmonised annual inflation rate landing at 2.8%, the data reflects a complex environment for Eurozone monetary policy, especially when contrasted with the recent cooling observed in Germany's latest prints.
❓ Given this variance in core versus energy-driven components across major Eurozone economies, how do you see the ECB balancing these asymmetric domestic pressures in its upcoming meetings?
Let's discuss below. 👇
#MonetaryPolicy #ECB #EconomicIndicators
10
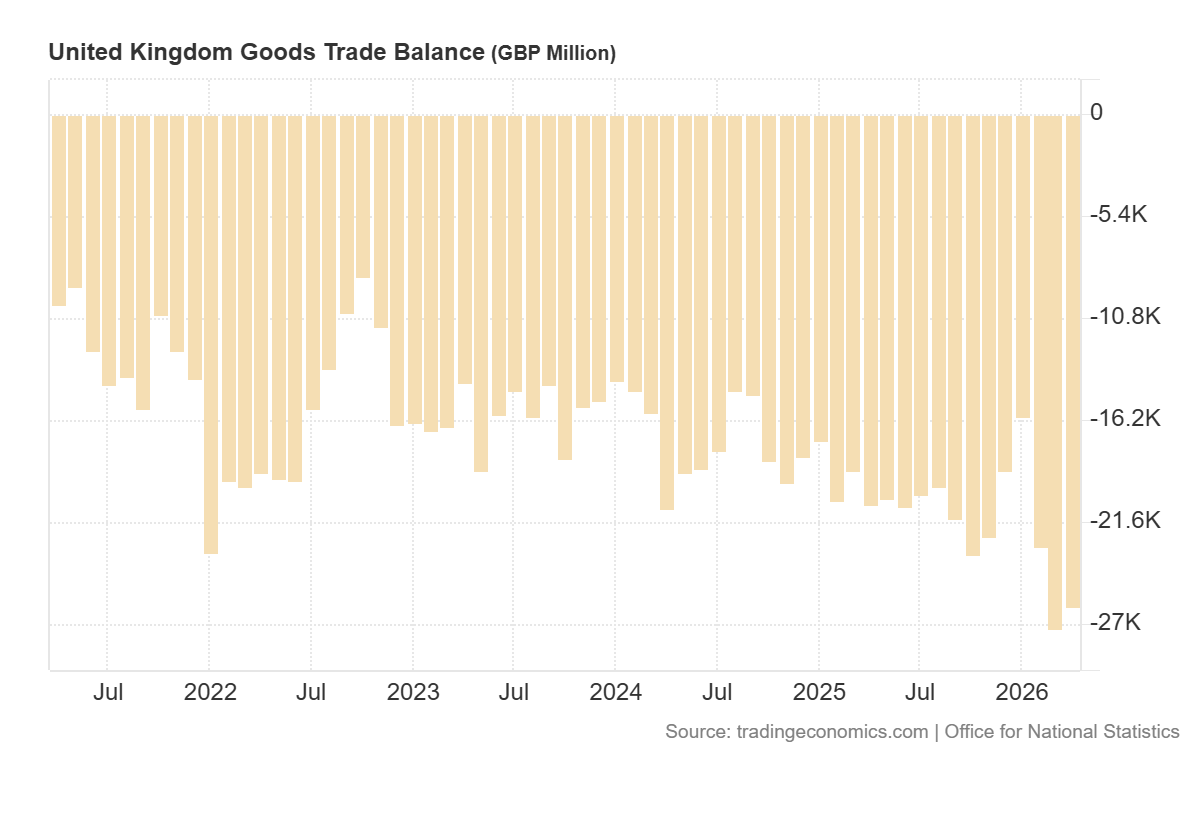
📊 The UK’s goods trade deficit narrowed slightly to £26.05 billion in April 2026, down from £27.22 billion in March. While this marginal reduction indicates a stabilization in trade flows, the shortfall remains visibly wider than the market expectation of a £22.5 billion deficit.
📉 Looking at the historical perspective, the persistent negative values underscore the ongoing structural imbalances in the UK's trade position. Let's look into the underlying dynamics.
#UK #Macroeconomics #TradeDeficit #EconomicData #ONS
1
1
17
🔸 On the import side, total goods imports experienced a minor deceleration, falling 0.7% to £59.16 billion. This change was largely driven by a 1.2% decline in arrivals from non-EU countries, primarily due to a £0.2 billion drop in fuel imports.
🔸 Conversely, imports from the EU grew by 4.0%, sustained by higher inflows of fuel, machinery, transport equipment, and chemicals.
#EconomicIndicators #Imports #Statistics
2
14
🎯 The data reflects a trade position that is navigating significant structural headwinds. While the monthly adjustment shows marginal cooling in the deficit, the gap between actual performance and consensus forecasts points to complex underlying trade conditions.
❓ Considering the contrasting trends between EU and non-EU import patterns, how do you expect these structural deficits to impact the broader sterling exchange rate in the medium term?
Let's discuss in the comments. 📊✍️
#MacroData #QuantitativeAnalysis #GlobalTrade
12
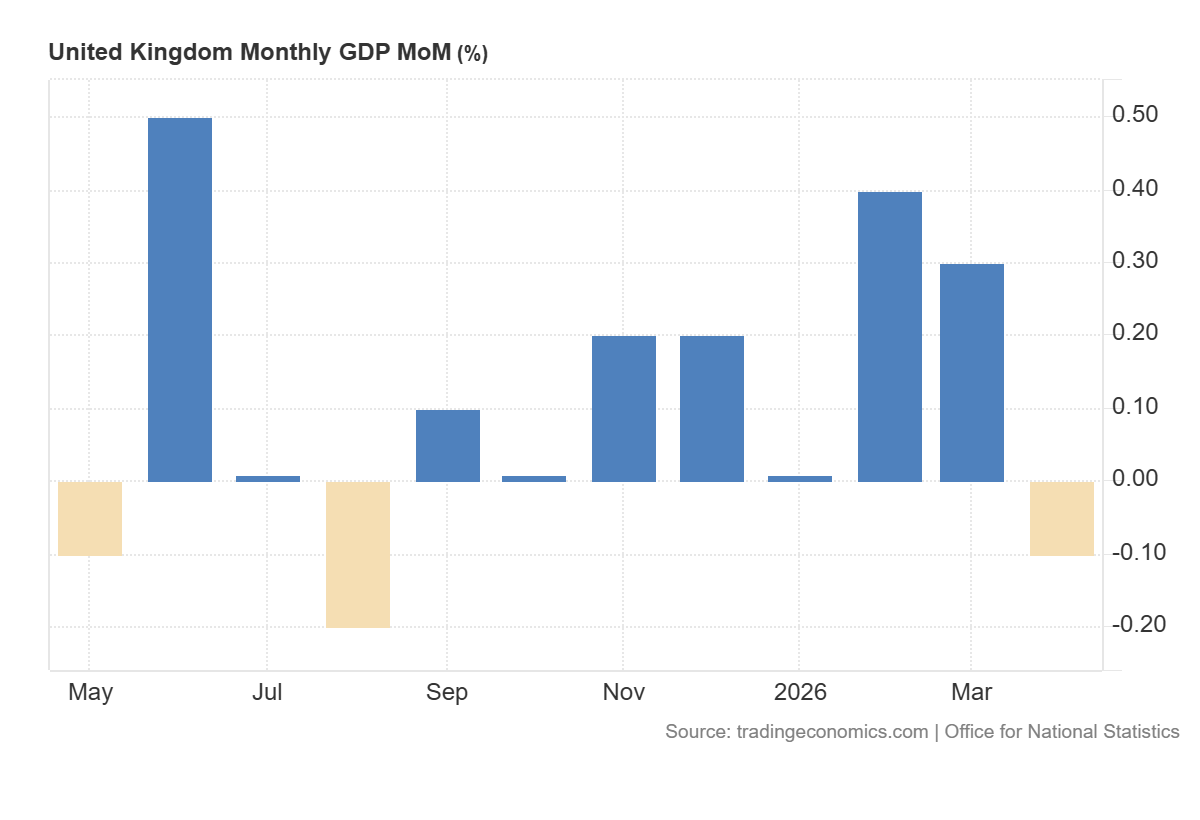
📊 UK GDP contracted by 0.1% month-on-month in April 2026, matching market consensus after a 0.3% expansion in March. This represents the first monthly contraction since August last year, signaling a visible softening in economic momentum.
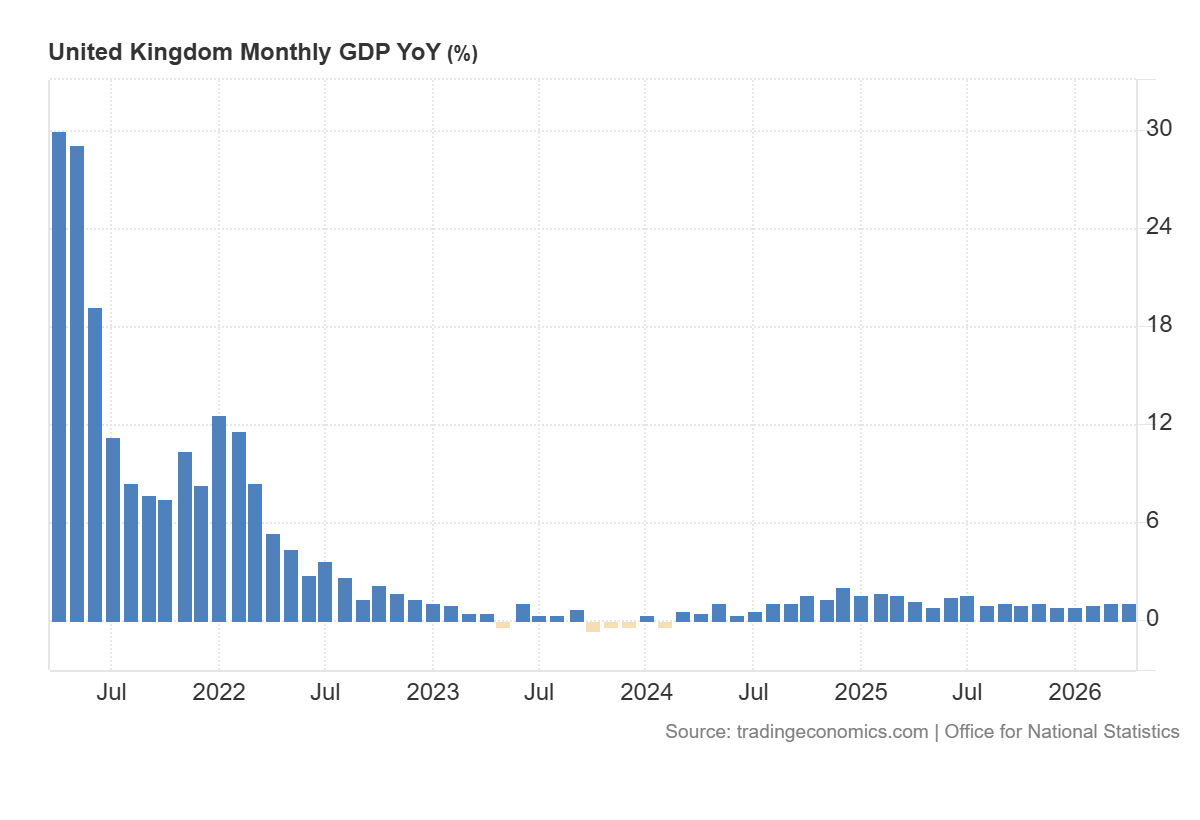
📉 On a yearly basis, growth held steady at 1.2%—the same pace as March, though slightly lower than the 1.3% forecast.
How resilient is the UK economy against growing external headwinds? Let's look at the sector breakdown. 👇
#UK #Macroeconomics #GDP #EconomicData #ONS
1
18
🔸 On the other hand, the information and communication sector provided a strong buffer, rising 1.1%. Production output remained flat, as manufacturing gains were offset by declines in utilities. Construction showed minor resilience with a 0.1% expansion.
🔸 The data highlights a distinct divergence between a cooling service sector and stabilizing industrial components.
#IndustrialProduction #DataVisualization #Statistics
1
9
🎯 While the 1.2% annual expansion reflects the steepest trend since July last year, the 0.1% monthly contraction points to a delicate balance as geopolitical developments begin to impact the real economy.
❓ Considering the contraction in services alongside sticky domestic constraints, what are your expectations for the Bank of England's upcoming policy decisions?
Let's discuss in the comments. 📊✍️
#MonetaryPolicy #Macroeconomics #BankofEngland
9