
Joined January 2025
- Tweets 328
- Following 1
- Followers 156
- Likes 195
309 Photos and videos


Jun 12
The biggest IPO in history is officially live. $SPCX listed at a $1.77T valuation and instantly cleared $2T in its Nasdaq debut 🚀
Massive congratulations to the long-term holders and employees who backed this vision before today. You won big.
Here is exactly how the SpaceX money machine flows now that the books are public. Dig into the numbers 👇
Jun 10

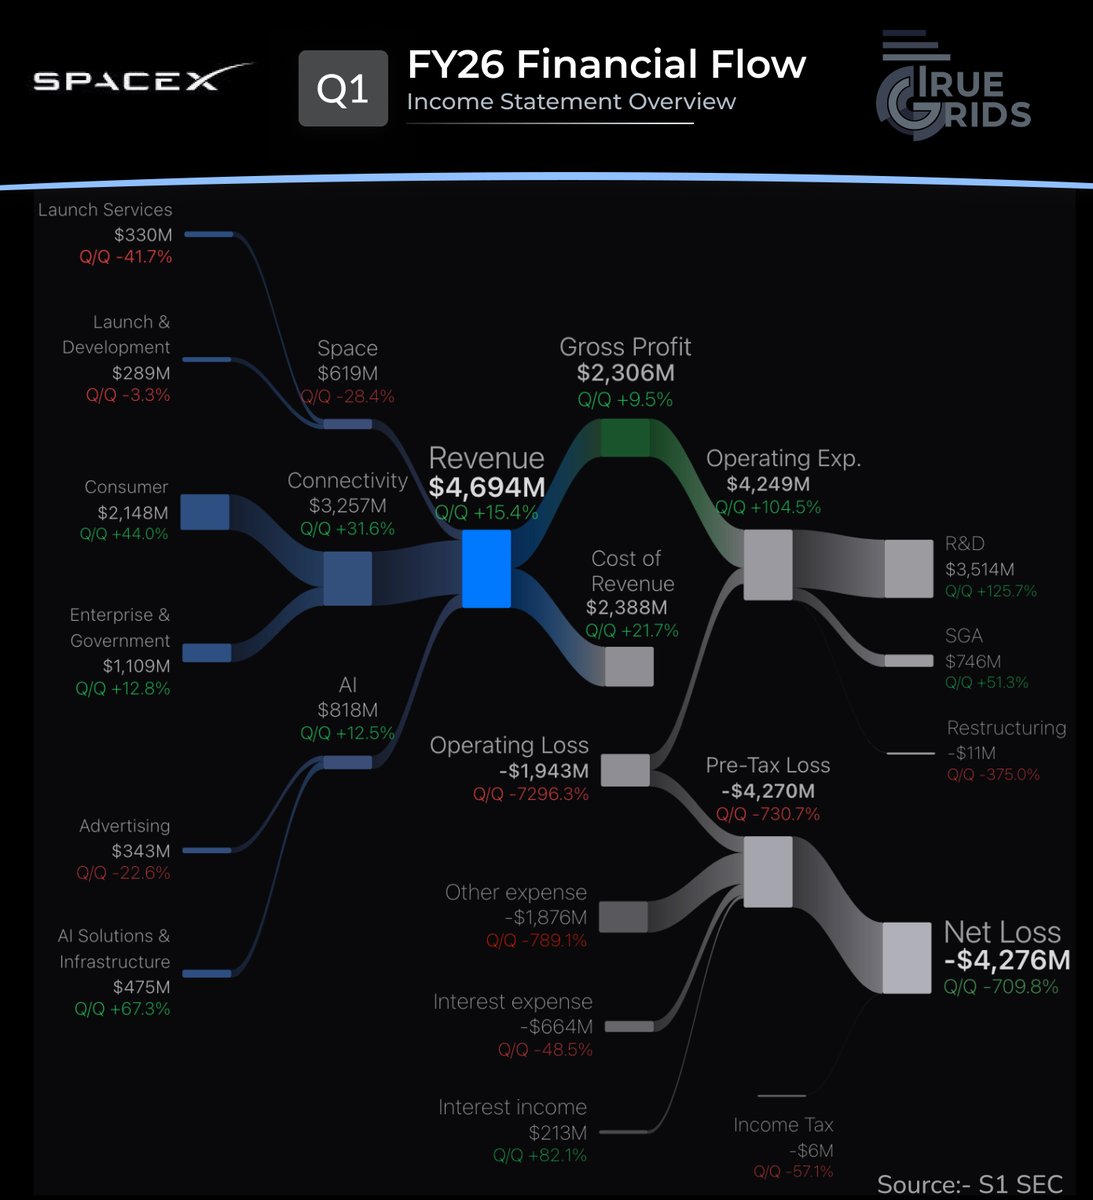
$SPCX Following up on the full-year analysis, let's zoom into the micro picture. While our previous thread covered the macro annual results, this new graphic breaks down the highly critical latest quarterly financial flows to see exactly how operational momentum shifted over the last 3-month period.
◆ Total Quarterly Revenue: $4,694 M ( 15.4% Q/Q)
◆ Gross Profit: $2,306 M ( 9.5% Q/Q)
◆ Operating Loss: -$1,943 M (Deepening Q/Q)
◆ Net Loss: -$4,276 M (Impacted heavily by non-operating line items)
Quarterly Revenue Segmentation
◽ Connectivity ($3,257M, 31.6% Q/Q): The true engine of the quarter, split between Consumer ($2,148M) and Enterprise & Government ($1,109M).
◽ AI ($818M, 12.5% Q/Q): Steady infrastructure demand, driven by AI Solutions & Infrastructure ($475M) and Advertising ($343M).
◽ Space ($619M, -28.4% Q/Q): Saw notable sequential softness, split between Launch Services ($330M) and Launch & Development ($289M).
Quarterly Expense and Outflow Segmentation
◽ Cost of Revenue: Totaled $2,388 M ( 21.7% Q/Q).
◽ Operating Expenses: Exploded to $4,249 M ( 104.5% Q/Q), driven intensely by a massive ramp in R&D ($3,514M) and SG&A ($746M).
◽ Non-Operating Items: A significant drag from Other Expense (-$1,876M) and Interest Expense (-$664M).
Future Outlook:
Next-Phase Quarterly Targets
▪ R&D Expense Optimization: Aligning the rapid R&D infrastructure scaling with long-term commercial monetization timelines.
▪ Space Revenue Recovery: Rebound sequencing for launch schedules to reverse the sequential quarterly decline in core aerospace services.
▪ Connectivity Scale: Continuing the highly profitable expansion of enterprise-level contracts to support consolidated margins.
▪ Non-Operating Stabilization: Clearing up non-cash and one-off expense drags that impacted the net bottom line this period.
👇 Check out the detailed Sankey diagram to trace how every single dollar flowed through the organization over the quarter.
$SPCX #Earnings #SpaceEconomy #Sankey #FinTech
3
169
Jun 11
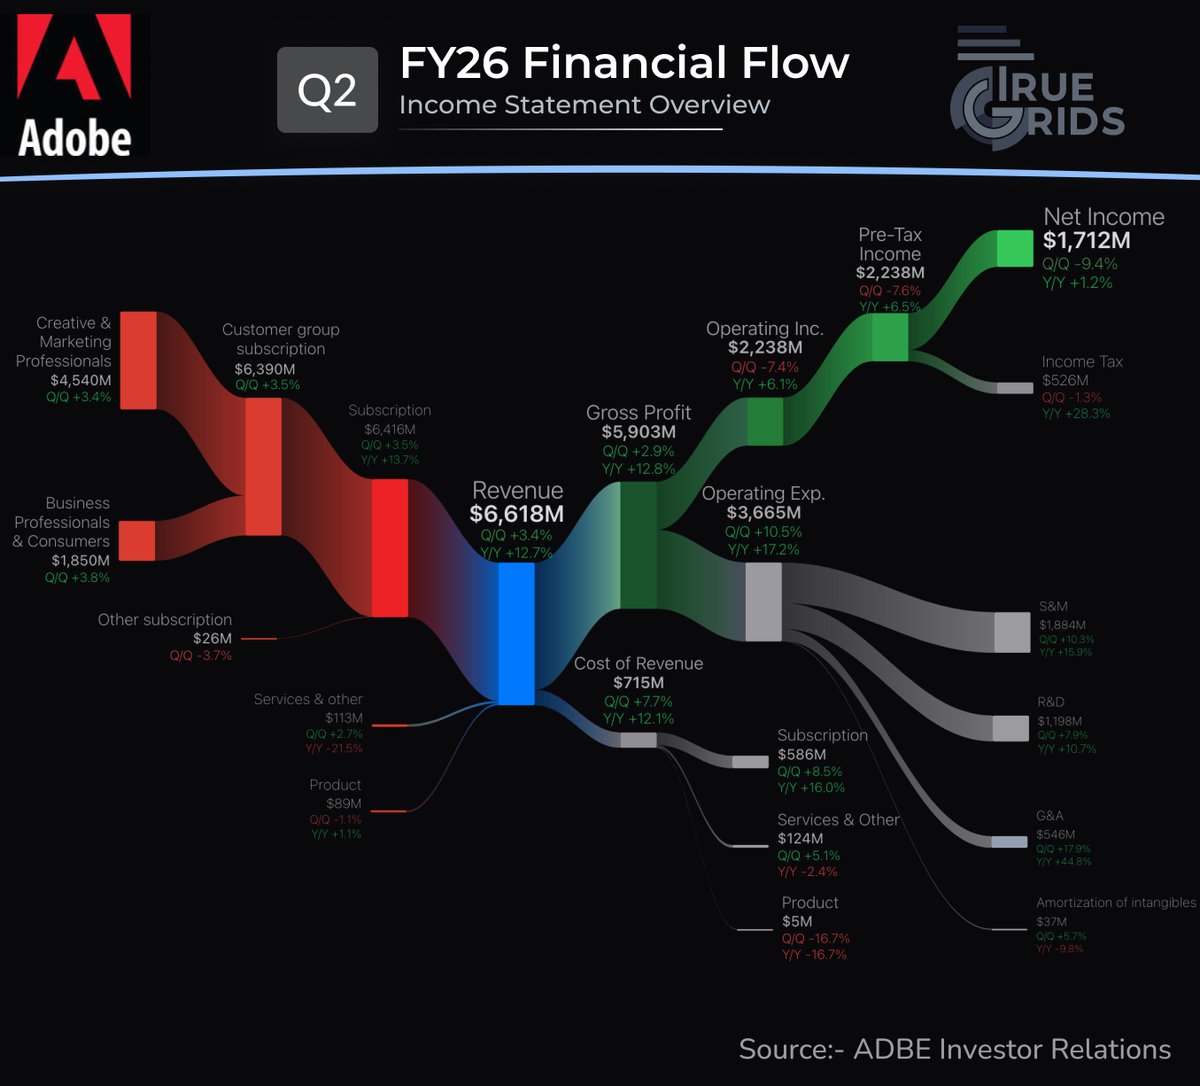
$ADBE just reported earnings for its second quarter this season .
◆ Total Revenue: $6,618 Million ( 12.7% Y/Y)
◆ Gross Profit: $5,903 Million ( 12.8% Y/Y)
◆ Operating Income: $2,238 Million ( 6.1% Y/Y)
◆ Net Income: $1,712 Million ( 1.2% Y/Y)
Revenue Segmentation
◽ Subscription Base ($6,416M, 13.7% Y/Y):
The core recurring engine, driven by Creative & Marketing Professionals ($4,540M) and Business Professionals ($1,850M).
◽ Services & Other ($113M, -21.5% Y/Y): Witnessing enterprise services consolidation.
◽ Product Sales ($89M, 1.1% Y/Y): Stable baseline performance.
5
173
Jun 11
$SPCX This structural breakdown maps out the company's complete Balance Sheet Architecture to show exactly how its multi-billion dollar capital structure is financed and deployed.
◆ Total Assets: $92,079 M
◆ Total Liabilities: $50,754 M
◆ Redeemable Convertible Preferred Stock: $38,752 M
◆ Total Shareholders' Equity: $2,573 M
👇 Check out the comprehensive balance sheet matrix in to visually trace how every asset is matched against its obligations.
$SPCX #BalanceSheet #SpaceEconomy #CorporateFinance #Sankey
1
8
154

Jun 10
$SPCX Following up on the full-year analysis, let's zoom into the micro picture. While our previous thread covered the macro annual results, this new graphic breaks down the highly critical latest quarterly financial flows to see exactly how operational momentum shifted over the last 3-month period.
◆ Total Quarterly Revenue: $4,694 M ( 15.4% Q/Q)
◆ Gross Profit: $2,306 M ( 9.5% Q/Q)
◆ Operating Loss: -$1,943 M (Deepening Q/Q)
◆ Net Loss: -$4,276 M (Impacted heavily by non-operating line items)
Quarterly Revenue Segmentation
◽ Connectivity ($3,257M, 31.6% Q/Q): The true engine of the quarter, split between Consumer ($2,148M) and Enterprise & Government ($1,109M).
◽ AI ($818M, 12.5% Q/Q): Steady infrastructure demand, driven by AI Solutions & Infrastructure ($475M) and Advertising ($343M).
◽ Space ($619M, -28.4% Q/Q): Saw notable sequential softness, split between Launch Services ($330M) and Launch & Development ($289M).
Quarterly Expense and Outflow Segmentation
◽ Cost of Revenue: Totaled $2,388 M ( 21.7% Q/Q).
◽ Operating Expenses: Exploded to $4,249 M ( 104.5% Q/Q), driven intensely by a massive ramp in R&D ($3,514M) and SG&A ($746M).
◽ Non-Operating Items: A significant drag from Other Expense (-$1,876M) and Interest Expense (-$664M).
Future Outlook:
Next-Phase Quarterly Targets
▪ R&D Expense Optimization: Aligning the rapid R&D infrastructure scaling with long-term commercial monetization timelines.
▪ Space Revenue Recovery: Rebound sequencing for launch schedules to reverse the sequential quarterly decline in core aerospace services.
▪ Connectivity Scale: Continuing the highly profitable expansion of enterprise-level contracts to support consolidated margins.
▪ Non-Operating Stabilization: Clearing up non-cash and one-off expense drags that impacted the net bottom line this period.
👇 Check out the detailed Sankey diagram to trace how every single dollar flowed through the organization over the quarter.
$SPCX #Earnings #SpaceEconomy #Sankey #FinTech
Jun 7
$SPCX Space Exploration Technologies Corp has filed its Form S-1 SEC registration statement, revealing its full-year Fiscal Year 2025 financial results.
◆ Total Revenue: $18,674 Million ( 33.2% Y/Y)
◆ Gross Profit: $9,223 Million ( 53.2% Y/Y)
◆ Operating Loss: -$2,589 Million
◆ Net Loss: -$4,937 Million
Revenue Segmentation
◦ Space Revenue ($4,086M, 7.6% Y/Y): Comprised of Launch Services ($2,576M) and Launch & Development ($1,510M).
◦ Connectivity Revenue ($11,387M, 49.8% Y/Y): Comprised of Consumer ($7,208M) and Enterprise & Government ($4,179M).
◦ AI Revenue ($3,201M, 22.2% Y/Y): Comprised of Advertising ($1,844M) and AI Solutions & Infrastructure ($1,357M).
Expense and Outflow Segmentation
◽ Cost of Revenue: Totaled $9,451 Million ( 18.2% Y/Y).
◽ Operating Expenses: Totaled $11,812 Million ( 112.7% Y/Y), split between Research & Development ($8,643M), SG&A ($2,644M), Restructuring ($487M), and Impairment ($38M).
◽ Non-Operating & Tax Drag: Included Interest Expense (-$1,945M), Interest Income ($492M), Other Expense (-$177M), and Income Tax (-$71M).
The management perspective: The financial architecture demonstrates substantial top-line scaling within the Connectivity and AI infrastructure segments, alongside heavy capital allocation toward R&D and core aerospace engineering programs.
Future Outlook:
Next-Phase Growth Projections (FY28 Outlook)
▪ Projected Space Systems Revenue: $5.10B – $5.45B
▪ Projected Connectivity Subscriptions: 6.2M – 6.7M Active Terminals
▪ Target Non-GAAP Gross Margin: 54% – 57%
▪ Planned R&D Capital Expenditure: $9.20B – $9.80B
Check to see the Sankey diagram exactly where every dollar of revenue went in the year 2025.
$SPCX #Earnings #SpaceEconomy #Sankey @elonmusk

4
316
Jun 9
$CASY (Casey’s General Stores, Inc.) just reported its FY26 earnings.
◆ Total Revenue: $17,561 Million ( 10.2% Y/Y)
◆ Gross Profit: $4,321 Million ( 15.2% Y/Y)
◆ Operating Income: $1,034 Million ( 29.8% Y/Y)
◆ Net Income: $714 Million ( 30.7% Y/Y)
Revenue Segmentation
◽ Fuel ($10,615M, 8.6% Y/Y):
Continues to act as the primary top-line driver and foot-traffic hook.
◽ Grocery & General Merchandise ($4,564M, 10.1% Y/Y):
Steady high-volume volume growth across the inside retail footprint.
◽ Prepared Food & Dispensed Beverages ($1,777M, 10.2% Y/Y):
The high-margin profit engine of the business.
◽ Other Revenue ($605M, 47.9% Y/Y):
Strong growth from auxiliary product lines and services. Expense and Outflow Segmentation
The management perspective: By effectively balancing fuel procurement margins with resilient traffic inside the stores, Casey's successfully converted top-line revenue acceleration directly into double-digit bottom-line net income expansion.

1
4
573
Jun 9
$SJM The J.M. Smucker Co., delivers a defensive masterclass.
While the broader market faces intense turmoil, consumer staples remind us why core fundamentals matter.
◆ Net Sales: $9,051 Million ( 3.7% Y/Y)
◆ Operating Income: $360 Million ( 153.5% Y/Y)
◆ Gross Profit: $3,035 Million (-10.3% Y/Y)
◆ Net Loss: -$139 Million (Impairment heavy, but improving 88.7% Y/Y)
Net Sales Segmentation
◽ U.S. Retail Coffee ($3,305M, 17.8% Y/Y):
The absolute growth engine for the business this period.
◽ U.S. Retail Frozen Handheld & Spread ($1,854M, -1.2% Y/Y):
Experiencing mild volume compression.
◽ U.S. Retail Pet Food ($1,600M, -3.8% Y/Y):
Slightly down but remains a critical foundational segment.
◽ Int'l & Away From Home ($1,321M, 10.1% Y/Y): Strong operational double-digit bounce.
◽ Sweet Baked Snacks ($971M, -17.6% Y/Y):
Facing the steepest consumer pullback.
Expense and Outflow Segmentation
◽ Cost of Revenue: Totaled $6,016 M ( 12.6% Y/Y).
◽ Operating Expenses: Totaled $2,674 M (-28.5% Y/Y), deeply impacted by non-cash charges including Goodwill Impairment ($508M) and Intangible Assets Impairment ($454M).
◽ SG&A Overhead: Kept tight at $1,497 M (-2.1% Y/Y).
The management perspective:
When macro volatility hits, pricing power and brand equity in non-discretionary categories shine. SJM's core coffee business completely offset snacks softness, proving that cash-generative operational strength cuts right through market noise.
Future Outlook:
▪ Coffee Portfolio Premiumization:
Expanding high-margin product extensions to lock in the retail coffee momentum.
▪ Synergy Capture:
Optimizing supply chain logistics to curb the climbing 12.6% Cost of Revenue line.
▪ Balance Sheet Deleveraging:
Prioritizing organic cash flows to pay down debt and stabilize net metrics post-impairment cycles.
▪ Pet Food Stabilization:
Executing targeted promotional resets to reverse minor volume churn in the pet ecosystem.
👇 Check out the Sankey diagram in SJM to see exactly where every dollar of revenue went last year.
$SJM #Earnings #ConsumerStaples #Sankey

4
71
Jun 7
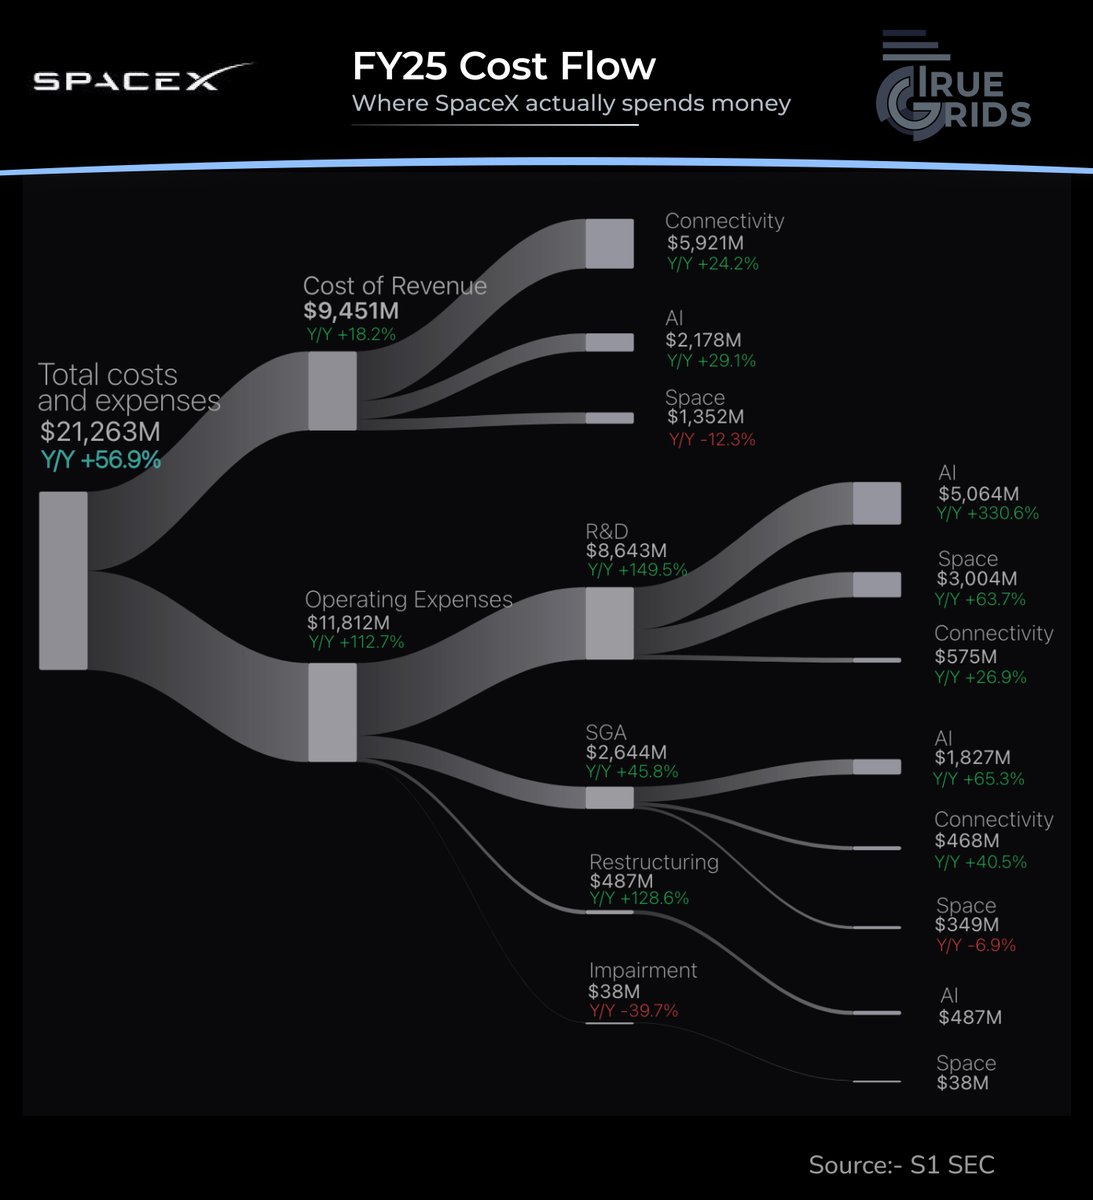
Learn how costs flow through $SPCX's business
◆ Total Costs and Exp.: $21,263 Million ( 56.9% Y/Y)
◆ Cost of Revenue: $9,451 Million ( 18.2% Y/Y)
◆ Gross Margin: 49.39% ( 15% Y/Y)
◆ Operating Expenses: $11,812 Million ( 112.7% Y/Y)
◆ Operating Margin: -13.864% (-517% Y/Y)
◆ Net Margin: -26.438% (-568.4% Y/Y)
The consolidated totals are:-
◆ AI Total Allocation: $9,556 Million.
The AI pillar represents the single largest destination of total expenses in this breakdown.
◽ Cost of Revenue: $2,178M
◽ Research & Development (R&D): $5,064M
◽ SG&A: $1,827M
◽ Restructuring: $487M
◆ Connectivity Total Allocation: $6,964 Million.
The connectivity ecosystem represents the second largest consumer of capital, dominated heavily by its core networks and ground operations infrastructure.
◽ Cost of Revenue: $5,921M
◽ Research & Development (R&D): $575M
◽ SG&A: $468M
◆ Space Total Allocation: $4,743 Million.
The legacy aerospace, development, and launch operations division accounts for the final core segment total.
◽ Cost of Revenue: $1,352M
◽ Research & Development (R&D): $3,004M
◽ SG&A: $349M
◽ Impairment: $38M
$SPCX #Earnings #SpaceEconomy #Sankey
4
140
Jun 7
$SPCX Space Exploration Technologies Corp has filed its Form S-1 SEC registration statement, revealing its full-year Fiscal Year 2025 financial results.
◆ Total Revenue: $18,674 Million ( 33.2% Y/Y)
◆ Gross Profit: $9,223 Million ( 53.2% Y/Y)
◆ Operating Loss: -$2,589 Million
◆ Net Loss: -$4,937 Million
Revenue Segmentation
◦ Space Revenue ($4,086M, 7.6% Y/Y): Comprised of Launch Services ($2,576M) and Launch & Development ($1,510M).
◦ Connectivity Revenue ($11,387M, 49.8% Y/Y): Comprised of Consumer ($7,208M) and Enterprise & Government ($4,179M).
◦ AI Revenue ($3,201M, 22.2% Y/Y): Comprised of Advertising ($1,844M) and AI Solutions & Infrastructure ($1,357M).
Expense and Outflow Segmentation
◽ Cost of Revenue: Totaled $9,451 Million ( 18.2% Y/Y).
◽ Operating Expenses: Totaled $11,812 Million ( 112.7% Y/Y), split between Research & Development ($8,643M), SG&A ($2,644M), Restructuring ($487M), and Impairment ($38M).
◽ Non-Operating & Tax Drag: Included Interest Expense (-$1,945M), Interest Income ($492M), Other Expense (-$177M), and Income Tax (-$71M).
The management perspective: The financial architecture demonstrates substantial top-line scaling within the Connectivity and AI infrastructure segments, alongside heavy capital allocation toward R&D and core aerospace engineering programs.
Future Outlook:
Next-Phase Growth Projections (FY28 Outlook)
▪ Projected Space Systems Revenue: $5.10B – $5.45B
▪ Projected Connectivity Subscriptions: 6.2M – 6.7M Active Terminals
▪ Target Non-GAAP Gross Margin: 54% – 57%
▪ Planned R&D Capital Expenditure: $9.20B – $9.80B
Check to see the Sankey diagram exactly where every dollar of revenue went in the year 2025.
$SPCX #Earnings #SpaceEconomy #Sankey @elonmusk
1
5
571
Jun 4
$PL Planet Reports Financial Results for First Quarter of Fiscal Year 2027.
◆ Total Revenue: Explodes 42.1% Y/Y to reach a record $94 Million, comfortably beating market expectations
◆ Gross Profit Surge: Ramps up 37.7% Y/Y to hit $50 Million as fixed-price subscription leverage kicks in
◆ The Non-Operating Hit: The steep GAAP Net Loss of -$139M is heavily distorted by a one-time, non-cash $106.5M paper loss from adjusting warrant liabilities after recent stock price spikes.
Q2 Fiscal 2027 Guidance (Ending July 31, 2026):-
▪ Revenue: $102M – $107M
▪ Non-GAAP Gross Margin: 52% – 55%
▪ Adjusted EBITDA: $0M – $5M (Profit)
▪ CapEx: $21M – $27M
Full Fiscal Year 2027 Guidance:-
▪ Revenue: $425M – $441M
▪ Non-GAAP Gross Margin: 52% – 54%
▪ Adjusted EBITDA: $0M – $10M (Profit)
▪ CapEx: $80M – $95M
#StockMarket #Trading #Aerospace #DataViz #Sankey #TrueGrids #Earnings

1
8
371
Jun 4
$LULU lululemon athletica inc. Announces First Quarter Fiscal Results
◆ Total Revenue: Gains 4.3% Y/Y to reach $2.47 Billion, driven by a steady climb in Men's Apparel ( 6.8%)
◆ Margin Deterioration: Gross Profit sits at $1.34 Billion, heavily pinched by rising production overhead as Cost of Revenue jumps 14.7% Y/Y
◆ Net Income Impact: Compressed operating margins pull final Net Income down -38.0% Y/Y to $195 Million
"More recently, we have been navigating headwinds that have led us to adjust our outlook for the full year." --
Meghan Frank, Interim Co-CEO and CFO.
#FinTwit #Stocks #Investing #DataViz #Sankey #TrueGrids #Lululemon

5
4
289
Jun 4
$DOCU just released its fresh quarterly print.
◆ Total Revenue: Climbs 8.7% Y/Y to land at $830 Million
◆ Operating Leverage: Operating Income surges an impressive 84.7% Y/Y to cross $111 Million
◆ Cash Generation Engine: High-margin software efficiency helps print $78 Million in final Net Income ( 8.5% Y/Y)
"We continue to expect that IAM will represent approximately 18% of total ARR exiting Q4 of Fiscal 2027, up from 10.8% of total ARR exiting Q4 of Fiscal 2026." -- Investor Relations
#FinTwit #Stocks #Investing #DataViz #Sankey #TrueGrids #DocuSign

5
187
Jun 3
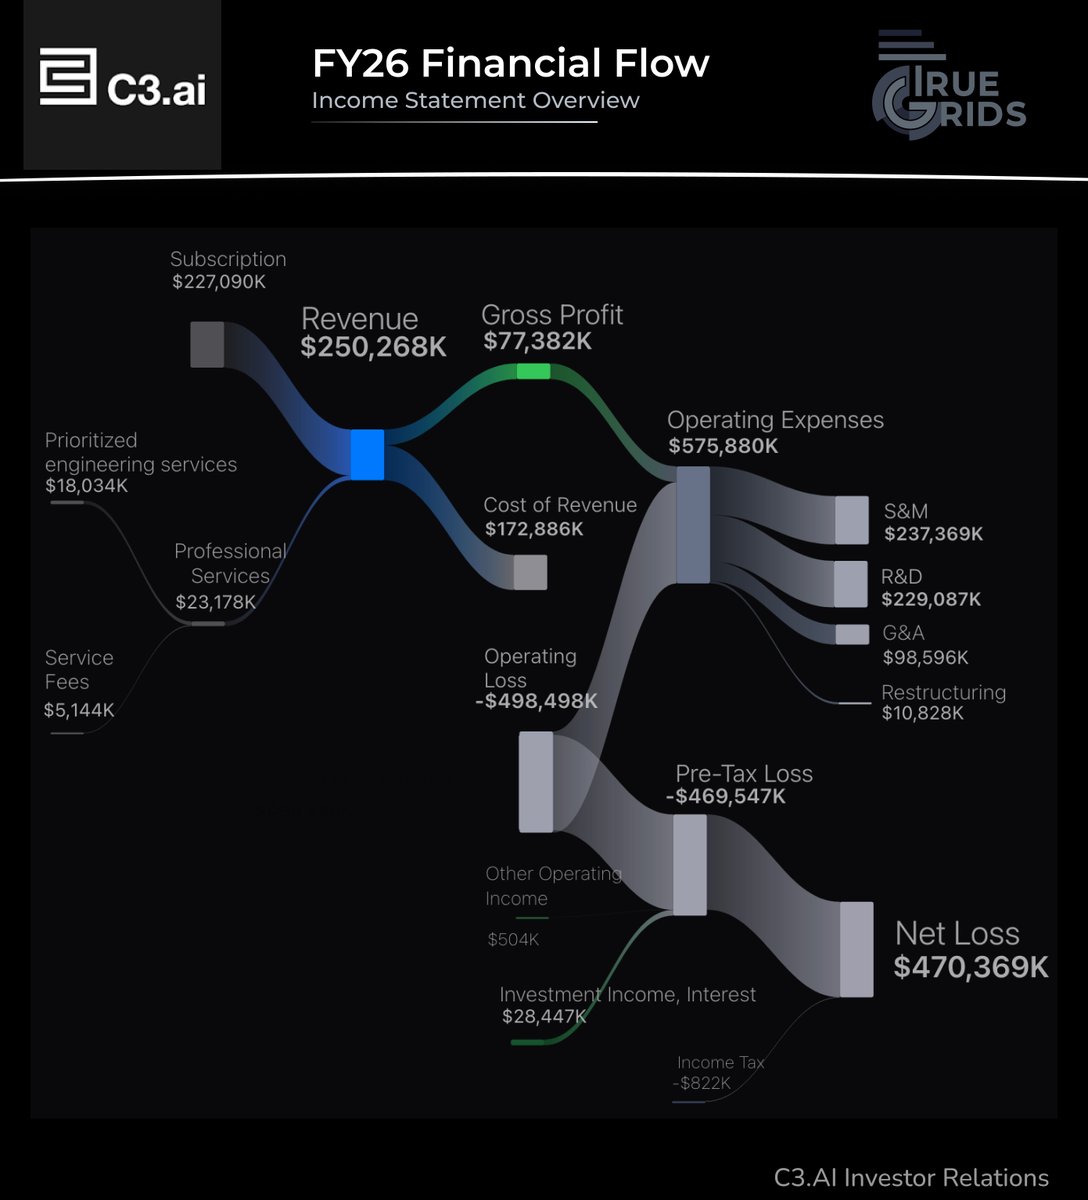
$AI reported its full-year Fiscal 2026 annual numbers.
◆ Annual Revenue: Lands at $250.3 Million for the full year
◆ Subscription Core: Dominates the top-line, bringing in $227.1 Million
◆ Net Loss: Heavy operational investments (S&M at $237M and R&D at $229M) lead to an annual GAAP Net Loss of -$470.4 Million.
#StockMarket #Trading #EnterpriseAI #Sankey #TrueGrids #Earnings
3
145
Jun 3
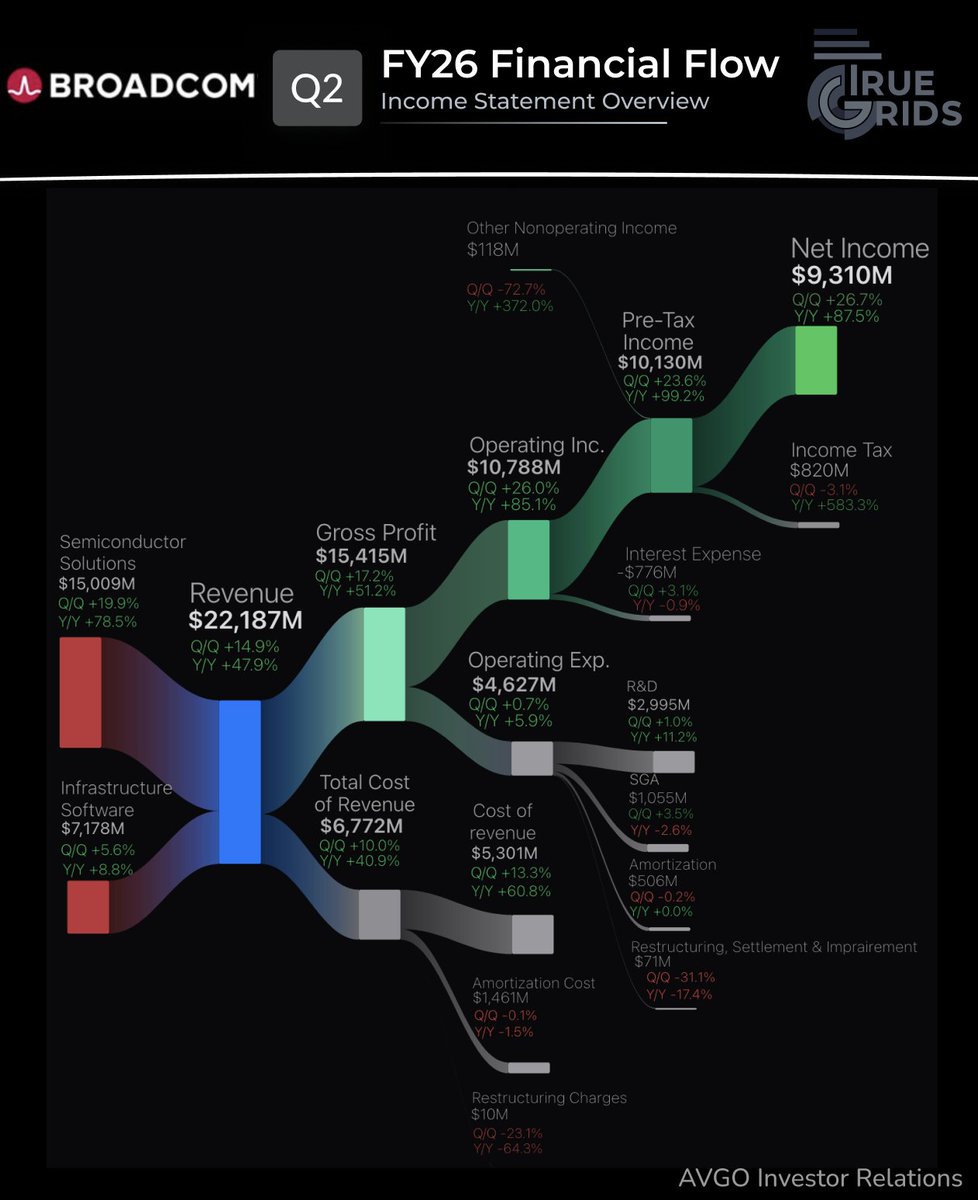
$AVGO Broadcom Inc. Announces Second Quarter Fiscal Year 2026 Financial Results and Quarterly Dividend.
◆ Total Revenue: Shatters expectations to hit $22.19 Billion ( 47.9% Y/Y)
◆ Segment Split: Semiconductor Solutions anchor the ship at $15.01B ( 78.5% Y/Y), while Infrastructure Software pulls in $7.18B
◆ Net Income: Skyrockets an incredible 87.5% Y/Y to reach a massive $9.31 Billion
5
313
Jun 3
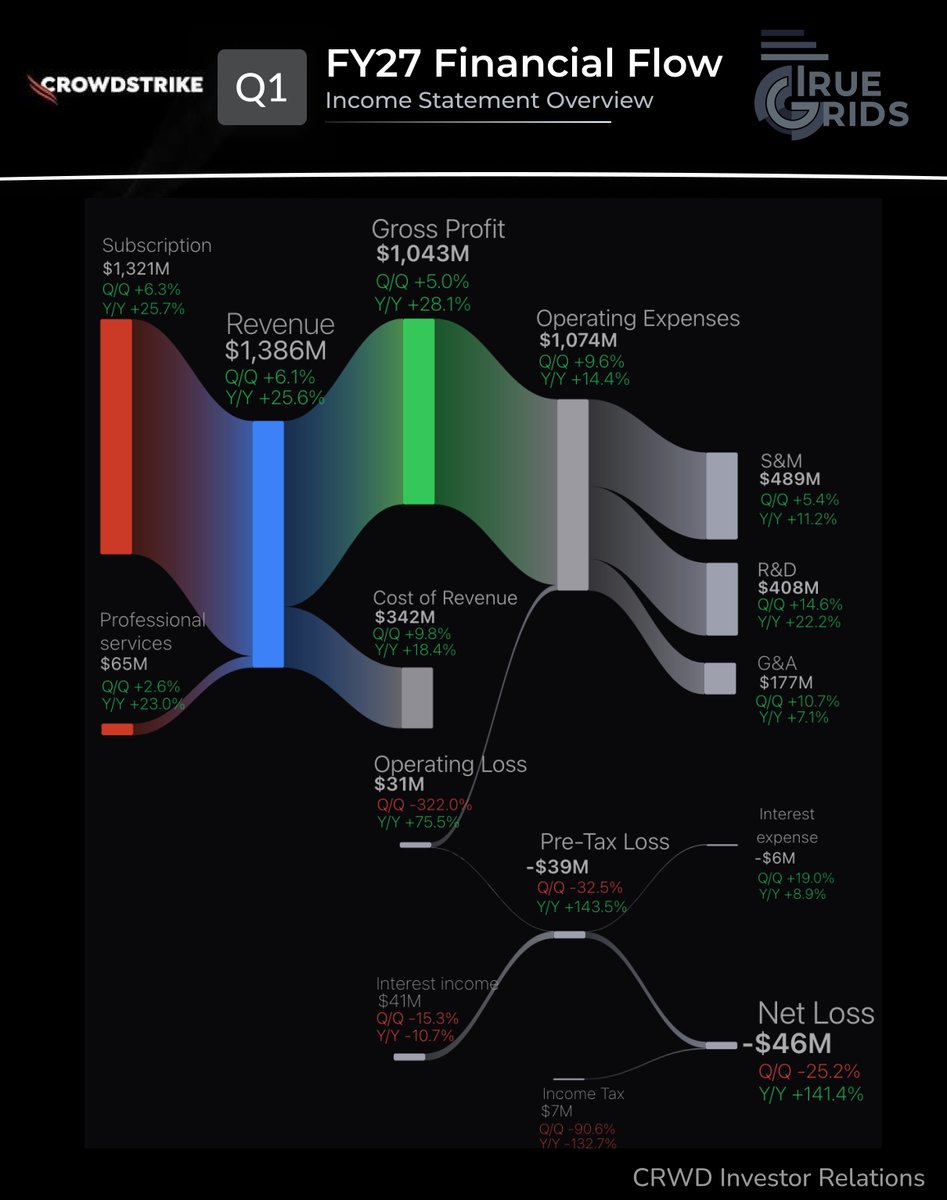
$CRWD
◆ Total Revenue: Climbs 25.6% Y/Y to reach a massive $1.39 Billion, completely anchored by high-margin Subscriptions ($1.32B)
◆ Gross Profit Engine: Explodes 28.1% Y/Y to cross $1.04 Billion, highlighting incredible software efficiency
◆ Strategic S&M and R&D: They remain in absolute land-and-expand mode, aggressively reinvesting $489M in customer acquisition and $408M in product engineering.
While heavy GAAP operational investments left a minor baseline Net Loss of -$46M on the tape, the forward visibility is clear as day.
#FinTwit #Stocks #Investing #DataViz #Sankey #TrueGrids #CrowdStrike
1
4
166
Jun 3
$M just dropped its fresh quarterly numbers, and the market is paying close attention to their structural pivot. Their "Bold New Chapter" turnaround strategy is showing early signs of real margin stabilization.
We mapped their entire 10-Q filing into a high-visibility financial flow chart to track exactly how top-line sales filter down into pure profit:
◆ Net Sales: Lands at $4.68 Billion ( 1.8% Y/Y)
◆ Other Revenue Streams: Credit Card Revenue ($172M) and Macy's Media Network ($38M) provide crucial high-margin support
◆ Net Income: Jumps a strong 65.8% Y/Y to reach $63 Million, supercharged by $15M in gains on real estate sales
Skip the dense corporate tables and visualize the complete lifecycle of a brick-and-mortar giant's cash flows below!
#FinTwit #Stocks #Investing #DataViz #Sankey #TrueGrids #Macys

1
4
107