
Investor | Special Forces
Joined October 2025
- Tweets 19
- Following 96
- Followers 21
- Likes 80
Photos and videos
Dimitris Vourtos retweeted

May 25
Crypto Twitter is watching Coinbase Premium for the $BTC buy signal.
That's step five.
You’re missing steps one to four.
When you see it turn, it’s too late.
Here is the exact sequence that needs to happen before $BTC makes its next big move.
Step one. War negotiations progress. Energy prices fall.
Step two. Inflation expectations come down.
Step three. Fed loosens conditions. Liquidity Pulse recovers.
Step four. Institutional capital flows back through the risk curve.
Step five. Coinbase Premium recovers to positive.
Step six. Technical indicators confirm. The crowd buys.
Most people buy at step six.
That’s why simply following charts is for amateurs.
You now know what to watch at step one.
Save this.
Check it every week.

3
1
8
239
Dimitris Vourtos retweeted

15 Oct 2025
Does M2 really lead #Bitcoin?
M2 has experienced a surge in popularity over the past couple of months, largely due to its "eyeballed leading relationship" with $BTC and #cryptocurrency.
But what do the actual numbers say?
If you create a Bitcoin Fair Value Model against M2, you'll find something interesting.
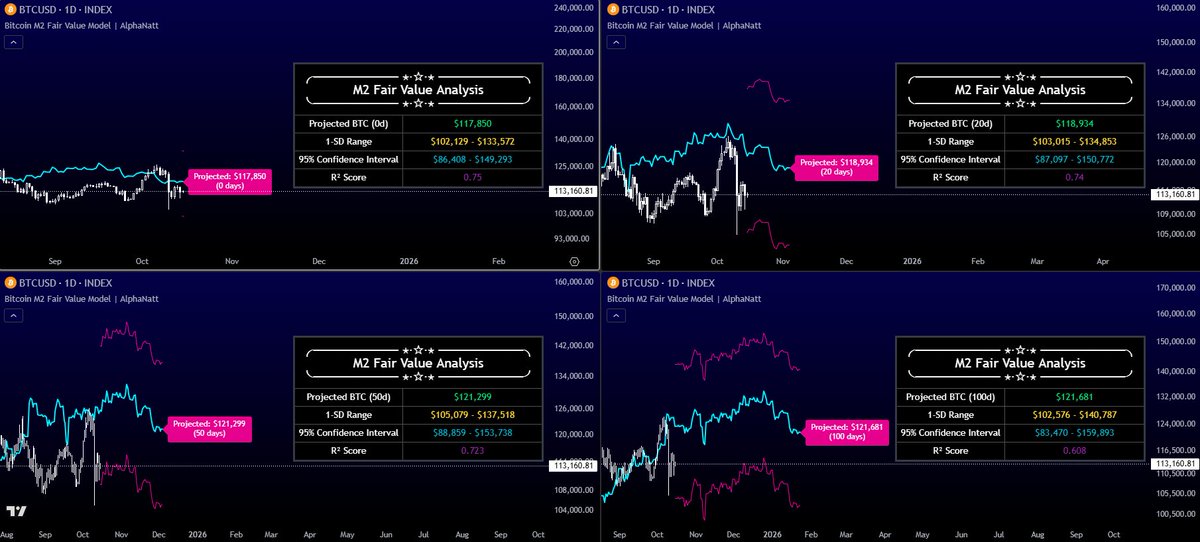
Look at the picture below, you'll see four different fair value analysis tables. They all model BTC against M2, but with the key difference of having different lead days.
In the top left pane, fair value is analyzed with a 0d lead, or in other words, a coincident measurement.
In the top right pane, fair value is analyzed with a 20-day lead, or in other words, with M2 leading bitcoin by 20 days.
The bottom two panes are the same, with 50d and 100d lead times.
What's interesting here is the R^2 score, which measures how well of a fit the model is, strongly decreases as the M2 lead value increases.
With no lead, the R^2 score is 0.75
With a 20-day lead, R^2 is 0.74
With a 50-day lead, R^2 is 0.723
With a 100-day lead, R^2 is 0.608
This relationship holds well past 100 days.
But what does this actually mean?
In simple English, the more the model analyzes incrementally leading relationships between M2 and BTC, the weaker the relationship becomes.
In other words, the more we try to "prove" M2 leads BTC, the worse results we obtain.
From this, we can conclude that the highest quality lead-lag relationship between M2 and BTC is when the M2 lead is lowest, at zero (excluding lagging relationships).
M2 holds the strongest relationship with BTC when they are analyzed coincidentally, not with a lead.
The grand takeaway from this is:
M2 does not lead Bitcoin!
At best, it is coincident with it.
This also complements the work of @crossbordercap, who has shown that M2 does not lead bitcoin (through Granger causality tests), but GLOBAL LIQUIDITY does.
Global liquidity is a far superior leader to BTC as of today, and should not be confused with M2.
So if you see another KOL on X talk about "M2 and its crazy good relationship to BTC", remind them that it is false!
3
5
76
11,419
Dimitris Vourtos retweeted

10 Oct 2025
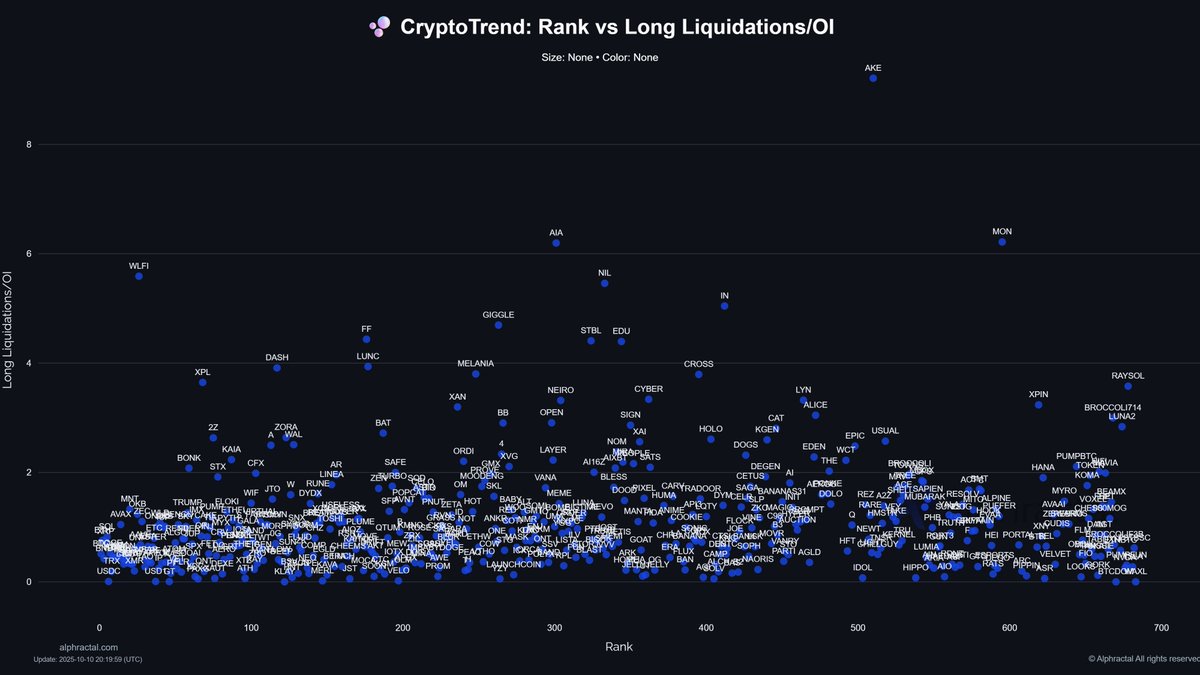
3 interesting metrics show that the market is going through a deleveraging phase!
1 – Liquidations 24h / Open Interest
The higher this ratio, the more liquidations have occurred — both Long and Short. Coins like WFLI, ZECDASH, ZORA, GIGGLE, AIA, among others, have seen a significant number of positions wiped out.
2 – Long Liquidation 24h / Open Interest
This one focuses on coins that are falling and driving the market’s deleveraging. In short, traders were excessively long on these altcoins, and the market dropped to liquidate them.
3 – Short Liquidation 24h / Open Interest
Here, prices had to move up to wipe out short traders. Notice there are fewer coins — recently, only a handful have actually been rallying.
From a broader view, these liquidations act like a cleansing process, shaking out short-term optimists and pessimists alike.
And at the end of the day… the ones who win the most? The exchanges, pocketing the profits from massive liquidations. 💥
Charts: @Alphractal


3
6
43
7,965