
Joined December 2017
- Tweets 1,148
- Following 305
- Followers 4,455
- Likes 480
552 Photos and videos


May 28
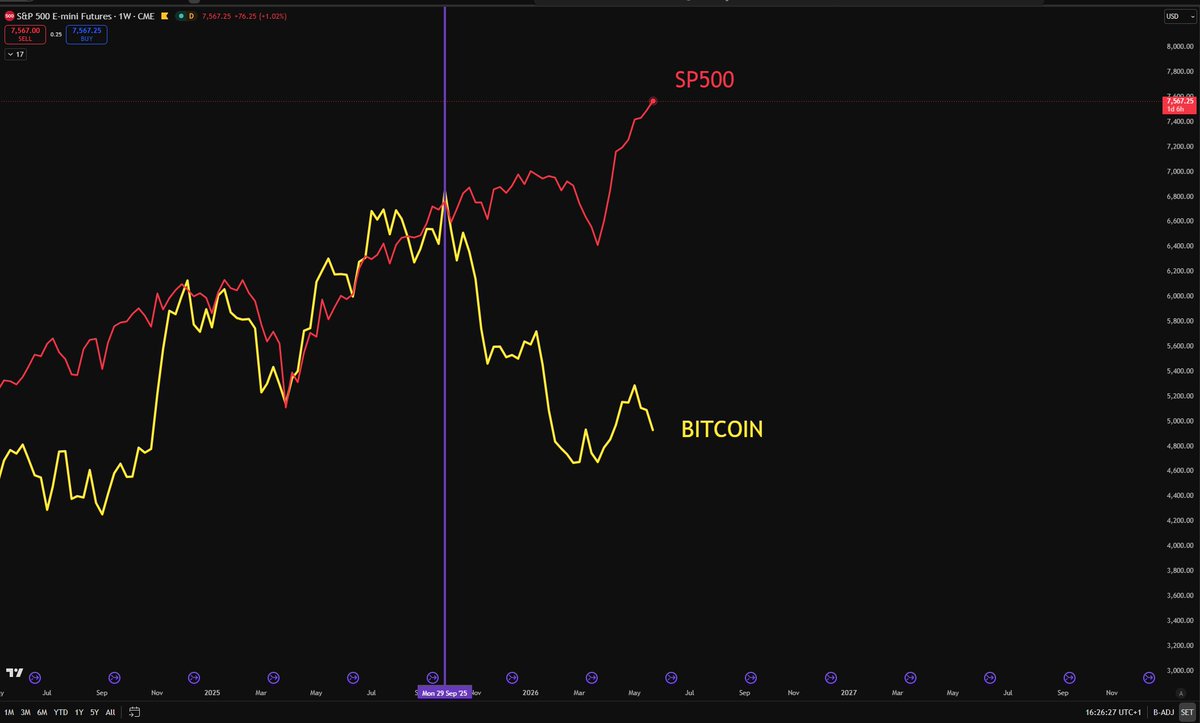
Já foram felizes no passado, mas a relação não resistiu...
Quem é que terá pedido o divórcio em primeiro lugar? Bitcoin ou o SP&500?
8
526
May 17
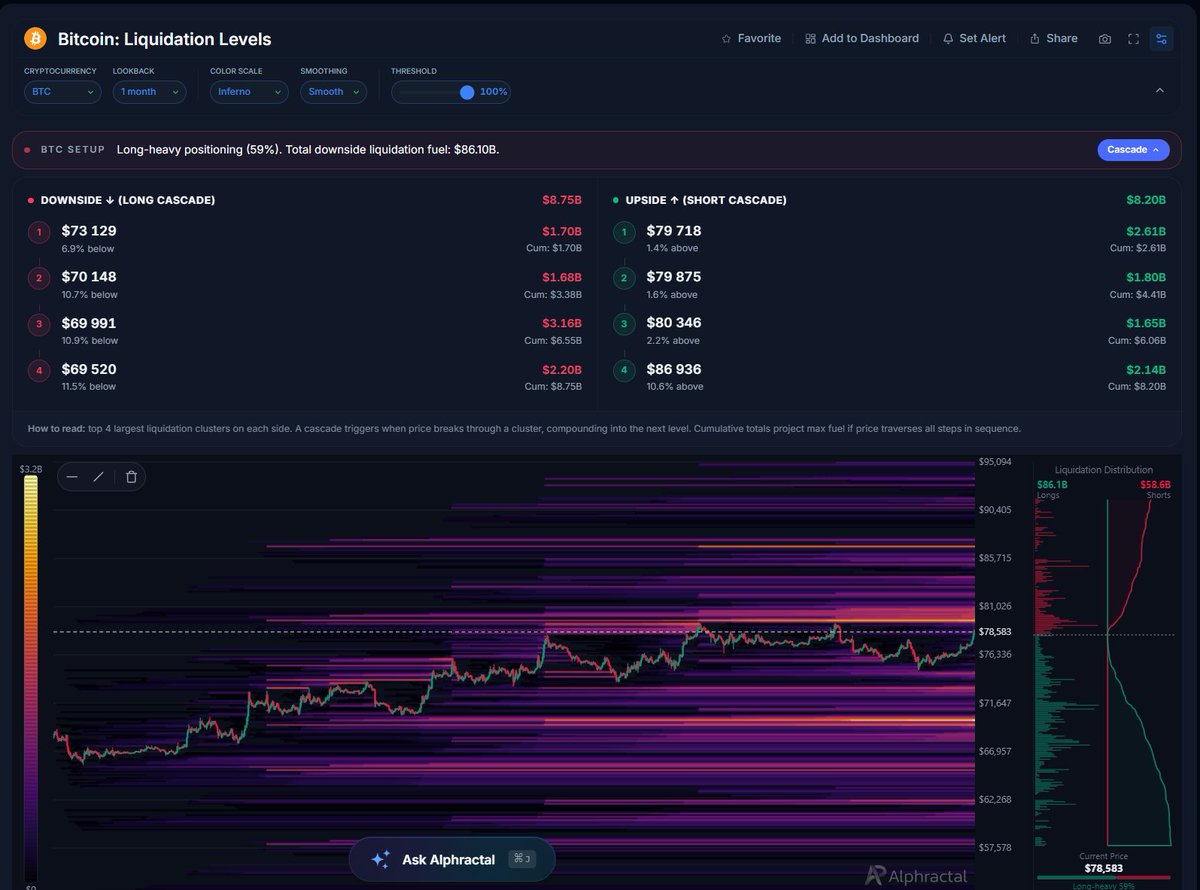
As Baleias estão claramente bearish comparando com o posicionamento do retalho. O Whale vs Retail Delta da @Alphractal mostra uma queda acentuada nesta fase final da subida de Bitcoin.
Queda iminente a caminho?
1
2
14
833
May 1
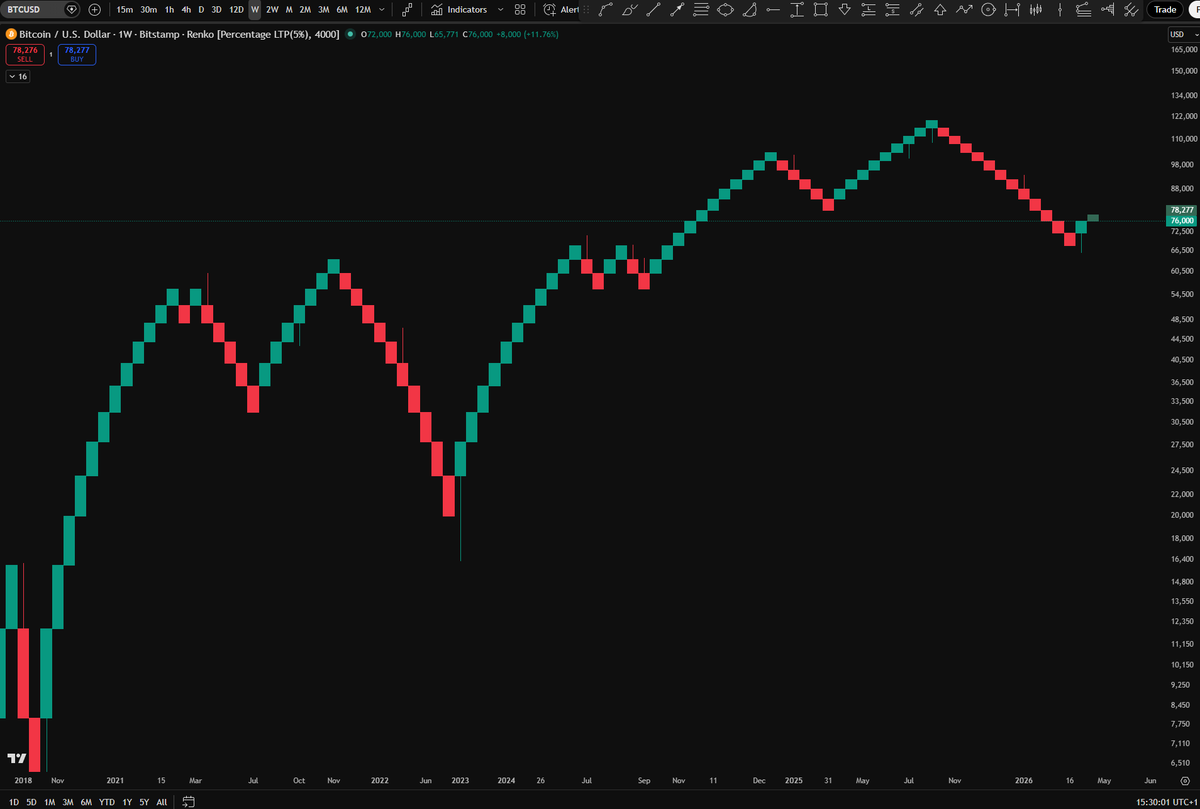
As velas de Renko são boas para filtrar muito ruído. BTC acabou de ficar bullish?
5
13
609
May 1
Depois de tanta lateralização os market makers vão ter de optar para que lado querem levar o mercado para ir buscar liquidez. O problema é se quiserem entalar bulls e bears...
7
572
AlexMarkets retweeted

Apr 30
Bitcoin will make a price bottom when the S&P 500 vs. U.S. M2 fractal starts moving sideways.
Based on my estimates, this will happen around September to October of this year.
And here is the point:
The global economy has changed a lot in recent years, and one of the direct impacts of this was caused by artificial intelligence companies.
The crypto market was no different. Part of people’s attention migrated to AI, new ways of working, and new types of content for content creators.
The crypto and Web3 market felt this impact, as data shows that fewer investments have gone into Web3 since 2023, while attention and new money moved toward AI.
But I am very confident that all this liquidity from the supposed “AI bubble” will eventually migrate to emerging economies and risk assets, and Bitcoin fits exactly into that category.
So I am leaving my opinion here: maybe the next bullish cycle in the crypto market will be completely decoupled from TradFi.
Think about it with me: where will the big profits from ETFs and major crypto players go?
Most likely, they are preparing their wallets and infrastructure for a cycle of liquidity rotation from markets that are rising into markets that are still down, and one of those markets is crypto.
While many people are crying and feeling discouraged, I am here saying that we could potentially see better days for the crypto universe, even if the empire of major economies like the U.S. is already economically deteriorating.
This is how the biggest players operate: moving money between sectors and orchestrating everything, including the narrative, in their favor.
I could be completely wrong and miss this call, but I am leaving here an opinion that nobody is talking about.
So when hope seems completely exhausted in the crypto market, that is where the best opportunities will appear. And I will probably be here to remind everyone.
Those who follow us know that, at the end of 2022, I was already believing in a bullish move, while many were still skeptical and afraid.

Apr 17

S&P 500 / M2 is repeating the dot-com fractal.
Not a coincidence. It's structure.
Dividing S&P 500 by M2 removes monetary noise and reveals the market in real liquidity terms.
The 2000 peak and the 2026 peak are nearly identical on this metric. Same extension. Same momentum. Same denial at the top.
The market didn't change. The narrative did.
In 1999 it was "the internet changes everything."
In 2026 it's "AI changes everything."
Both statements are true. The valuations are not.
The dot-com bubble didn't burst because the technology failed. It burst because expectations drifted too far from reality. Speculation assigned a weight that fundamentals couldn't support.
Same structure. Same behavior. Different story.
The chart projects a return to the 0.382 Fibonacci level as the first real support, a zone that aligned with the 2002~2003 lows in the previous structure.
Below that, 2009 marked the definitive bottom of the S&P 500 / M2 crash. Coincidentally, that's when Bitcoin was born.
Global liquidity will determine the speed. Not the direction.
The question is not whether this is a bubble. It's where in the cycle we are.
History doesn't repeat.
It rhymes.

11
19
104
6,975
AlexMarkets retweeted

Apr 30
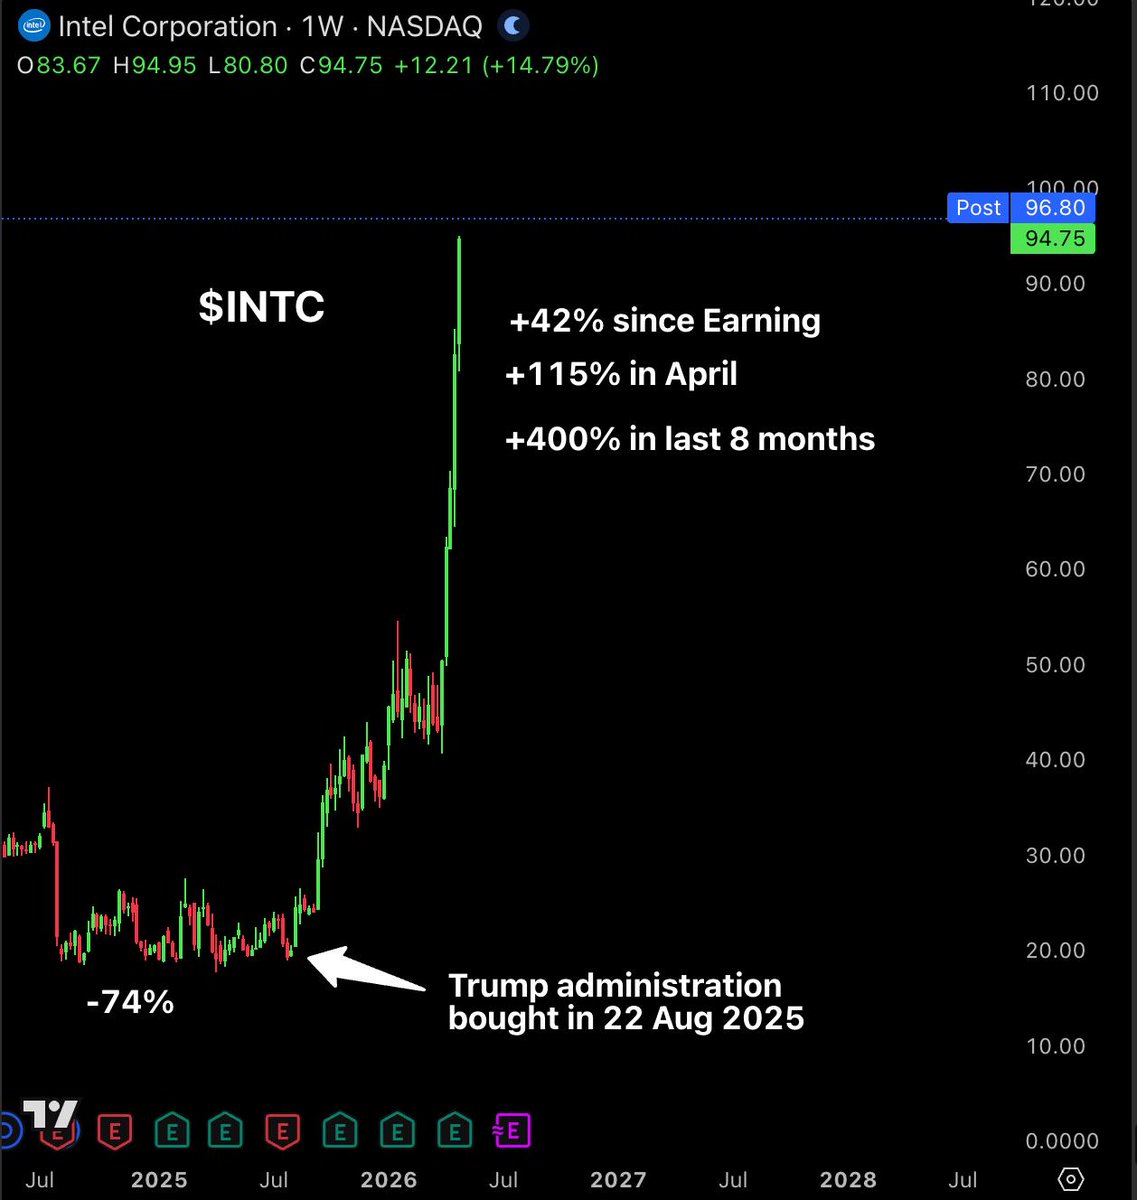
BREAKING: The U.S. government made more money on one stock trade than most countries earn in a year.
Trump administration bought $INTC at $20.47 on August 22, 2025 when the stock had crashed 74% and everyone said the company was dead.
They invested $8.9 billion for 433.3 million shares using leftover CHIPS Act money.
Intel is now trading at $83.67, up 400% in the last 8 months and 115% in April alone.
That's a $33.6 billion profit.
223
303
2,031
249,337
Apr 30
Ai Claude... E eu a pensar que tínhamos uma relação baseada na honestidade, afinal... Se já fazes isto sem computação quântica, imagino daqui a uns aninhos...
2
10
609
Apr 30
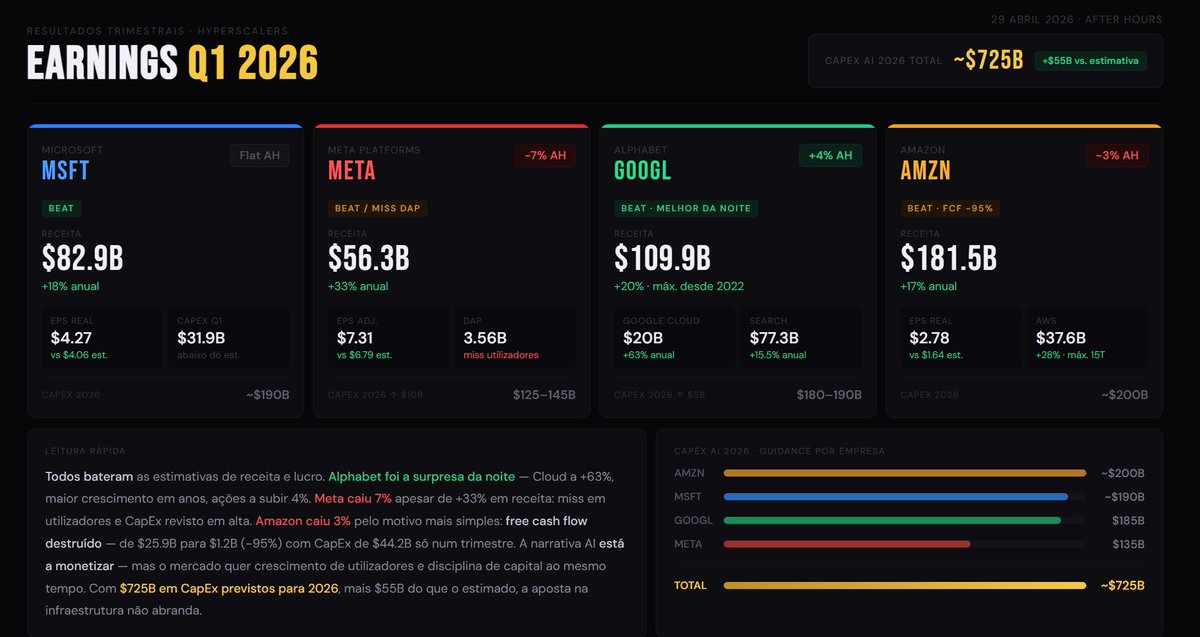
Parece que bater estimativas já não chega...
O mercado quer utilizadores a crescer e cash flow intacto.
O investimento em IA continua muito forte!
7
369
Apr 30
Quem é que vai investir ao saber que vai ter de pagar lucros não realizados?
Isto é simplesmente estúpido!
Um golpe baixo dos Países Baixos.

The Netherlands is introducing a 36% tax on unrealised investment gains - stocks, bonds and crypto.
You owe 36% on paper profits even if you haven't sold.
But that's not the worst part...
You will still owe taxes on those assets EVEN IF they had fallen in value before the tax bill arrived.
The Shopify CEO called it "the dumbest thing any government on planet earth is pursuing right now."
He's not wrong.
2
9
1,032
Apr 30
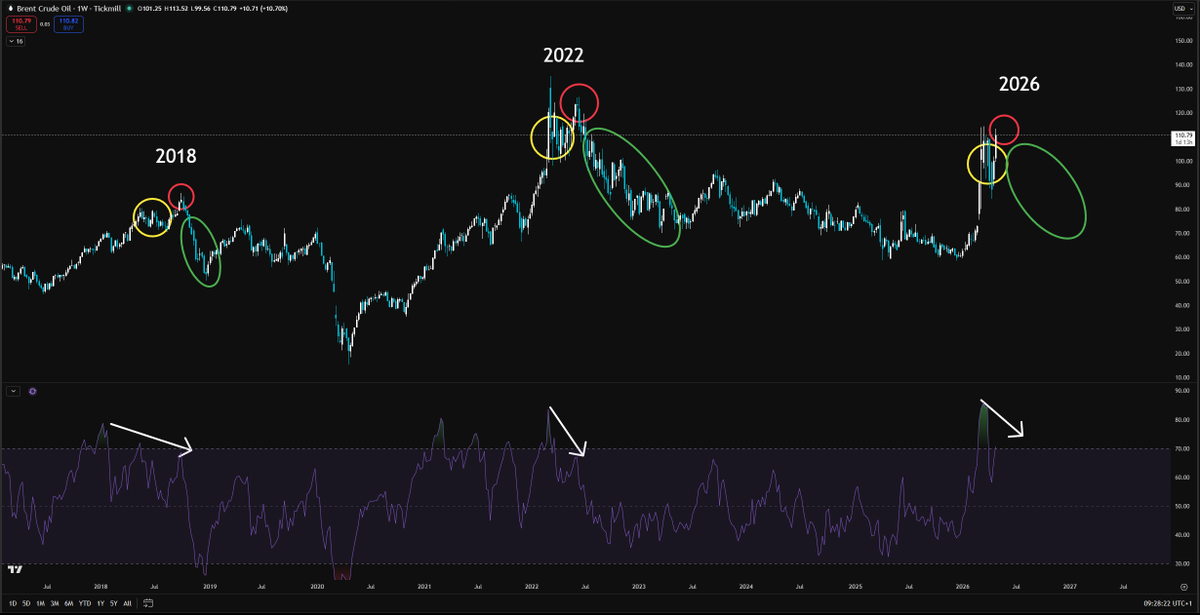
Brent Crude. 2018. 2022. 2026.
O mesmo padrão pode estar a repetir-se.
Impulso = fase amarela
Breakout da bull flag e formação de topo = fase vermelha
Movimento corretivo = fase verde.
Ainda não há confirmação, mas a divergência do RSI será uma realidade.
A história tem tendência a repetir-se e os nossos bolsos agradeciam...
3
14
552
Apr 29
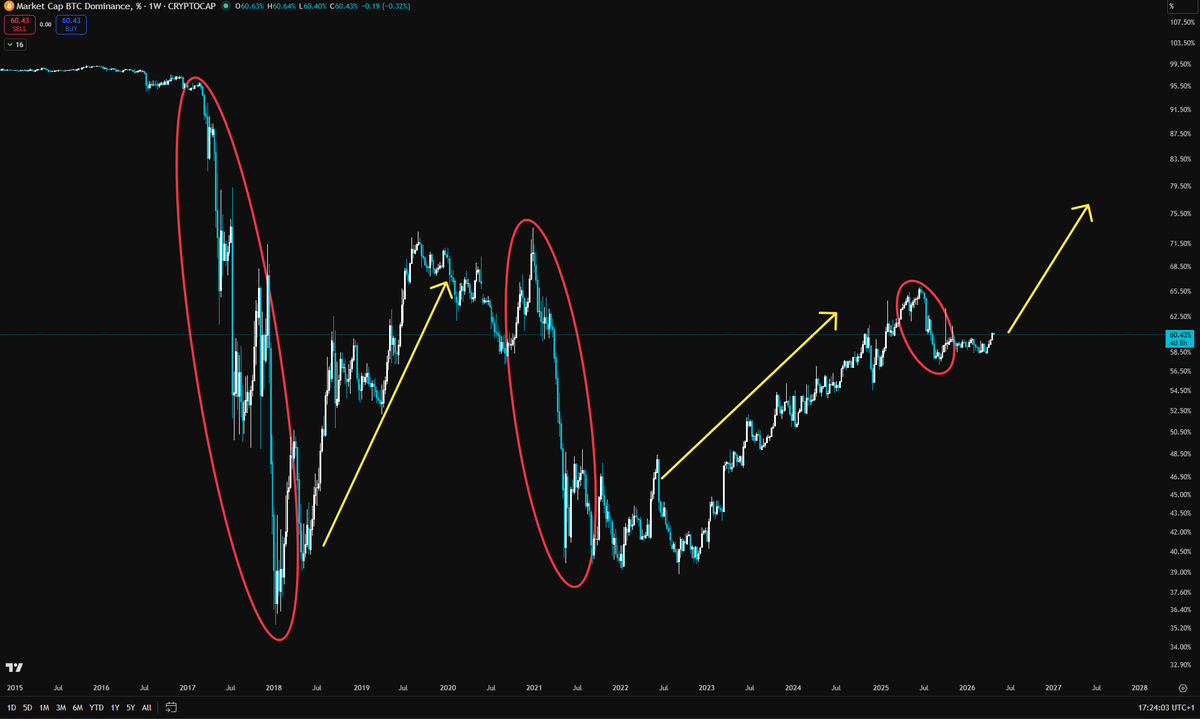
Reparem como as #Altseasons têm diminuído com o passar dos ciclos (assinalado a vermelho).
Após quedas anteriores a dominância de $BTC subiu sempre. Se a história se repetir, podemos ver a dominância de BTC acima dos 70%, podendo mesmo chegar a uns impensáveis 80%.
2
16
1,054
Apr 21
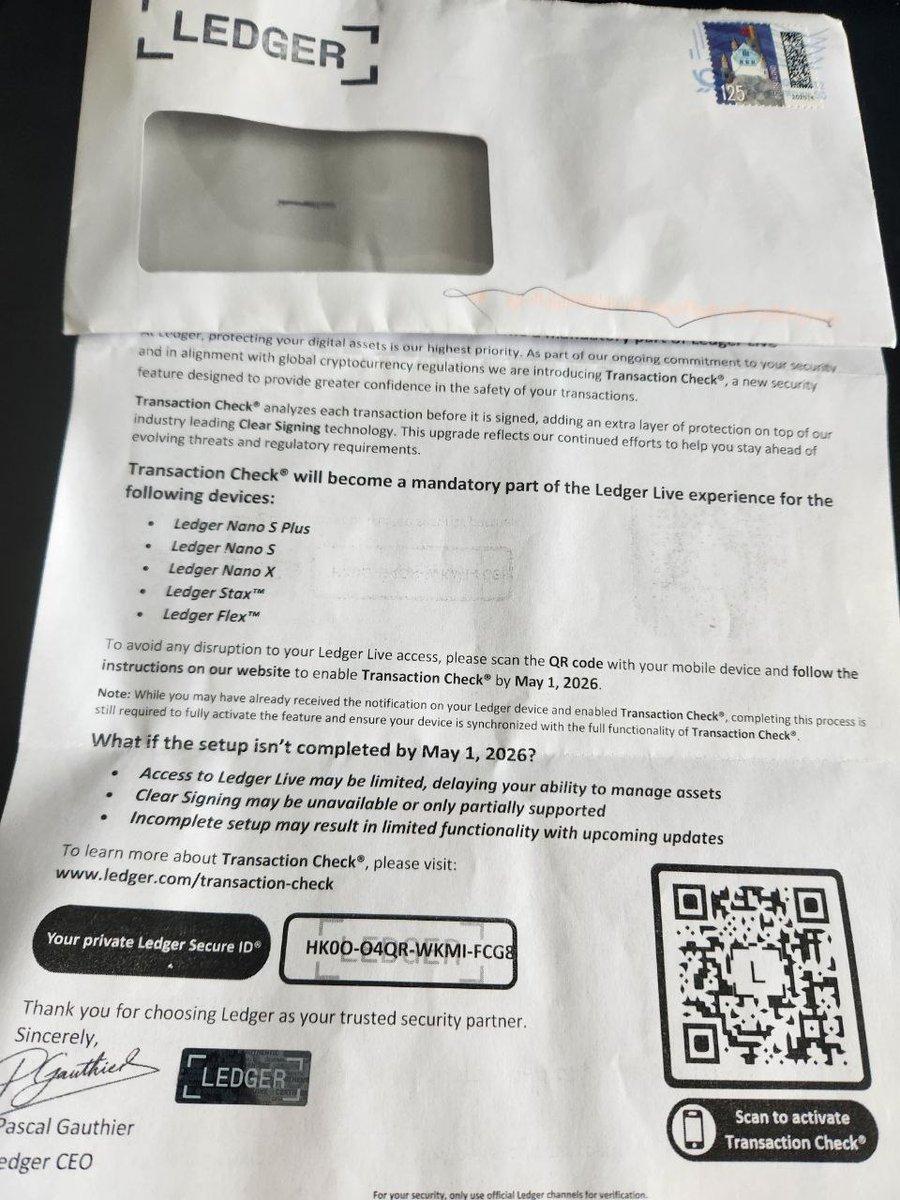
Atenção aos Scammers, até cartas já enviam para tentar sacar as seeds. Partilha para que estas bestas não consigam roubar o dinheiro de ninguém. ISTO É UM SCAM!
4
16
938
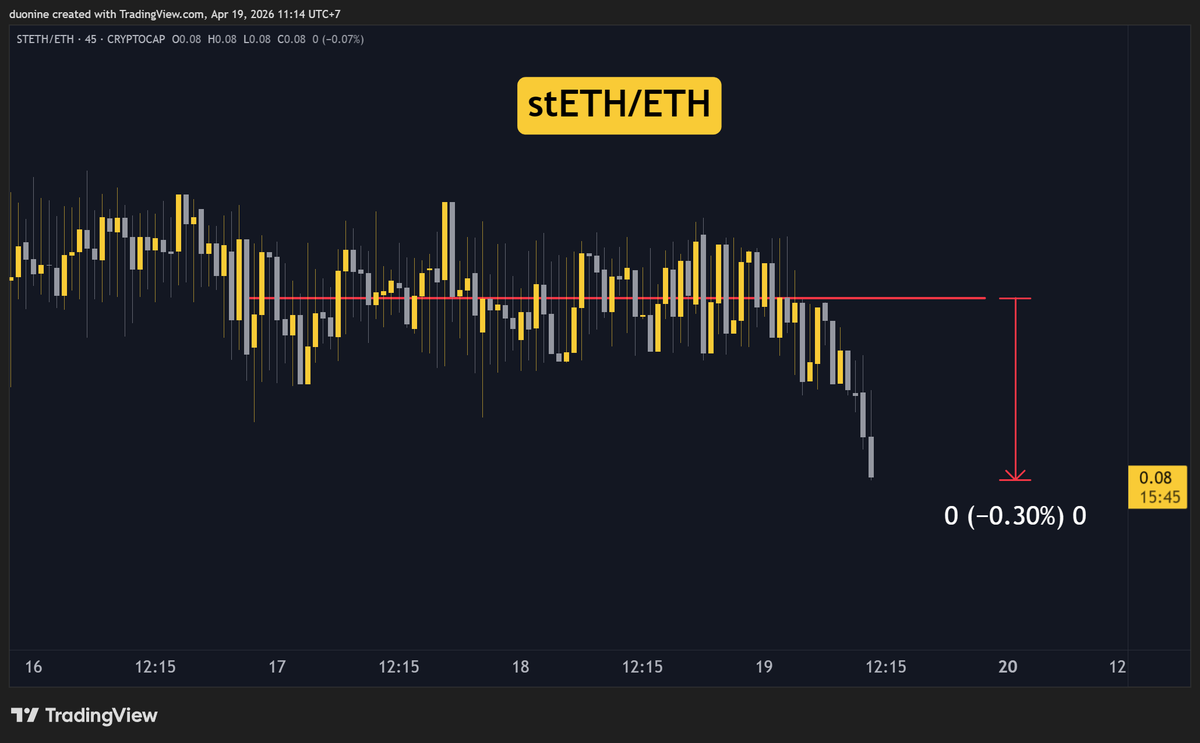
Apr 19
Sinal de desespero!
Apr 19

Aave protocol is now giving premium APY on stables, should we pull the trigger or too risky due the the current hack?

1
2
772
Apr 19
É nestas alturas que um gajo pensa se acontecesse alguma coisa, a quem é se iria bater à porta para pedir responsabilidades? O DEFI não pode continuar a funcionar como uma selva, é preciso existir algum tipo de proteção de capital para quem coloca lá o seu dinheiro, um seguro, uma coisa qualquer... o DEFI precisa de deixar de ser uma utopia e passar a ser um sistema que dê confiança aos seus utilizadores.
Depois de 10/10, não surpreende que muita gente não tenha regressado e depois questionamo-nos quando é que vai existir uma Altseason com estas merdas a acontecerem de forma regular.
Apr 19

Lido stETH is losing its peg. Monumental liquidations are about to happen.
AAVE ETH markets are illiquid at over $6 billion. ETH borrow rates on Fluid and Maker at >100% APR.
This is a systemic disaster of epic proportions. Liquid staked tokens like rsETH were a mistake.
3
8
1,029
Apr 15
Neste episódio analisamos as razões pelas quais os mercados financeiros estão a ignorar o que parece ser uma das maiores crises geopolíticas das últimas décadas. Com dados reais, análise do economista Ed Yardeni (que previu o bottom do S&P a 6 de Abril), e uma perspectiva que os media tradicionais não estão a cobrir. youtu.be/AIWGY9Qri6s
2
321
Apr 8
Um dia de boas notícias, finalmente!
Apr 8

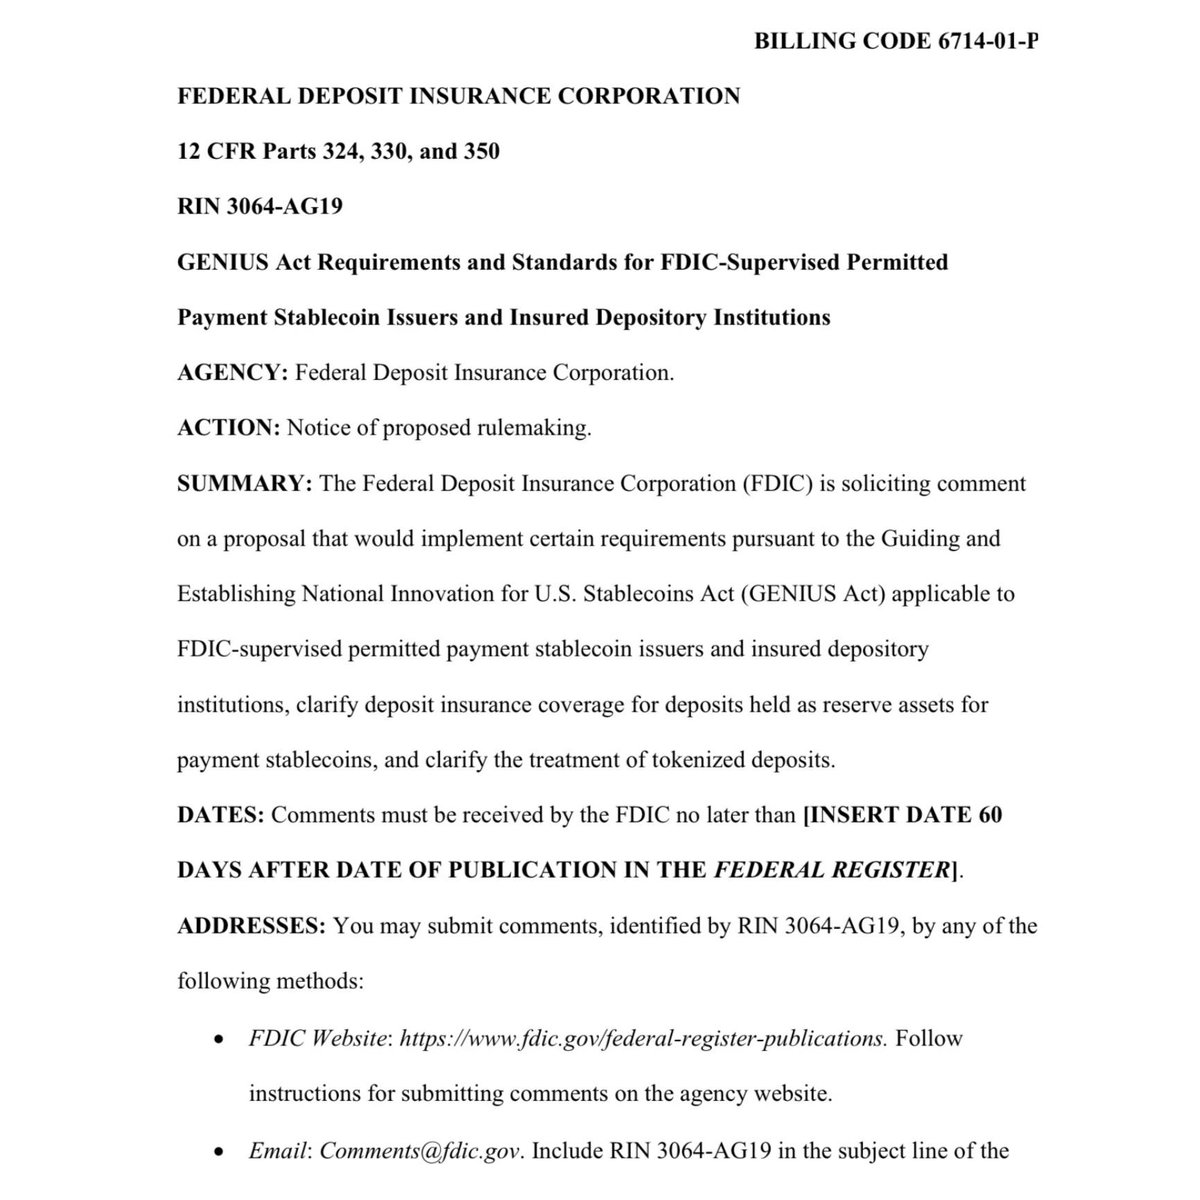
BREAKING: The US government just created the first official banking rules for stablecoins.
The FDIC today approved a full regulatory framework for stablecoin issuers under the GENIUS Act. Here is what it means:
Every stablecoin must be backed 1:1 with real assets. If there are $1 billion worth of stablecoins in circulation, the issuer must hold $1 billion in actual reserves without any exceptions.
Every stablecoin must be redeemable on demand at face value. If you hold $100 in stablecoins, you can always get $100 back.
Reserve assets cannot be rehypothecated or reused. The reserves must sit fully segregated and cannot be used for any other financial activity.
Stablecoin issuers cannot pay interest or yield to holders simply for holding the coin. This directly affects yield bearing stablecoin products currently in the market.
If redemption requests exceed 10% of all outstanding stablecoins within a single 24-hour period, it triggers a significant redemption event requiring immediate action.
Stablecoin issuers must meet capital requirements and risk management standards similar to what banks follow. Quarterly reporting and CEO signed audits are required. Banks that hold or manage stablecoins on behalf of customers fall under the same rules.
One important clarification. FDIC insurance covers the issuer's reserve deposits at the bank level, not individual token holders.
Why this is good for crypto?
Right now stablecoins operate in a gray area. No clear rules means no trust from institutions, no trust from regulators, and no certainty for users. These rules change that. Regulated stablecoins backed by real reserves and covered by FDIC insurance become as safe as a bank deposit.
That opens the door for banks, pension funds, and large institutions to use stablecoins without legal risk. A regulated stablecoin market is the foundation that the rest of crypto needs to grow.

1
456
Apr 8
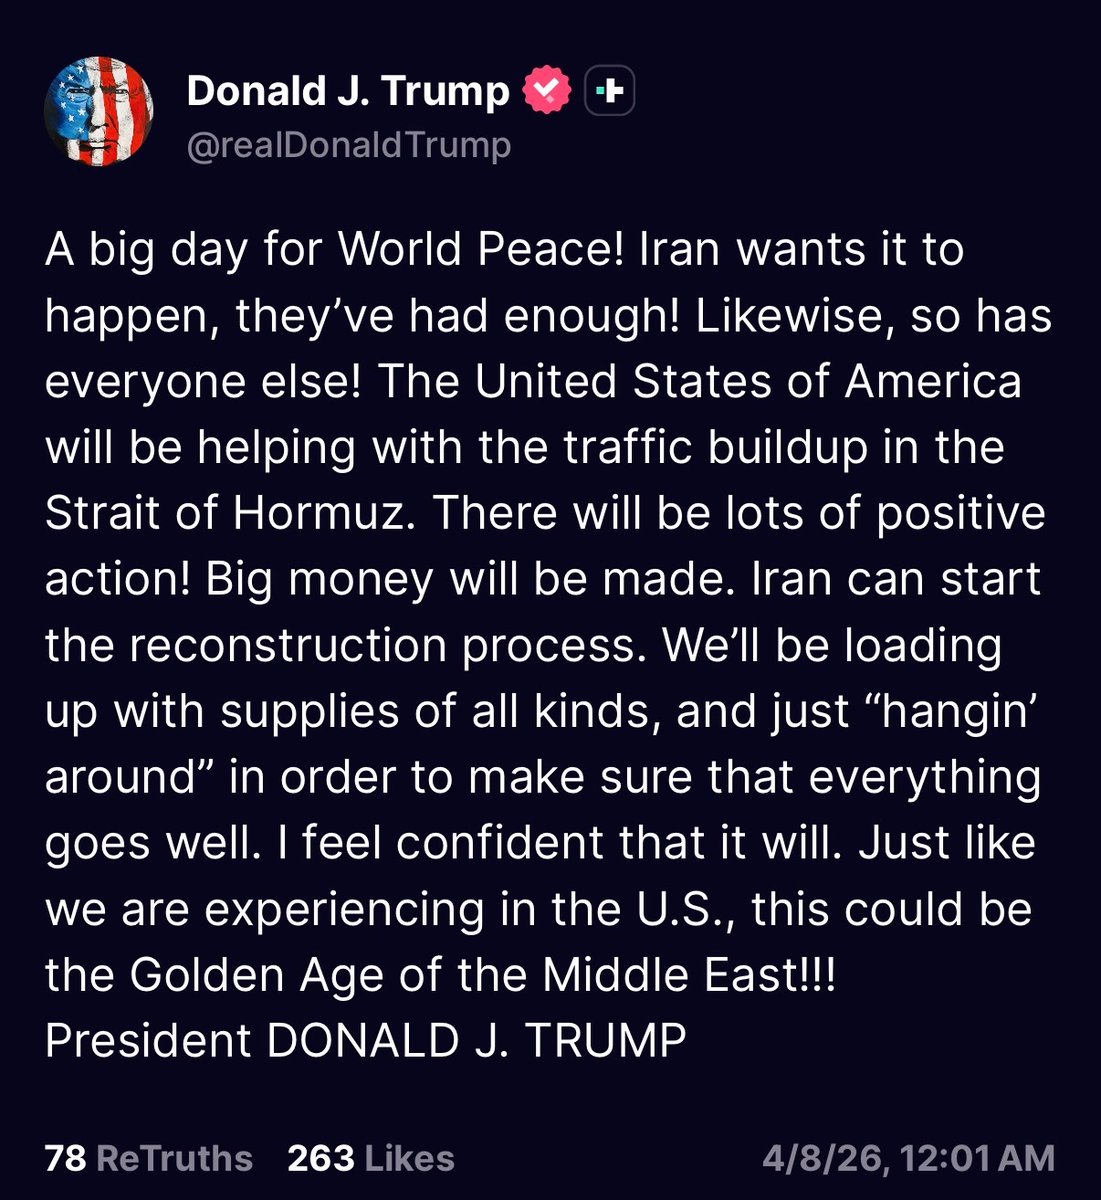
This is the way!

BREAKING: President Trump says the US will be "helping with the traffic buildup" in the Strait of Hormuz, Iran can "start reconstruction," and the US will be "loading up with supplies and just 'hanging around' in order to make sure everything goes well."
"This could be the Golden Age of the Middle East," Trump adds.
2
328
Apr 7
Mais uma prova que a Europa tem que fazer pela vidinha...
O que é inacreditável é que estão a dar apoio a uma personagem que é um tentáculo russo. Russos esses que andam a alimentar o Irão na guerra contra os USA.
Isto é xadrez a 10D...

🚨WTF: JD Vance just declared war on our European allies while campaigning in Budapest, Hungary, for Putin’s favorite anti-democratic thug. Viktor Orbán.
Is it now official policy of the U.S. to undermine our allies and side with Putin’s buddies?
JD Vance is an embarrassment.
6
496
AlexMarkets retweeted

Apr 7
🚨🇮🇷 URGENTE: O Irã está formando CORRENTES HUMANAS com crianças, estudantes e mulheres em frente a uma usina elétrica em Kazerun, numa tentativa de dissuadir os ataques dos EUA de hoje às 20h.
Somente terroristas usam o povo como escudo humano!
492
2,290
9,489
265,654
Apr 7
Infelizmente, mais pessoas do que pensamos.
O mundo está doente e muitos já perderam a noção do que é certo e do que é errado, onde tudo se justifica, tudo se aceita, até o sacrifício de um povo que já sofreu tanto às mãos de um regime tirano.
Apr 7

Trump: "A whole civilization will die tonight"
How can anyone defend this?
3
451