
Autometrics Explorer is a tool for enhanced application observability. Tracking function performance, latency, and error rates in context.
Joined February 2023
- Tweets 108
- Following 23
- Followers 159
- Likes 78
20 Photos and videos


Pinned Tweet

5 Dec 2023
Launching Autometrics Observability Stack!
Get 0 to 1 application level performance out of the box.
Auto-instrument your code, visualize your metrics and get context-rich alerts in Slack.
autometrics.dev/blog/announc…
2
12
679
Autometrics retweeted

3 Apr 2024
🚀🔎Elevate your Django app’s performance with ease! Our latest blog post explains how to add observability in just 3 steps using @autometricsdev. Say goodbye to complex monitoring setups and hello to real-time insights. Dive in: bit.ly/4aGNFIG
#Django #Observability
1
4
388
Autometrics retweeted
7 Dec 2023
Exciting update! 🚀
We created detailed deployment guides for @AutometricsDev on @northflank !
Deploy the Microframework effortlessly, get detailed app metrics, and boost performance.
autometrics.dev/blog/applica…
3
3
10
2,954
Autometrics retweeted
5 Dec 2023
Join us tomorrow at 11 am (CET) as we participate in a webinar hosted by @kunalstwt:
'Application 011Y with @AutometricsDev & beyond'
Discover how metrics can elevate your application performance in just 45 minutes! Don't miss out!
youtube.com/watch?v=roQX2HJO…
3
15
3,248
Autometrics retweeted
7 Nov 2023
We are excited to be at #KubeConNA to talk more about our upcoming @AutometricsDev 1.0 launch!
Make sure to stop by our booth and say hi and if you want to send a postcard to your friends and family we have you covered with our on-site post office

2
6
390
Autometrics retweeted

9 Nov 2023
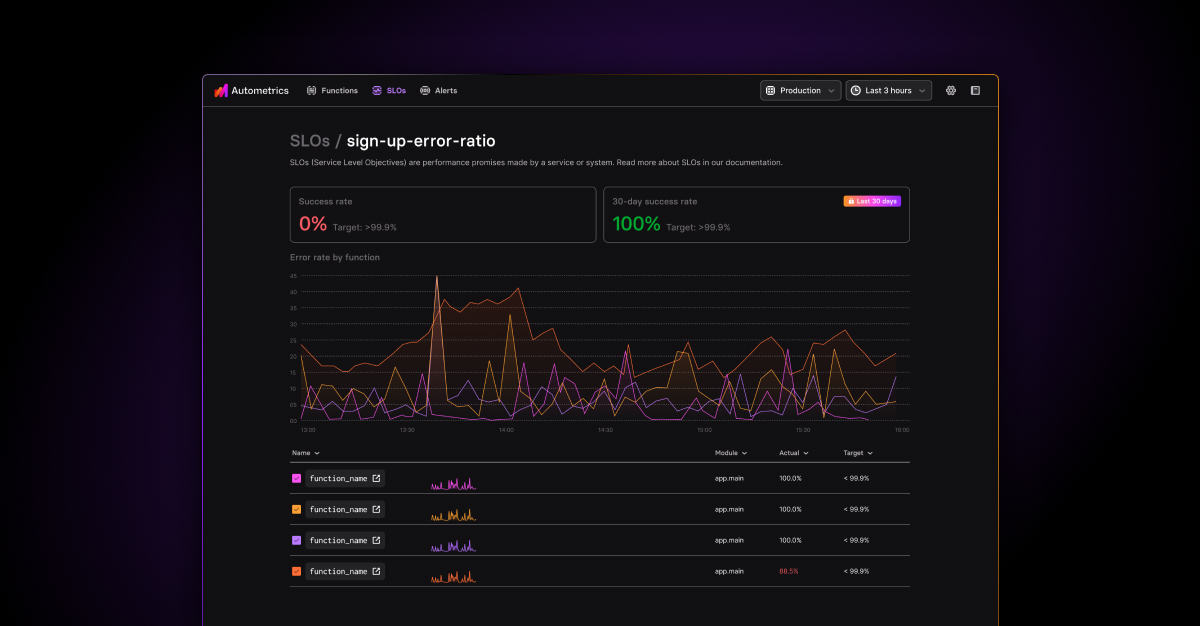
Another day, another @AutometricsDev release! Introducing the NEW Explorer Dashboard for #Autometrics! 📊
Our revamped start screen is here to enhance your operational intelligence with:
🎯 Improved SLO overview
🚨 Better alert monitoring
🕓 A history timeline for all your alerts
🔍 Spot the top 5 misbehaving functions at a glance
Read more on the blog: autometrics.dev/blog/introdu…
1
1
343
Autometrics retweeted
31 Oct 2023
We wrote an in-depth guide on how to get @opentelemetry metrics on top of @render with @AutometricsDev autometrics.dev/blog/deployi…
1
8
378
Autometrics retweeted
25 Oct 2023
📊 Monthly PSA on why we like metrics and created @AutometricsDev. Metrics often fly under the radar, but they're the unsung heroes of system monitoring. While logs and traces provide valuable context, metrics offer the big picture, helping us spot trends, plan for scalability, and fine-tune performance. I get that we all add printf statements as developers but metrics are cheap and carry a lot of signal. /end rant
1
1
267
24 Oct 2023
Introducing Call Graph - a new visualization in Autometrics Explorer to help you gain trace-like insights only with more granular, function-level metrics. Read more: autometrics.dev/blog/announc…
3
458

🌠 Community Highlights
Advanced edge function observability made simple.
By @AutometricsDev.
youtube.com/watch?v=G99ToGuW…

ALT Advanced edge function observability made simple.
1
4
4,921
Autometrics retweeted

Interesting tool of the week: autometrics.dev by @autometricsdev
We like: Add metrics to existing code with simple annotations or macros. Supports Rust, Go, Python, TypeScript, C#. Alerts and SLOs defined in code next to each instructed method. Can run locally
4
3
693

Tired of Obscure Code Performance? Discover Autometrics!
Join #OSMC and Ivan Merrill from @fiberplane to learn how this open-source framework simplifies observability for developers.
Say hello to clear insights!
osmc.de/talks/observability-…

2
2
287
Autometrics retweeted
18 Aug 2023
We just launched the @AutometricsDev explorer, your debugging companion featuring function-level metrics, service level objectives and alerts. @nele_lea wrote a tutorial on how get get started with a #python @FastAPI application: autometrics.dev/blog/using-a…
2
11
2,358
Autometrics retweeted
29 Sep 2023
We’re big fans of @grafana and right on the heels of #promcon we’re happy to publish our guide to zero-config dashboards and monitoring with @AutometricsDev autometrics.dev/blog/zero-co…
1
1
6
496
Autometrics retweeted

15 Sep 2023
Amsterdam!
I'll be giving a little talk about logs, metrics (and @AutometricsDev ofc) in a few weeks - come through!
15 Sep 2023

Check out AmsterdamJS meetup agenda!
@salamaashoush➡️Fine-Tuning Reactivity: Harnessing Power of Signals
@rage_monk➡️How to Make Friends with Android & Backend Departments
@_laurynas➡️TFW You can't Console.log Way out of Production Issues
Join us👉shorturl.at/dOZ19

2
5
500
15 Sep 2023
Wrapping up #stackconf. We had good conversations at our booth. Thanks for stopping by with your questions and thoughts.
2
9
399
Autometrics retweeted

18 Jul 2023
Adding observability to your code isn't cluttering your business code. It's part of your business.
7
19
6,115
17 Aug 2023
🚀Dive deep into debugging with Autometrics Explorer
Monitor function-level metrics and swiftly debug alerts. Easily set up with the Autometrics micro framework, visualize your code's performance, and pinpoint issues.
Learn more in @nele_lea's blog.
autometrics.dev/blog/using-a…
1
6
278
17 Aug 2023
🚀 @AlmightyGiraff introduces the #Autometrics Explorer UI.
Enhance #observability, track function performance, and debug faster than ever. Address issues from root to resolution effortlessly.
youtu.be/7ax3LwdTLqM
2
91