
Joined November 2022
- Tweets 3,734
- Following 1,011
- Followers 7,674
- Likes 2,311
698 Photos and videos


CapitalCosm retweeted

That was why fake Hormusz deal had to happen, AI valuations & IPO exit liquidity can't survive higher rates.

Pressure on the Federal Reserve to hike interest rates this year is easing after the US and Iran said they reached a deal to reopen the Strait of Hormuz, according to Leslie Falconio of UBS bloomberg.com/news/articles/…
7
11
145
7,977
CapitalCosm retweeted

Jun 6
🔴💥NEW INTERVIEW WITH @CapitalCosm
▫️Get Ready For The BIGGEST Market CRASH Of Your Lifetime | Gerald Celente
▫️WATCH NOW:
youtube.com/watch?v=wbfW6ZDr…
3
15
41
4,928
CapitalCosm retweeted

You Won't Be Able to Buy GOLD & SILVER At This Critical Level | Bill Holter & David Morgan @silverguru22
youtu.be/-XT7R9F52Ck?si=onoZ… via @CapitalCosm
3
7
919
CapitalCosm retweeted

Jun 2
Frank Giustra: Position in Junior Miners Before the M&A Cycle Returns.
With only a limited number of world-class copper deposits remaining, Frank Giustra warns that increasing scarcity will drive consolidation, with majors acquiring junior explorers as M&A activity picks up.
Watch the full Top of Mine interview to hear his outlook on mining M&A: youtube.com/watch?v=8Gtm5CYl…
20
73
340
65,459
CapitalCosm retweeted

Jun 2
HSBC Warns Of Commodity "Super-Squeeze" As Goldman Hikes Copper Forecasts zerohedge.com/commodities/hs…
54
332
1,571
220,917
CapitalCosm retweeted

Jun 2
🇪🇺 JUST IN: The European Central Bank says gold has overtaken U.S. Treasuries as the world's largest reserve asset.


83
203
1,260
151,878

CapitalCosm retweeted
Our catch up with Danny @CapitalCosm
youtu.be/ylCiFoNRCmI?si=86lA…
2
4
40
8,212

May 27
🚨 @DowdEdward joined me in today's episode to discuss the end of the road for the market. This is it, there isn't much time left. Lock in.
WATCH NOW: youtube.com/watch?v=3O4TTxZR…
3
1
12
910
May 24
🚨 My good friend and top oil expert @WhiteTundraSG joined me a couple days ago to issue a warning to humanity and our current energy trajectory...
WATCH NOW: youtu.be/duvz9-v6mIk
1
3
708
CapitalCosm retweeted

May 22
Thanks for inviting me to your show again @CapitalCosm!
youtu.be/Q-TUC1in_pg?si=DI41…
6
45
6,953
CapitalCosm retweeted

May 19
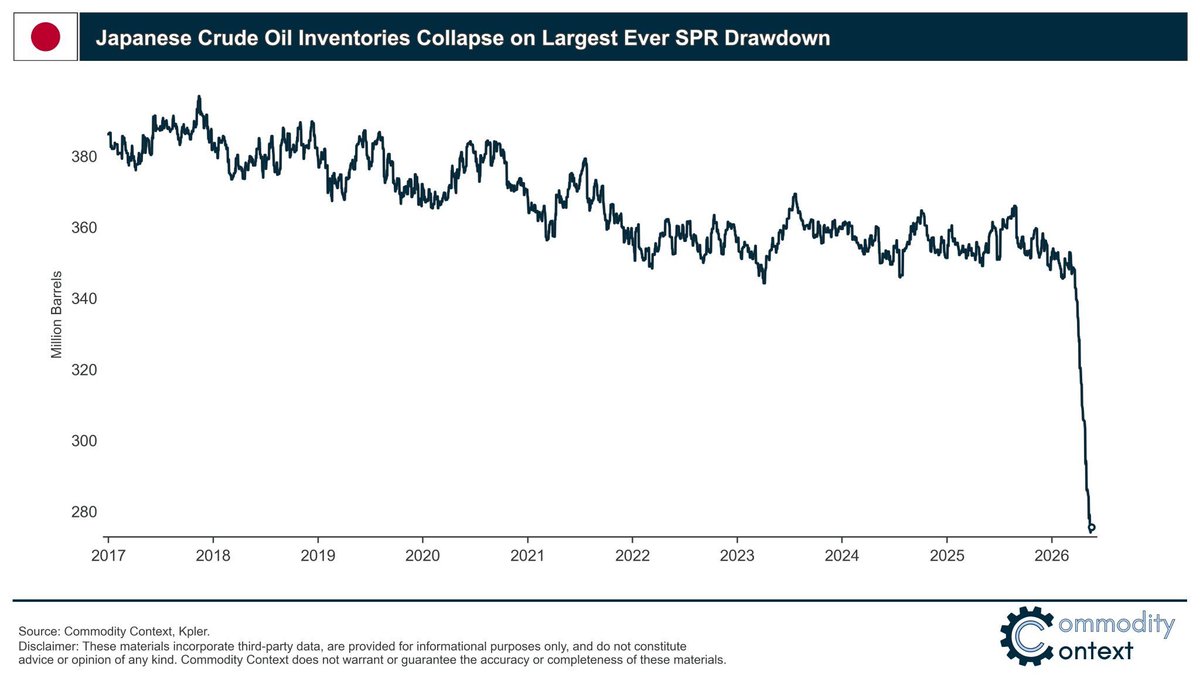
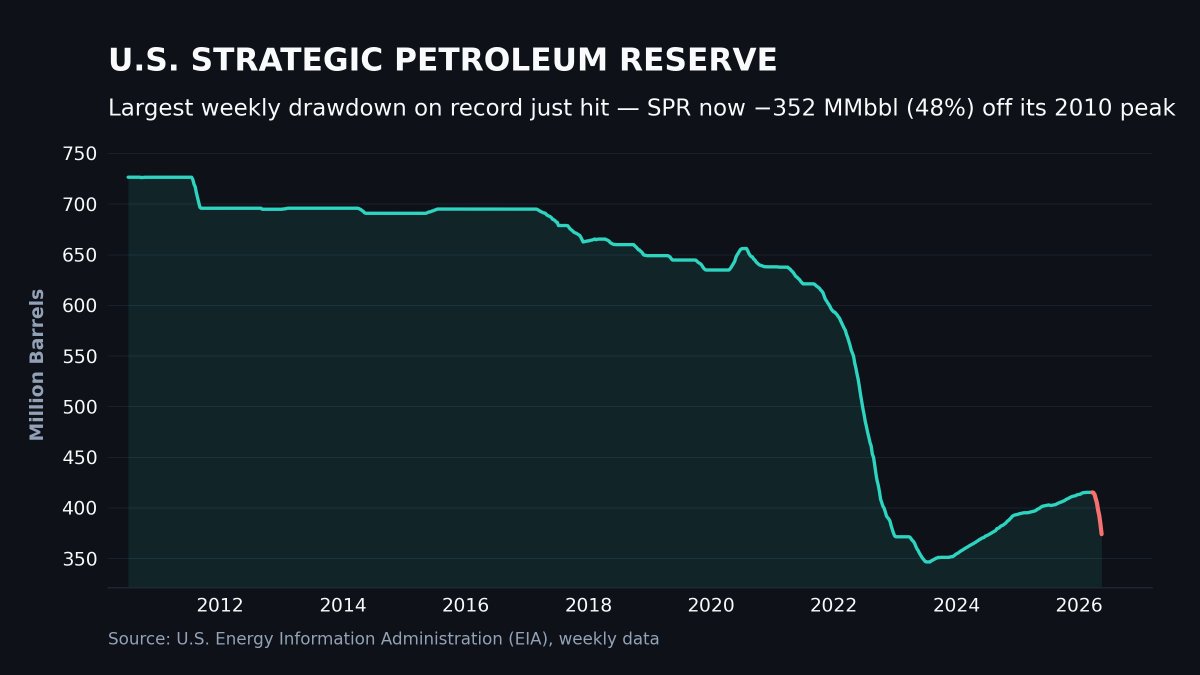
American SPR drawing at record speed with last week being the largest weekly draw ever drained past 20 months worth of builds in just 7 weeks!
Lower SPR inventory while keeping near-term crude pricing relatively in-check = double positive towards a structural bull market! 🛢️💰
2
13
48
3,077
CapitalCosm retweeted

May 19
Mining will create more millionaires than AI over the next decade. Yet everyone is chasing chips and software. Here's why the real money is in what powers all of it:
The world is obsessed with AI. Every portfolio, every headline, every allocation decision points in the same direction.
But here's what most investors are missing.
AI runs on infrastructure. Infrastructure runs on metals. Copper, nickel, palladium, platinum. The physical materials that make electrification, data centres, and energy grids possible.
Supply is constrained. From discovery to production, the average mine takes around 18 years. And demand is growing faster than at any point in the last 30 years.
This is the setup for a commodity supercycle. And historically, supercycles are where generational wealth gets built in the resource sector.
Power Metallic sits at the centre of this thesis. A zoned polymetallic system with copper, nickel, and PGEs. Only a handful of comparable systems exist on the planet. Well funded with C$50 million raised and 100,000 metres of drilling through 2026.
While everyone fights over the next AI stock, the real asymmetric opportunity might be sitting underground in Quebec.
Full conversation: youtube.com/watch?v=m2mb7S1Y…
$PNPN $PNPNF
14
73
316
35,627
CapitalCosm retweeted

May 19
The MAGA CULTISTS at this point are the EQUIVALENT of the MASK WEARERS during Covid
17
15
144
5,669
CapitalCosm retweeted

May 20
Thanks to Donald Trump, we now have two Democratic parties. With the defeat of @RepThomasMassie for being a principled fiscal conservative, the Republican Party basically exists in name only. We have two big-government political parties, each offering its own brand of socialism.
950
2,597
17,331
283,956
CapitalCosm retweeted

May 19
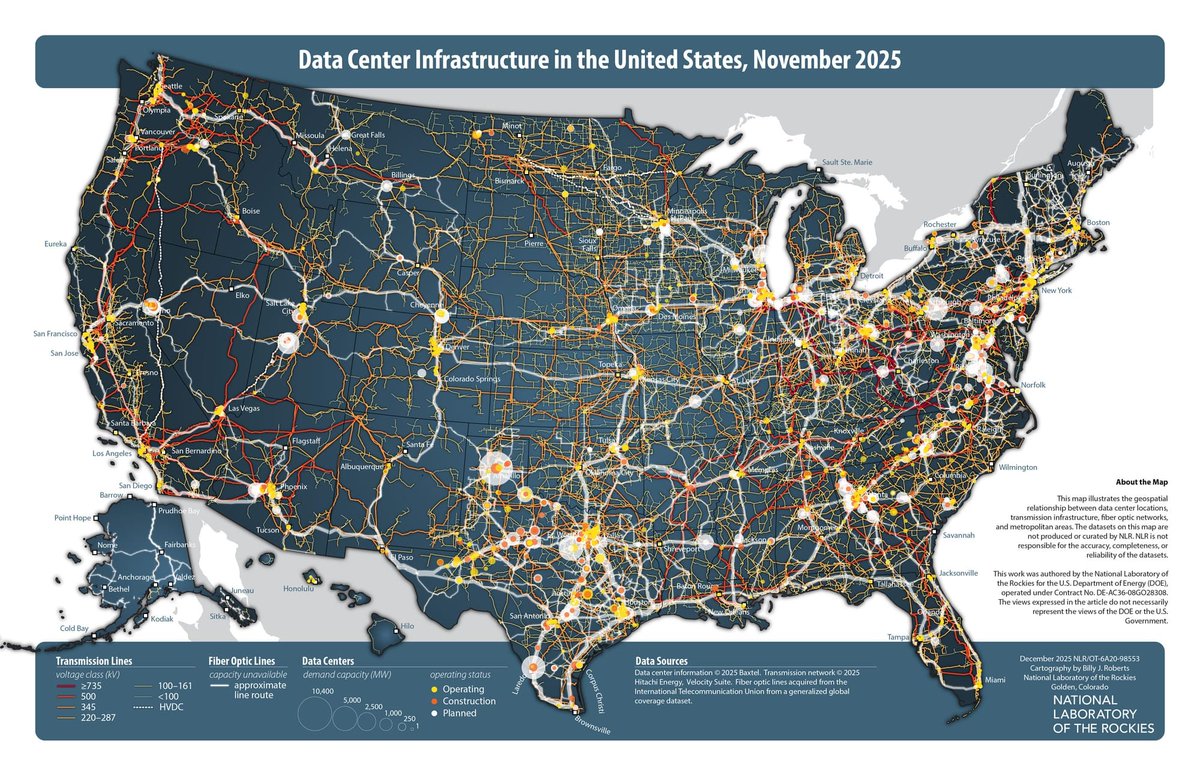
The US Department of Energy just mapped every data center in America.
This is what the AI power grid looks like.
The dots are data centers.
Yellow = operating.
Orange = under construction.
White = planned.
The lines are high-voltage transmission 735kV, 500kV, 345kV the arteries that move electrons from generators to compute loads.
Look at the density along the East Coast, Northern Virginia to the Carolinas.
Then look at Texas.
Then Northern California.
The largest circles on this map represent facilities demanding over 5,000 MW of power.
Single campuses pulling more electricity than mid-sized cities.
Northern Virginia is so dense the dots overlap.
Data centers cluster on transmission corridors.
Not because land is cheap because power is available.
When the line is full, the next data center goes somewhere else.
The grid is the bottleneck.
Every orange dot is a power purchase agreement being negotiated right now.
Every white dot is a utility commission filing, a gas plant approval, a pipeline capacity booking.
The $66.8 bn NextEra-Dominion deal, Meta's 10 new gas plants in Louisiana, the Alaska LNG FID push they all trace back to maps that look like this.
AI infrastructure is built in substations, on transmission corridors, and at the end of gas pipelines.
Link in the comments, to see my stocks 👇
348
2,732
4,445
331,693
May 19
🚨 On today's episode @SimonDixonTwitt exposes the REAL reason we're building over 5000 AI data centers in The US.
WATCH NOW: youtu.be/fccoLgW9BRw
1
2
3
459
CapitalCosm retweeted

May 19
Everybody talks about the Magnificent 7, but my focus is on the “Munificent 7”. Who are they?
They are oil companies and asset-heavy businesses generating real free cash flow yields in an AI sector that is trying to achieve breakout despite increasing constraints by energy, materials and physical scarcity.
Those oil company yields are 15.5%, whereas the AI hyperscalers are 0%. Read that back again.
The Munificent 7 are named that for a reason.
33
145
1,069
131,451
CapitalCosm retweeted

May 18
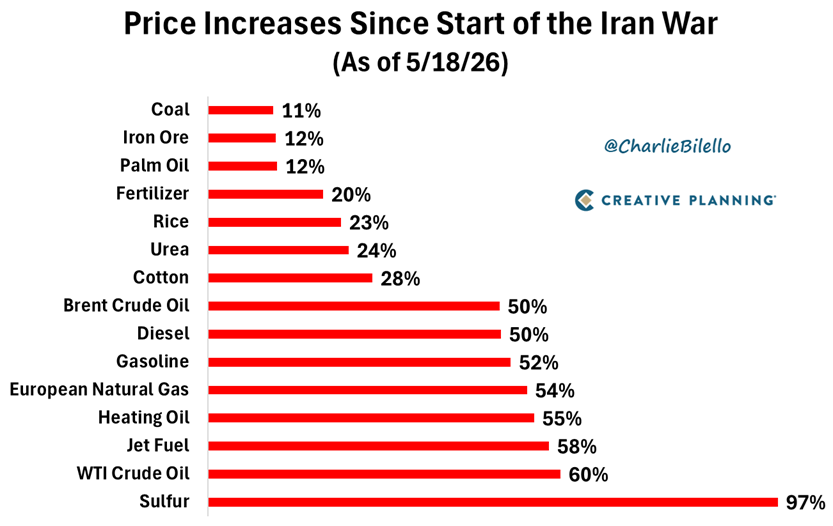
Price increases since start of the Iran war
Sulfur: 97%
WTI Crude Oil: 60%
Jet Fuel: 58%
Heating Oil: 55%
European Natural Gas: 54%
Gasoline: 52%
Diesel: 52%
Brent Crude Oil: 50%
Cotton: 28%
Urea: 24%
Rice: 23%
Fertilizer: 20%
Palm Oil: 12%
Iron Ore: 12%
Coal: 11%
55
385
909
298,314
May 19
👀


1
9
984