
Financial Analysis and Stock Screening Software for the American, European, and Canadian markets. 📈📊📉
Joined March 2010
- Tweets 1,083,591
- Following 589
- Followers 11,301
- Likes 31,301
781,924 Photos and videos


ChartMill retweeted

From one of my Minervini screens: Caterpillar $CAT . After closing above the 9- and 21-day EMAs again on Friday, the stock remains in a sideways trading range.
Three consecutive quarters of accelerating revenue growth and two consecutive quarters of accelerating EPS-growth (represented by the green horizontal line below the quarterly figures).
The manufacturer currently generates more revenue from the sale of heavy-duty power generators and emergency power systems for AI data centers than from traditional excavators.
In addition, the company is integrating smart AI technology into its own machines to automate the construction and mining sectors.
Disclaimer: I do NOT have a position in Caterpillar at the moment.

ALT CATERPILLAR
1
1
293

Jun 8
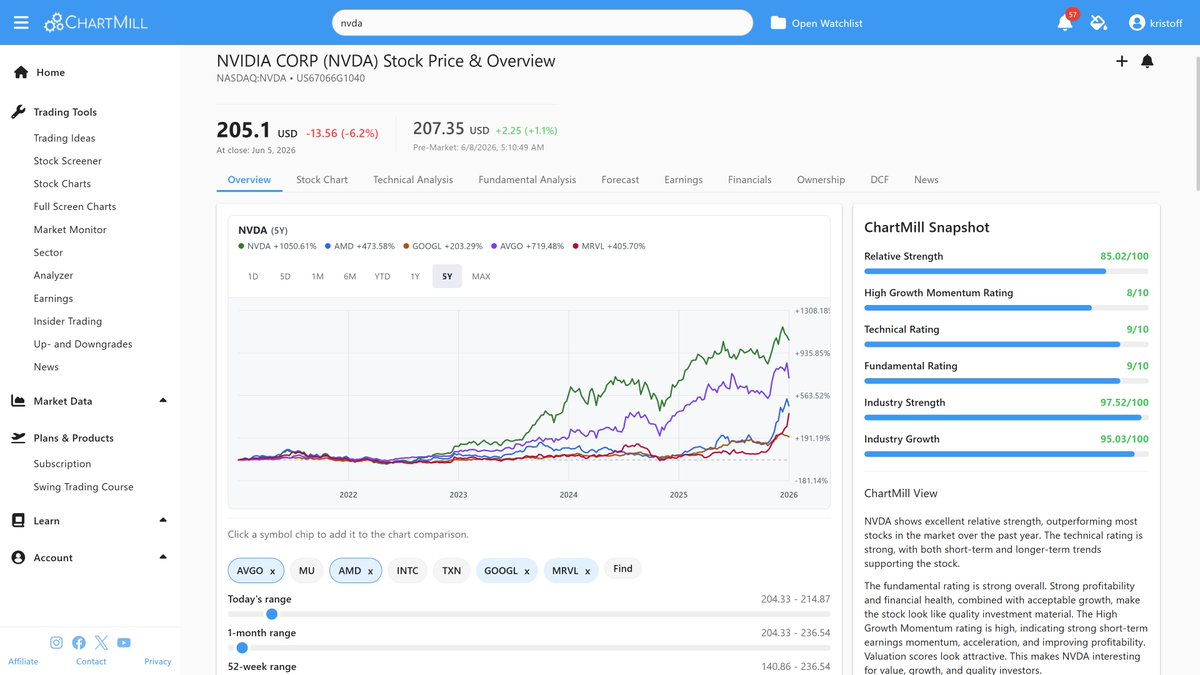
We've rolled out a new update. You can now easily compare multiple stocks directly within a single chart! 📈🔥
Check out the example below: In one single glance, you can see how tech giant Nvidia ($NVDA) stacks up against its main competitors (like $AMD, $GOOGL, $AVGO, and $MRVL) over a 5-year period. No more juggling multiple tabs, just instant visual correlation and performance tracking! 🔍
💡 What else is cool about this view?
On the right, you get the trusty ChartMill Snapshot at the exact same time. While comparing price action, you can instantly check key ratings (like NVDA’s massive 9/10 Technical and Fundamental scores!). Plus, adding or removing competitors is as simple as clicking the symbol chips right below the chart.
This makes sector analysis and relative strength benchmarking faster and cleaner than ever before. 🙌
Have you tried this new feature yet? Which stocks are you going to stack up first? Let me know below! 👇
#ChartMill #Investing #Trading #StockMarket #TechnicalAnalysis #FundamentalAnalysis #Nvidia #NVDA #StocksToWatch
@ransomevm
2
408
Jun 4
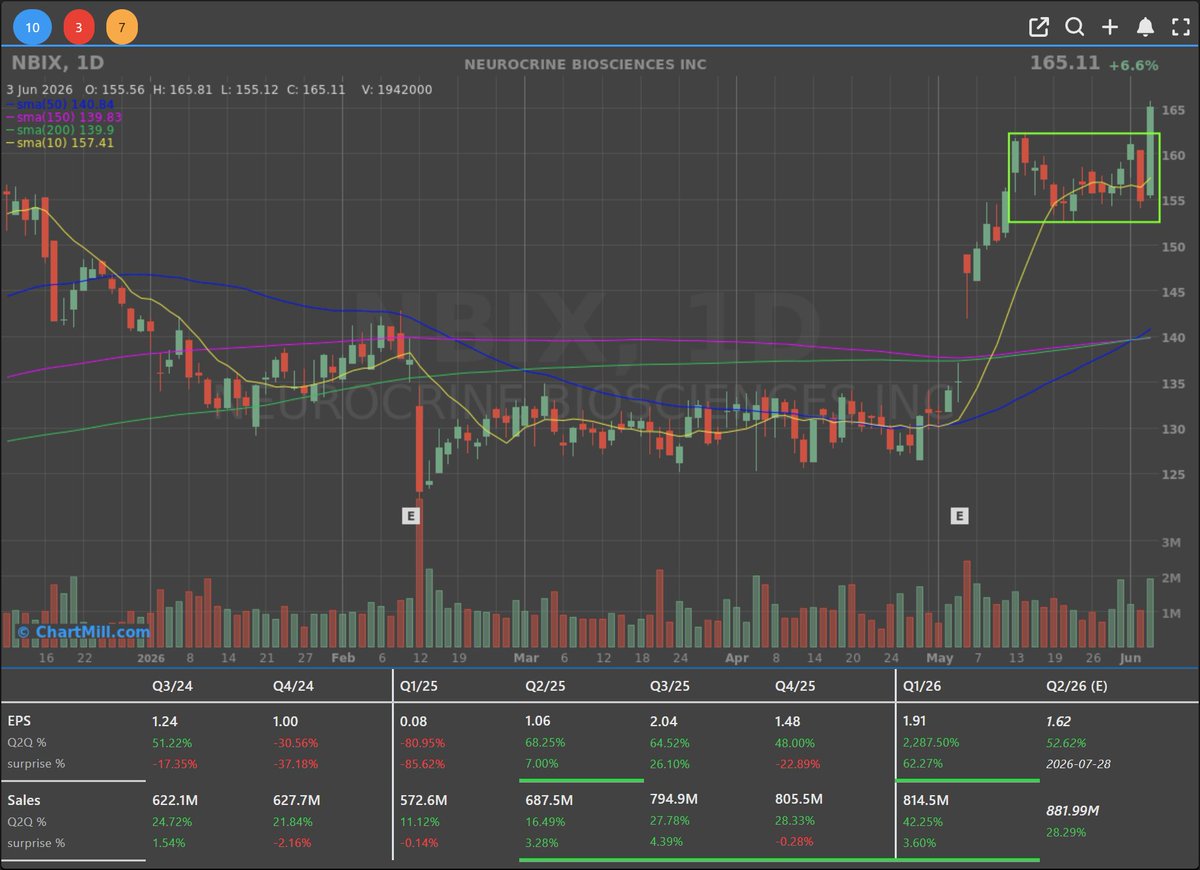
$NBIX - clean breakout on volume.

BREAKOUT CONFIRMED - NEUROCRINE BIOSCIENCES INC ( $NBIX )
Found via US Breakout Screen @ChartMill
- Sector: Health Care
- Sub-industry: Biotechnology
- P/E: 25
- Fwd P/E: 18
- PEG: 0.63
4 consecutive quarters of revenue acceleration and EPS acceleration in the most recent quarter.
I don't have a position in NBIX
2
339
Jun 4
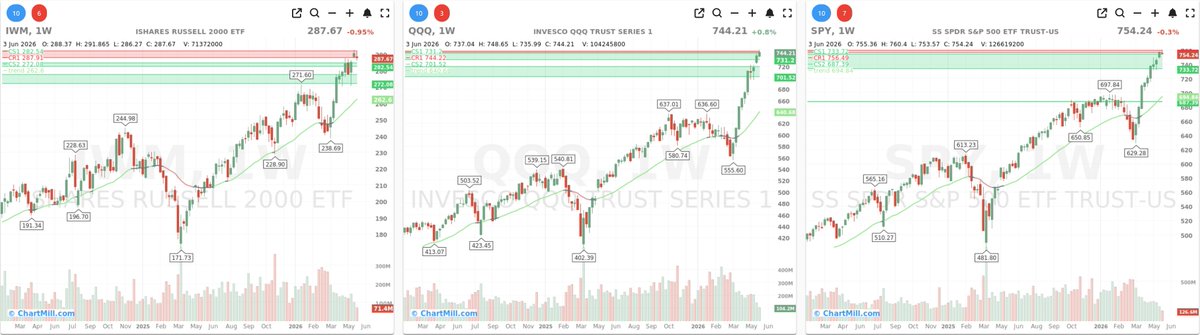
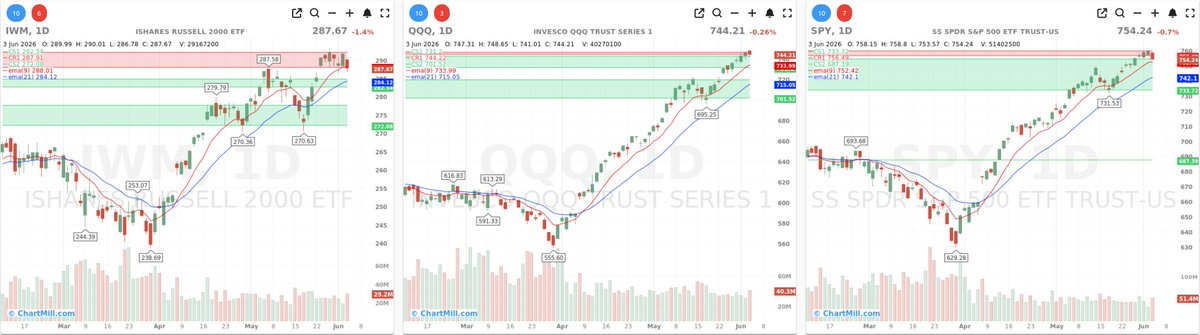
Market Breadth June 04 before market open
$SPY | ▼0.70% remains the cleanest broad-market chart. The weekly chart is still in a positive long-term trend, with price holding near recent highs and well above the rising 30-week trend line.
The daily chart shows a pullback from the highs, but price remains above the EMA9 and EMA21. This keeps the S&P 500 structure constructive, even though Wednesday’s breadth was clearly weaker.
$QQQ | ▼0.26% also remains technically strong. The weekly chart pushed into a fresh high area, and the daily chart is still above both short-term moving averages.
The ETF did fade slightly on the day, but this looks more like a pause after a sharp advance than a meaningful breakdown. The tech-heavy part of the market is still carrying much of the bullish structure.
$IWM | ▼1.37% failed again near overhead resistance and closed back below its EMA9 while still above the EMA21. The weekly chart shows price pressing into resistance rather than breaking cleanly through it.
This is a continuation of the same pattern from the previous session: large-cap and growth leadership remain intact, while small caps are not confirming with equal strength.
The latest market report pointed to hotter ADP private payrolls, stronger ISM services data, a firmer dollar, higher oil prices, and renewed Iran-related tensions as pressure points during Wednesday’s session.
242
Jun 3
"SpaceX: the final frontier... to boldly go where no investor has gone before." 🤪
$SPCX
finance.yahoo.com/markets/st…
191
Jun 3
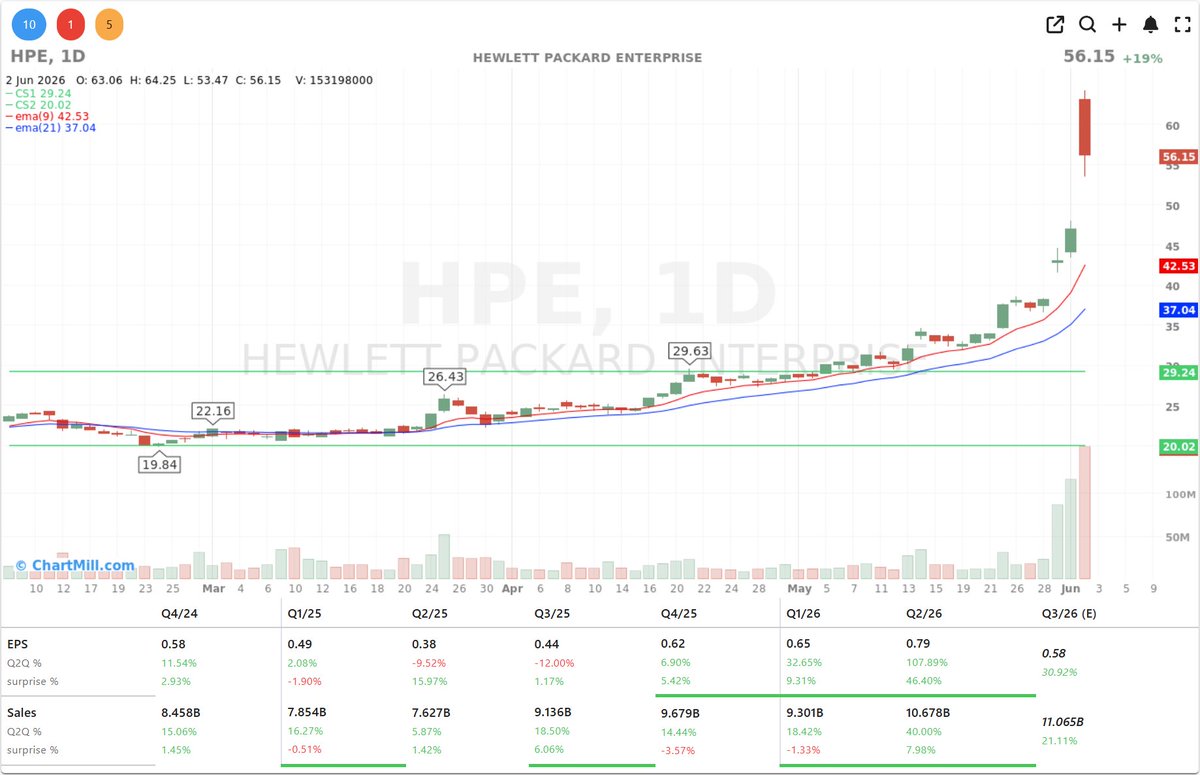
HEWLETT PACKARD ENTERPRISE ( $HPE | ▲19.47%) closed up nearly 20% in regular trade, digesting Monday's blowout after-hours print.
- The 40% revenue surge,
- the raised full-year EPS guide to $3.35–$3.45 from a $2.30–$2.50 starting range,
- and free cash flow tracking above $3.5 billion,
AI server demand is no longer a $DELL or $NVDA exclusive. Enterprise IT vendors are getting the pull.
ALT HEWLETT PACKARD ENTERPRISE
228
Jun 3
After the close, PALO ALTO NETWORKS INC ( $PANW | ▼1.10%) printed the quarter the cybersecurity bulls wanted.
- adjusted EPS of $0.80 against $0.79 expected,
- revenue of $3 billion, up 31% year over year, against a $2.94 billion consensus,
- acquisitions contributed $388 million to that growth, not insignificant, but the organic growth still clears comfortably,
- remaining performance obligations - basically future contracted revenue - grew 36% to $18.4 billion, ahead of the $17.9 billion the Street was looking for.
RPO growth running ahead of revenue growth means Palo Alto is contractually pulling forward demand it hasn't yet booked.
In cybersecurity, where the platform consolidation story has been the bull thesis for two years, an accelerating RPO line is the cleanest possible validation that customers are committing to longer, larger contracts.
ALT PALO ALTO NETWORKS INC
316
Jun 2
$NVDA The set-piece of yesterday was Jensen Huang on stage at Computex in Taipei. The bit that moved the tape wasn't the chip announcement (that's the next section). It was the message he delivered to software CEOs who've been getting beaten up all year on the "AI agents will eat the seat" thesis.
His framing, lightly paraphrased: people keep telling me software is in trouble because AI assistants will replace it. The opposite is true. A world full of digital agents is a world that consumes more software tools, not fewer. This is a fantastic time to run a software business.
ALT NVIDIA CORP
1
237
Jun 2
Coming from the CEO who has more credibility on AI roadmaps than anyone else on the planet, that sentence was enough. SALESFORCE INC ( $CRM | ▲9.68%), SERVICENOW INC ( $NOW | ▲9.24%) and ADOBE INC ( $ADBE | ▲5.72%) all caught a hard bid. This is now two straight sessions where the software de-rate has been actively challenged, Snowflake's quarter last week, Huang's blessing this week.
499
May 29
The ChartMill AI Screen Builder is a revolutionary shift in how you find trade ideas.
Whether you are looking for explosive growth or high-probability setups, you prompt the AI, and it handles the technical and fundamental structuring.
Full Video in first comment.
1
294
May 27
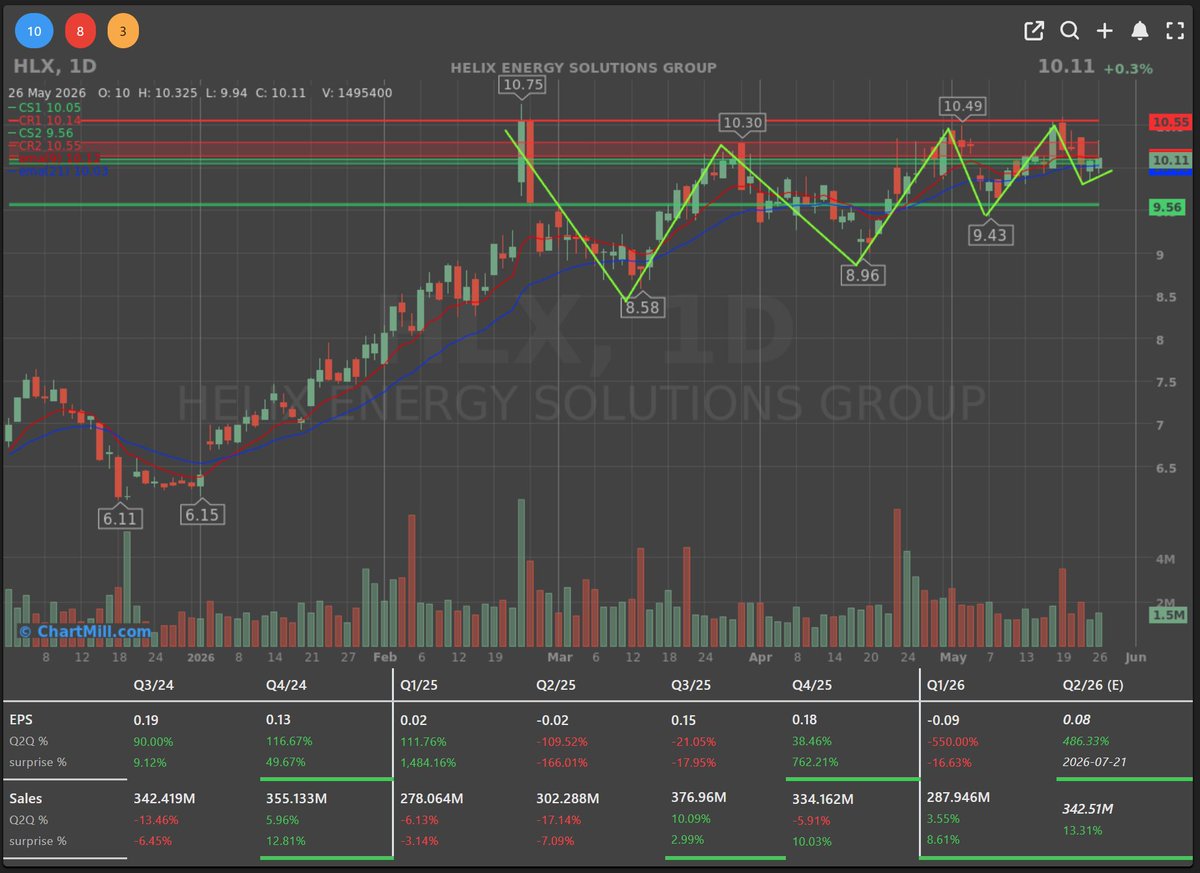
Volatility Contraction Pattern Spotted!
New article on Substack, released May 26:
$HLX (Helix Energy Solutions): Chart looks constructive. Fundamentals don't.
Full article: chartmill.substack.com/p/hlx…
Found via @ChartMill Minervini's Screen
ALT HELIX ENERGY SOLUTIONS GROUP
231
May 26
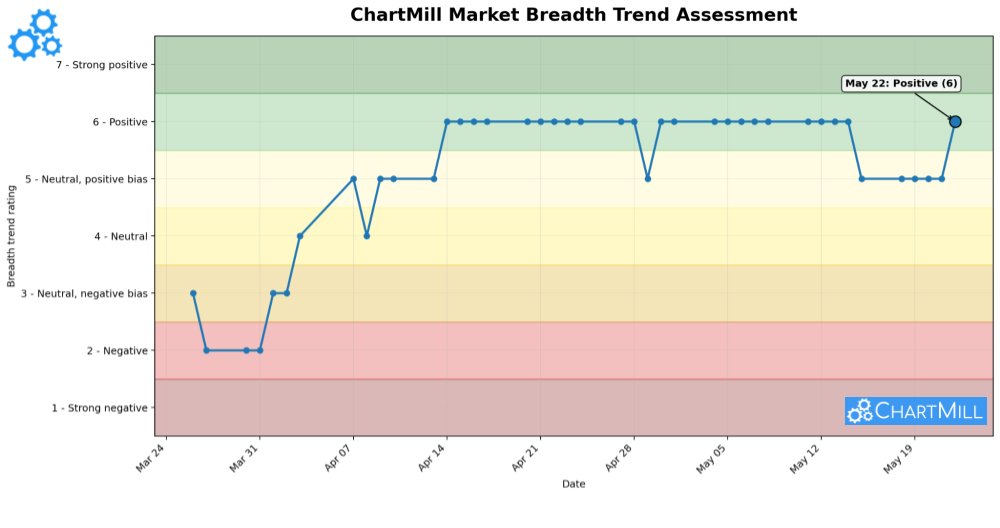
US Market Breadth from 'Neutral with Positive Bias' to 'Positive'.
Read the full market breadth update: chartmill.substack.com/p/sma…
ALT ChartMill Market Breadth Trend
1
1
221
May 22
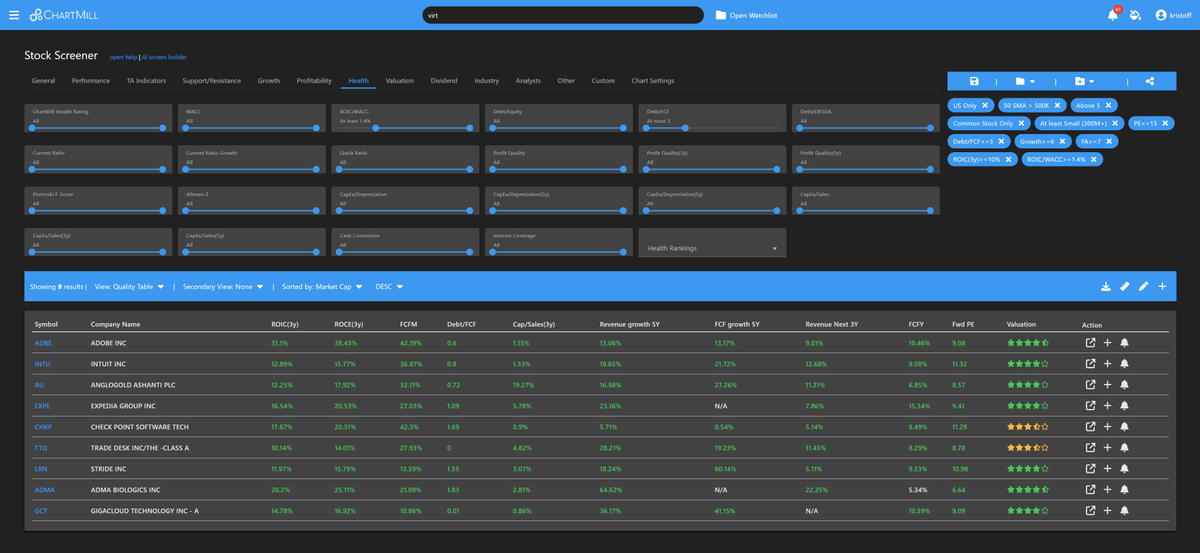
Stocks that may be of interest to the quality and/or value investor.
This list shows US stocks (at least small caps) with:
- ROIC 3Y at least 10%
- ROIC/WACC ratio at least 1.4
- debt/FCF ratio less than 3
- price-to-earnings ratio no more than 15
- solid ChartMill growth score (6/10)
- overall ChartMill fundamental score of at least 7/10
$ADBE, $INTU, $AU, $EXPE, $CHKP, $TTD, $ADMA, $ADMA
Not an investment recommendation!
ALT Watchlist quality/value stocks
1
207