
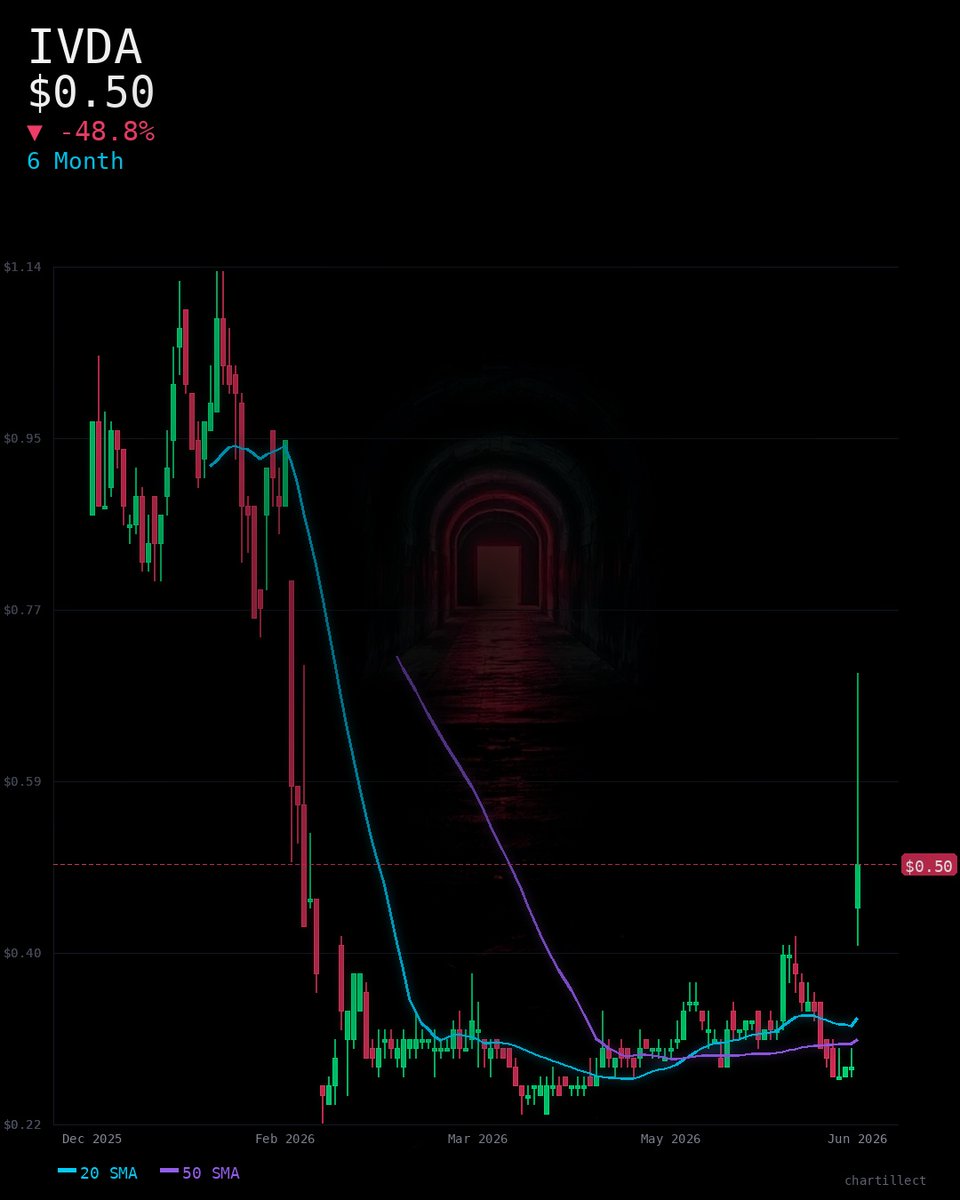
$IVDA just moved 77.3%. Here's what's driving it.
These stocks are gapping in today's session (ChartMill)
— Support: $0.27 · Resistance: $0.70
— Trading above 50-day SMA ($0.31)
— 81% off 52-week high of $2.58
Next test: $0.70. Break above and momentum traders pile in.
1
86
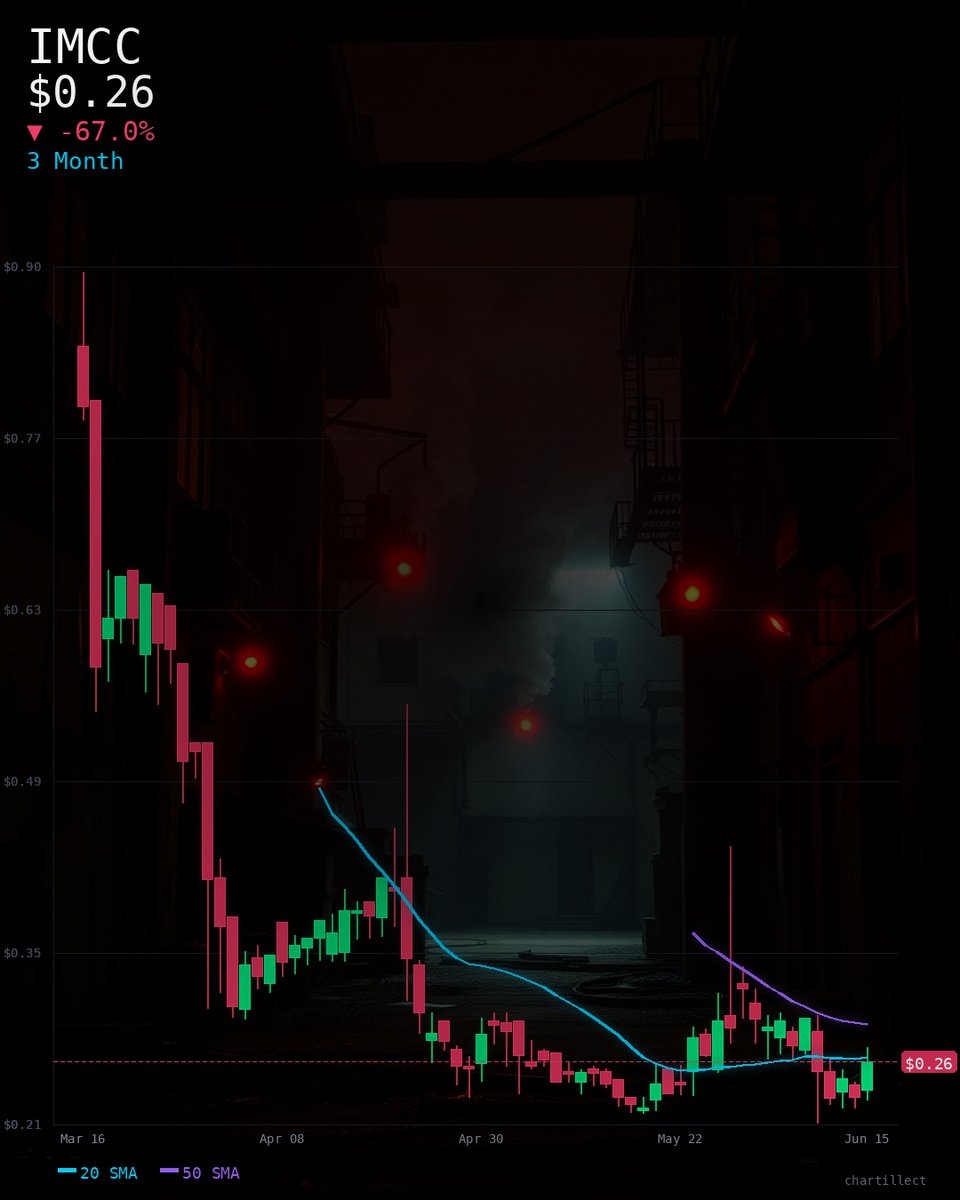
$IMCC is exploding 12.5%. Here's why.
These stocks are moving in today's after hours session (ChartMill)
— Support: $0.21 · Resistance: $0.44
— Trading below 50-day SMA ($0.29)
— 93% off 52-week high of $3.75
Next test: $0.44. Break above and momentum traders pile in.
93

REGN (NASDAQ:REGN) Presents a Classic Value Opportunity with Strong Fundamentals - ChartMill news.google.com/rss/articles…
4
Broadcom Inc (NASDAQ:AVGO) Stands Out as a GARP Stock with Affordable Growth and Strong Fundamentals - ChartMill news.google.com/rss/articles…
14
Capitol Federal Financial (NASDAQ:CFFN) Posts Perfect Minervini Trend Template Score - ChartMill news.google.com/rss/articles…
2
Trump Pulls The Trigger Back, Nasdaq Rips 2.5% And SpaceX Books The Biggest IPO Ever - ChartMill news.google.com/rss/articles…
16
Ascent Solar Technologies (NASDAQ:ASTI) Nears Perfection with 10/10 Technical Rating on Minervini Trend Template and High Growth Momentum - ChartMill news.google.com/rss/articles…
9
PTC THERAPEUTICS INC (NASDAQ:PTCT) Scores Perfect 10/10 For Technical Breakout Setup - ChartMill news.google.com/rss/articles…
5

Jun 12
Quantum Computing Stocks Show Deep Divergence as Technical Leaders Separate ... - ChartMill chartmill.com/news/QMCO/Char… #QuantumComputing
11
Workday Inc-Class A (NASDAQ:WDAY): A GARP Play with Strong Growth and Reasonable Valuation - ChartMill news.google.com/rss/articles…
5

Jun 11
31 Wall Street analysts provided a forecast for the next 12 months for $BROS. The average price target is 77.48 USD. This implies a price increase of 28.53% is expected in the next year compared to the current price of 60.28. ~ChartMill
1
589

Jun 10
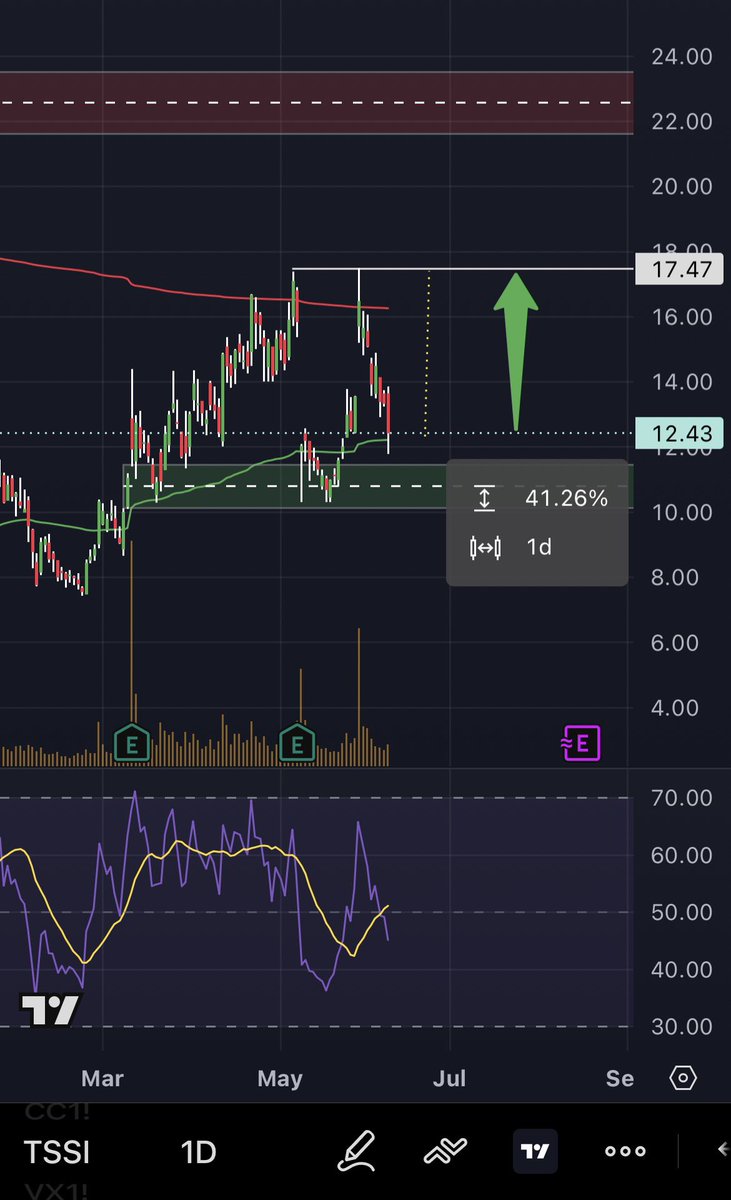
TSS, Inc. $TSSI
Data center construction/modular hardware (AI-rack integration)
Catalyst: AI-rack integration for largest customer $DELL . Yes you read that right, DELL!!!!
“Rising order volume from Dell Technologies (DELL) and durable demand for AI-optimized infrastructure”
The customer agreement was amended December 2025, effective Nov 1, 2025, extending the term two additional years.
New Georgetown, TX facility (up to 15MW); management guides doubling rack-integration volume in 2026; reiterated FY2026 guidance “Now Expects Adjusted EBITDA Toward High End of $20 to $22 Million Range” (non-GAAP).
Shares outstanding ~27.8M; float ~26.6M; short interest ~15.0% of float ( ~4.0M shares) / 16.33%
GAAP revenue: TTM $245.7M ; FY2025 $246M, up 66% YoY. Q1 2026 (8-K, May 7, 2026): “Total Revenue of $55.3 Million / Systems Integration Revenue Increased 88% Year-Over-Year”; total revenue down 44% YoY (procurement normalization), Systems Integration up 88% YoY to $14.1M, net income $2.3M, diluted EPS $0.08, adjusted EBITDA $5.3M (non-GAAP). Net income TTM $15.1M (profitable, GAAP); diluted EPS $0.56 TTM.
Dilution flags: no appreciable debt; $32.7M FY2025 capex (Georgetown); $17M capex underway for next-gen AI racks. No shelf/ATM/PIPE flagged. Minor RSU grants only.
~Analyst PTs: Needham Buy $16 (Mar 2026); Lucid Capital Buy $15; consensus ~$17 (9 analysts, ChartMill).
Source: Grok
Technicals look poised for a squeeze up
If so, it’ll be around a 40% move. Currently trapped between major VWAP.
Bottom is near
3
1,191

Comparing stocks in @ChartMill!
Jun 8

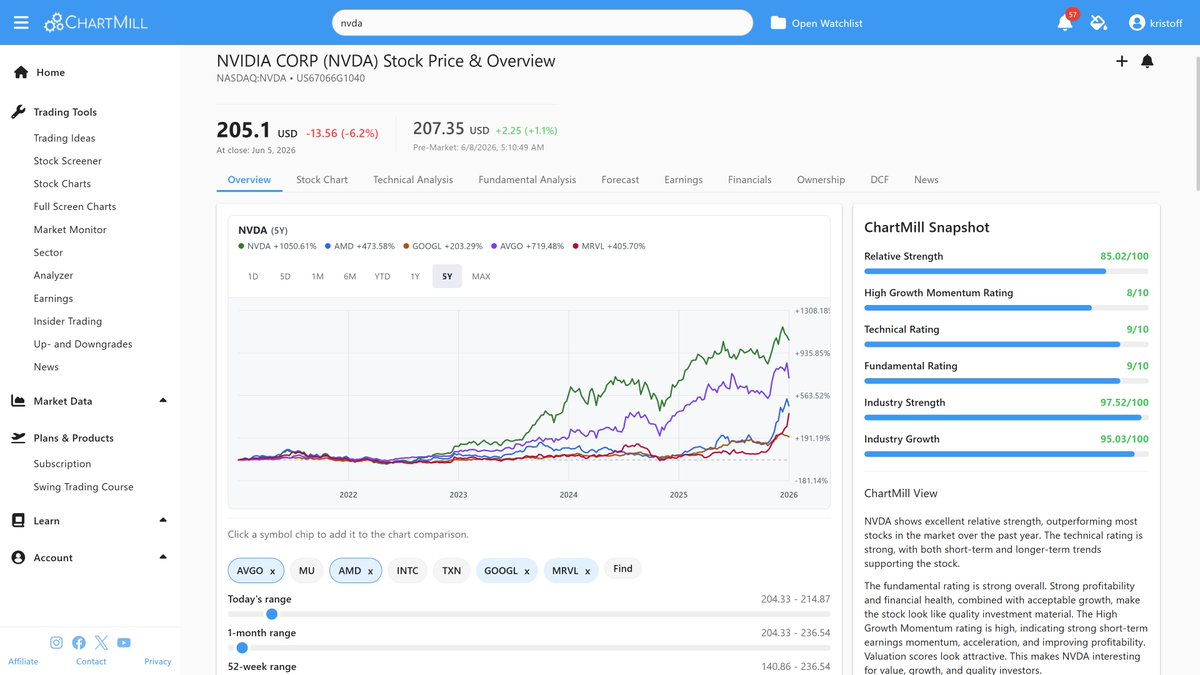
We've rolled out a new update. You can now easily compare multiple stocks directly within a single chart! 📈🔥
Check out the example below: In one single glance, you can see how tech giant Nvidia ($NVDA) stacks up against its main competitors (like $AMD, $GOOGL, $AVGO, and $MRVL) over a 5-year period. No more juggling multiple tabs, just instant visual correlation and performance tracking! 🔍
💡 What else is cool about this view?
On the right, you get the trusty ChartMill Snapshot at the exact same time. While comparing price action, you can instantly check key ratings (like NVDA’s massive 9/10 Technical and Fundamental scores!). Plus, adding or removing competitors is as simple as clicking the symbol chips right below the chart.
This makes sector analysis and relative strength benchmarking faster and cleaner than ever before. 🙌
Have you tried this new feature yet? Which stocks are you going to stack up first? Let me know below! 👇
#ChartMill #Investing #Trading #StockMarket #TechnicalAnalysis #FundamentalAnalysis #Nvidia #NVDA #StocksToWatch
@ransomevm
2
116

Jun 8
We've rolled out a new update. You can now easily compare multiple stocks directly within a single chart! 📈🔥
Check out the example below: In one single glance, you can see how tech giant Nvidia ($NVDA) stacks up against its main competitors (like $AMD, $GOOGL, $AVGO, and $MRVL) over a 5-year period. No more juggling multiple tabs, just instant visual correlation and performance tracking! 🔍
💡 What else is cool about this view?
On the right, you get the trusty ChartMill Snapshot at the exact same time. While comparing price action, you can instantly check key ratings (like NVDA’s massive 9/10 Technical and Fundamental scores!). Plus, adding or removing competitors is as simple as clicking the symbol chips right below the chart.
This makes sector analysis and relative strength benchmarking faster and cleaner than ever before. 🙌
Have you tried this new feature yet? Which stocks are you going to stack up first? Let me know below! 👇
#ChartMill #Investing #Trading #StockMarket #TechnicalAnalysis #FundamentalAnalysis #Nvidia #NVDA #StocksToWatch
@ransomevm
2
408


🚨 AI Hardware, Physical AI, And High-Torque Infrastructure 🚨
Bullish options trades on four names from our Market Watchers -:> Chartmill workflow.
blog.portfolioarmor.com/p/tr…
1
2
328


Yes!! 🙌 Good catch! I had Q4 2025 numbers in mind (where they did miss) and the ChartMill aggregator showed a -480% EPS surprise on Q1 that confused me.
The clean Q1 2026 numbers per the 10-Q:
✅ Revenue $4.18M continuing ops (up 280% YoY from $1.1M)
✅ EPS -$0.06 (improved from -$0.12 YoY)
✅ Both BEAT Street estimates per Stocktwits reporting
The thesis is intact -> multi-vertical isotope picks-and-shovels, Fermi America 11 GW MOU, European reactor MOU, 9-analyst PT $13.26. Long $ASPI 🔥
3
40
🌱 $BYND primed for a move — Benzinga and ChartMill both flashing targets near $7. If sentiment shifts, this could rip. 🔥🚀
4
335