
Joined October 2011
- Tweets 401
- Following 474
- Followers 1,099
- Likes 972
35 Photos and videos


5 Apr 2023
1
7
973
3 Apr 2023
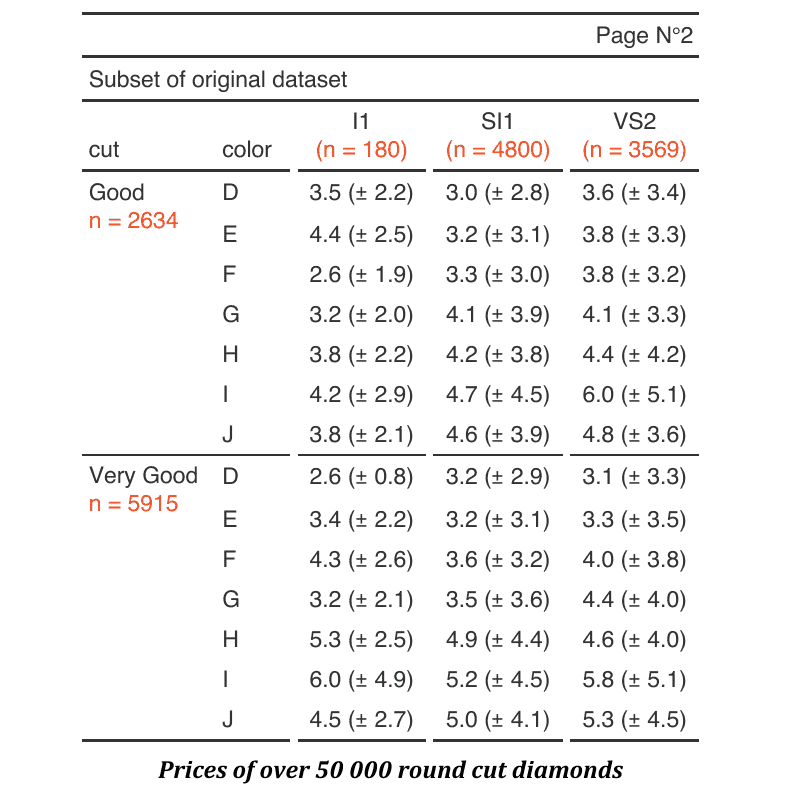
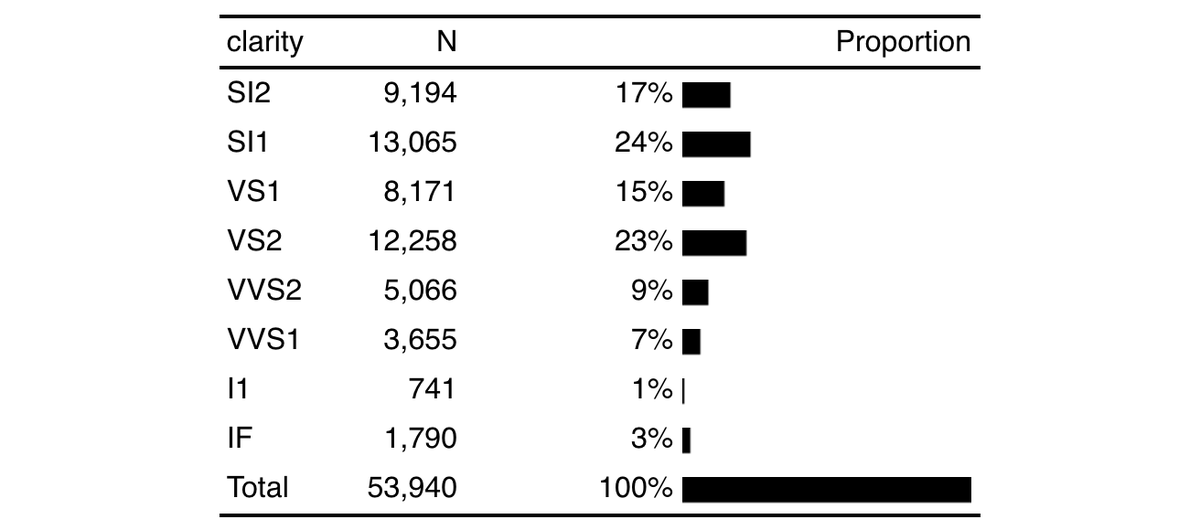
First post about #rstats flextable and 'grid Graphics': ardata.fr/en/post/2023/04/03…… proudly made by @lostgps and myself
2
9
19
4,833
15 Nov 2022
Does anyone know what is happening with the #rstats CRAN updates? It seems that since Saturday, all packages that are submitted for an update are stuck in the 'pretest' folder.
1
2
12 Sep 2022
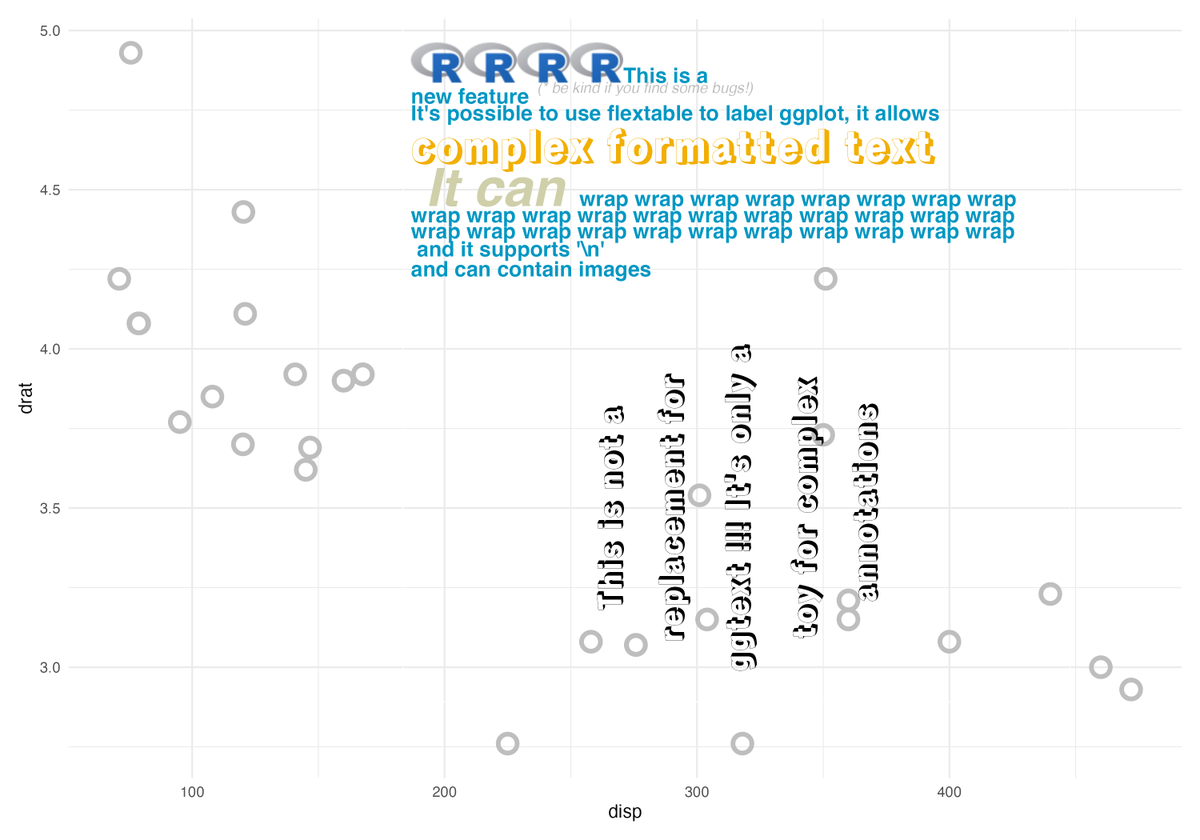
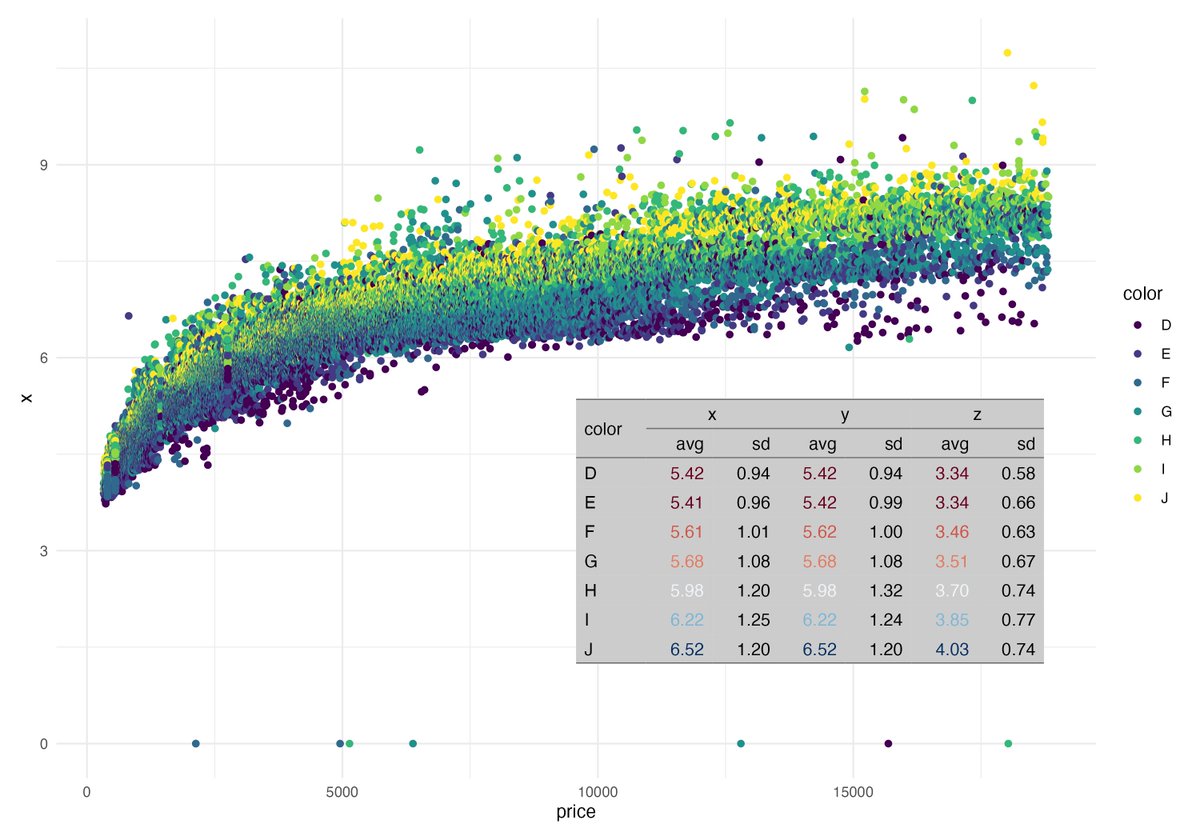
#rstats funny side effect of having a 'grid graphics' output with #flextable - it can be used to add complex labels on #ggplot with 'patchwork' (code: gist.github.com/davidgohel/6…, you may have to change the fonts if not avail. on your machine)
3
7
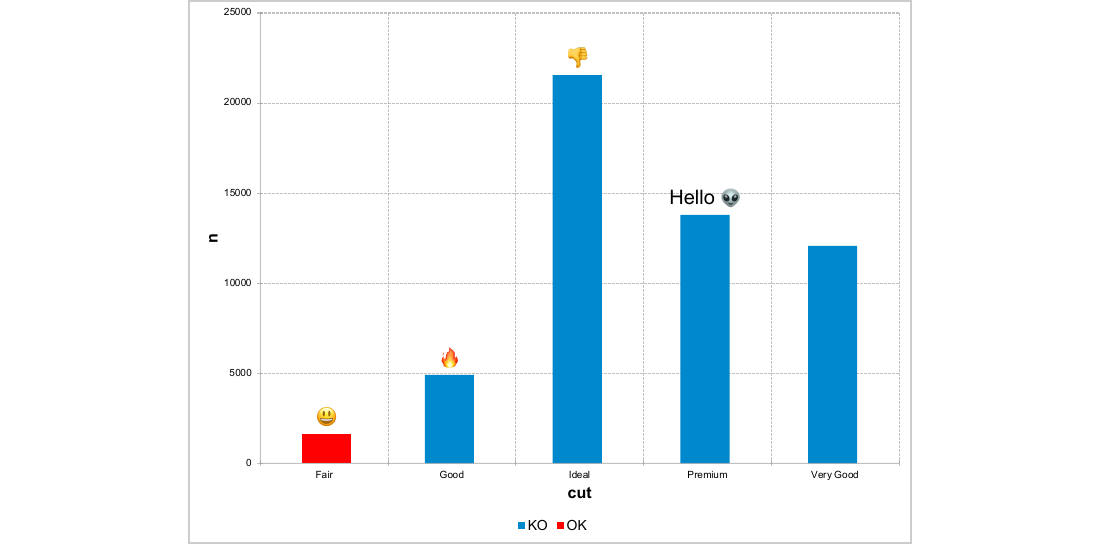
9 Sep 2022
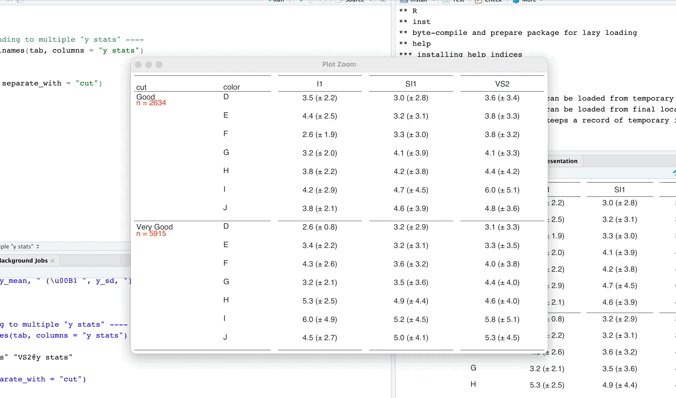
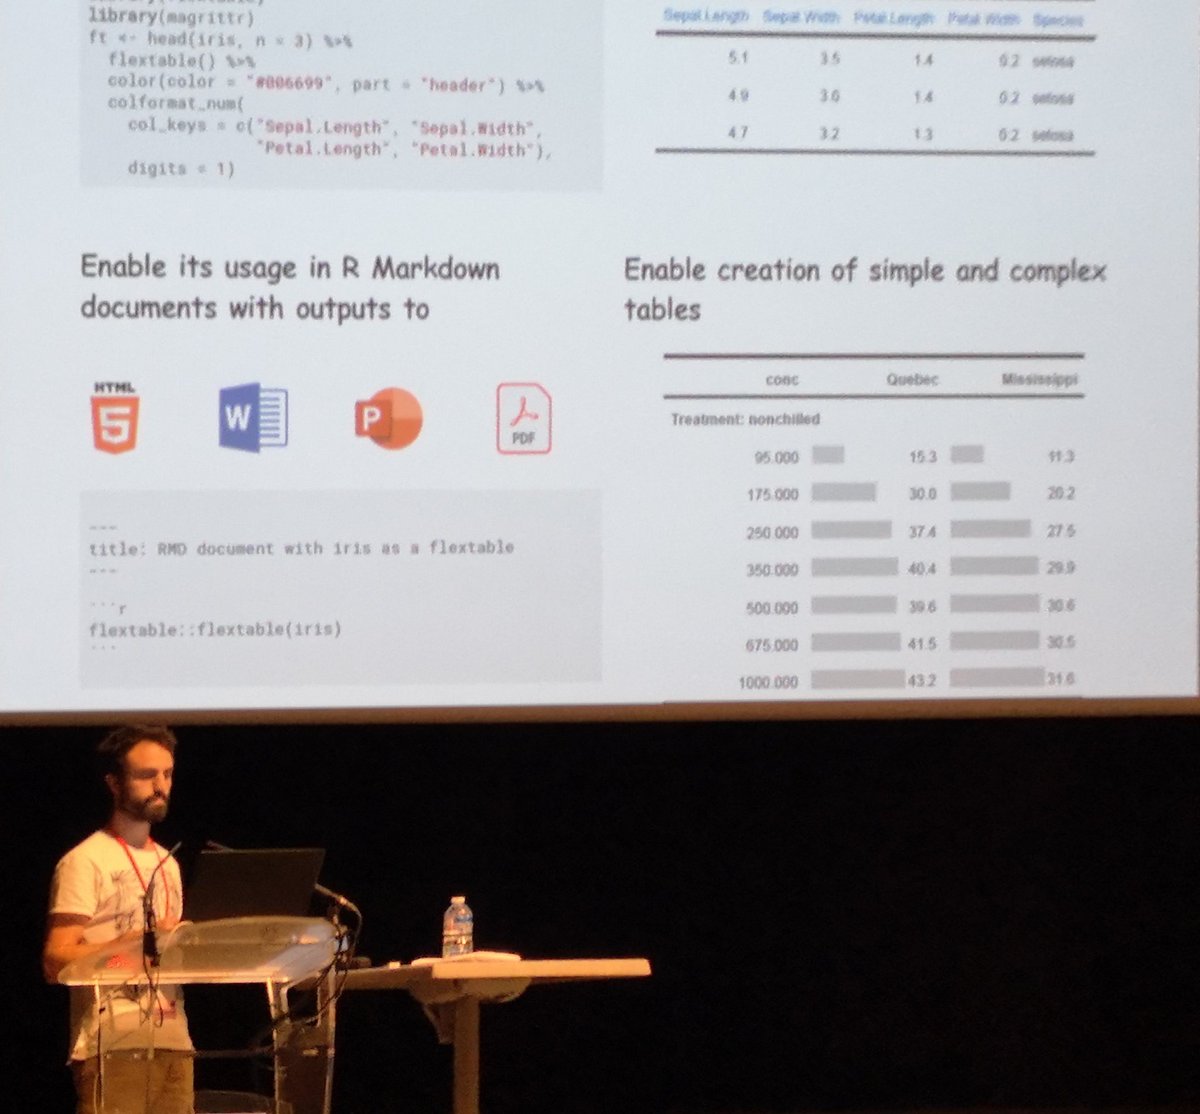
It's Friday. Let's show off a new feature of #rstats flextable @lostgps and I developed. We have now a "grid graphic" output🥳, it works very well with ggplot2, cowplot and patchwork (only on GitHub for now).
Code available here: gist.github.com/davidgohel/e…
4
20
159
9 Sep 2022
It can be resized, it adjusts to its container, text wrap, columns auto-adjustment, and many other options...
8
David Gohel retweeted

6 Sep 2022
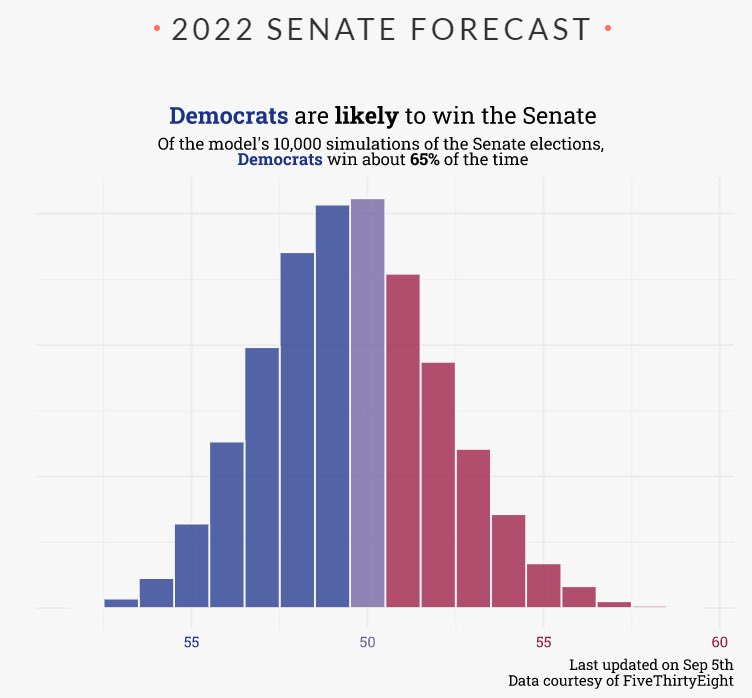
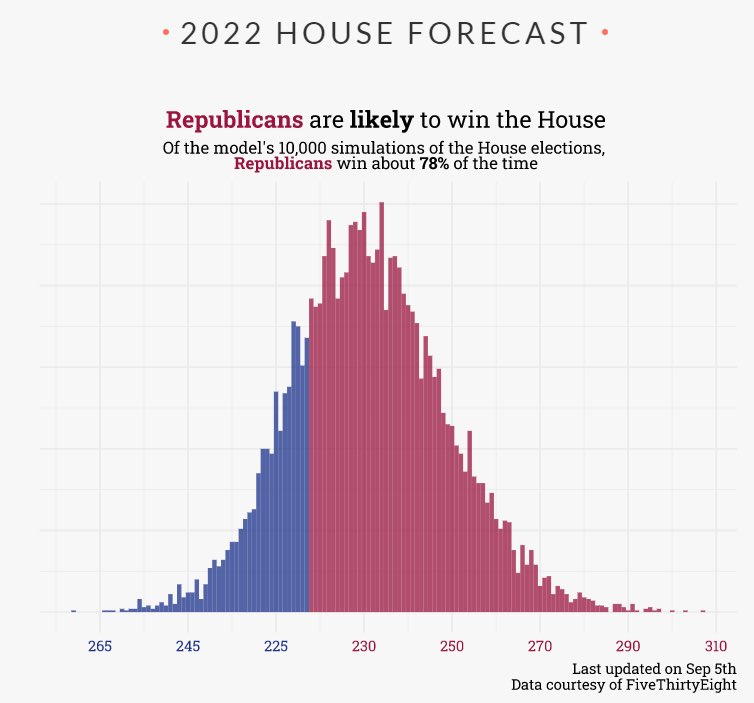
🚨big project launch🚨
today I’m launching my 2022 midterms forecast! As of today, Democrats are favored to keep the senate and Republicans are favored to flip the house - more deets below but you can find the full forecasts here:
thedatadiary.net/senate/
thedatadiary.net/house/
12
18
129
5 Jul 2022
New #rstats example in the #flextable gallery that shows how to create shift tables and add them into a Word document with #officer: ardata.fr/en/flextable-galle…
3
16
53
David Gohel retweeted

29 Jun 2022
Brighten your #rstats day with ep 84 of @rweekly_org Highlights! share.fireside.fm/episode/87…
💪 {flextable} 0.7.2 @davidgohel @ardata_
🏰 Offload #shiny's workload @haematobot @jumping_uk
🌈 RainbowR rises again @R_LGBTQ @ellamkaye @StarTrek_Lt
h/t @mike_ketchbrook @joncalder 🙏
2
10
23
David Gohel retweeted

23 Sep 2021
GxP Compliance in Pharma Made Easier: Good Documentation Practices with R Markdown and {officedown} ift.tt/3nYzFVS
2
3

Few years ago, when I started making basketball charts with #rstats and #ggplot2, I looked for interactivity options and I fell in love with #ggiraph.
Now, I'm proud collaborator and with @DavidGohel we are looking forward to add more features.
New release is coming🥳
2
4
30
David Gohel retweeted

5 May 2021
I practiced interactive viz. with last week's #tidytuesday data using #ggiraph just to check if it's as cool as it looks.
It turns out it's even cooler
#ggplot #dataviz
2
2
40
David Gohel retweeted

27 Apr 2021
Officeverse: a free book on using R #rstats to create reports, charts and tables in Word documents and PowerPoint presentations, by @DavidGohel ardata-fr.github.io/officeve…
30
88
David Gohel retweeted

21 Apr 2021
New release of our {esquisse}📦on CRAN 🎉 Interactively create plots with #ggplot2, lot of new features, thanks to user feedback. Try it! Repo: github.com/dreamRs/esquisse #RStats
7
58
310
19 Apr 2021
#rstats 📦 mschart is back in service, fixed areachart, added custom labels and heavy revamp of the documentation. ardata-fr.github.io/officeve…
1
6
15
David Gohel retweeted

14 Apr 2021
#rstats {pagedown} 0.14 is on CRAN!
Please, read carefully the changelog cran.r-project.org/web/packa…
Many bugs were fixed thanks to the amazing work of the @paged_js team!
10 Apr 2021

When I realize that despites my efforts the next release of {pagedown} will break many custom #rstats users' templates...
2
6
13
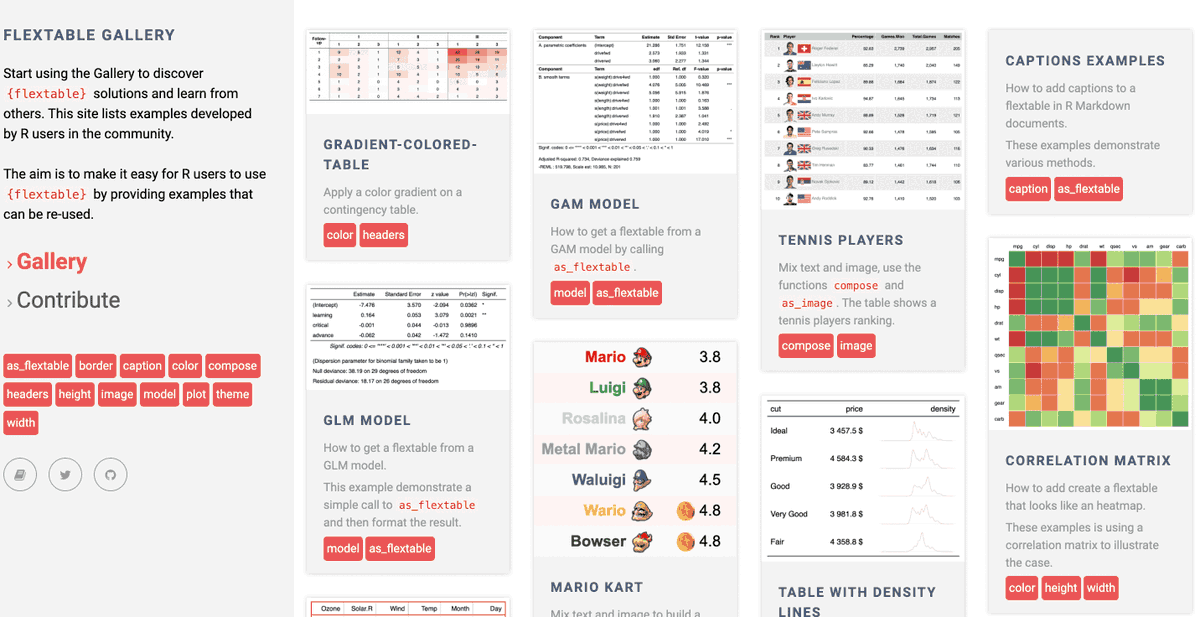
30 Mar 2021
We made a gallery for {flextable} examples. ardata-fr.github.io/flextabl… Contributions are welcome :) #rstats
7
100
469

Would you like to know how to use the officer package to facilitate the production of Word documents and PowerPoint presentations with R?
The answer is on our meetup this Thursday at 7pm UTC with @DavidGohel.
We will wait for you there, #rstats!
buff.ly/3qwIQKF

6
4