
Joined February 2012
- Tweets 144
- Following 80
- Followers 41
- Likes 18
27 Photos and videos


Pinned Tweet

7 Mar 2019
We spend a lot of time in R&D, but we are more!
We have updated our logo to reflect how our products, like @visu_ai, are designed to help humans do their job better, through suggestions and explanations. The new logo suggests a brain and a text bubble.
#analytics #datascience

1
1
1
21 Sep 2022
If you want to try ClassGraphic in a jupyter notebook, you can check it out through mybinder at the below link. This is a multiclass classification demo
#jupyternotebooks #python #datascience #plotly #classification #classgraphic #infoviz #dataviz
mybinder.org/v2/gh/dionresea…
2
1
19 Sep 2022
15 Sep 2022

The following data science plots are all static images, since that is all LinkedIn allows. But all these are web based interactive charts based on #plotly for #python. They can be used in #jupyternotebook, #pyqt, #pyside, #flask, #django or plain python s…lnkd.in/et66p8gZ
19 Sep 2022
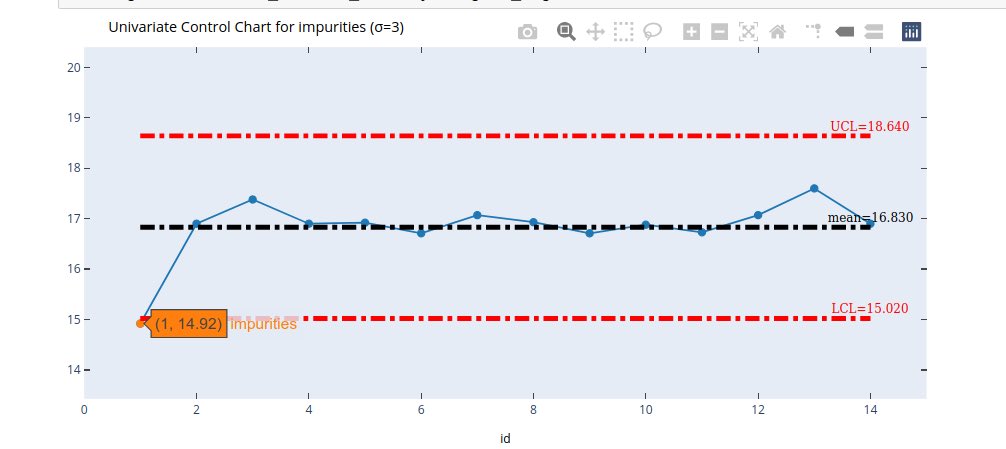
We just published the first public release (v0.2.0) of #classgraphic for #interactive #datascience #classification #diagnostic #metrics and #visualization
#dataviz #infoviz #ML #MachineLearning #Analytics #python #pandas #sklearn #plotly
github.com/dionresearch/clas…
1
5
1
19 Sep 2022
The documentation for #ClassGraphic (#python module), the #interactive #datascience #classification #diagnostic #metrics and #visualizations is at:
dionresearch.github.io/class…
1
1
Dion Research LLC retweeted

9 May 2022
When people first encounter @dataclass or NamedTuple in #Python, it is common for people to believe that the type annotations will generate type checks or type coercions.
@ dataclass
class Person:
name: str
age: int
Person('Alice', '30')
1/
6
17
106
Dion Research LLC retweeted

25 Oct 2021
Made some progress on the bit crusher pedal prototype. I have the control knobs for the sample rate & the bit depth. Also have the overdrive stage. I am far from done, haven't added LED, bypass, & quite a few more things. It's already pretty effective on my Sequential drumtraks
2
1
Dion Research LLC retweeted
21 Jul 2021
So how can you test this feature? Install Hotelling and dask and then in your #python script or notebook:
from hotelling.helpers import load_df
From hotelling.stats import hotelling_t2
x = load_df("pop_a_*.csv",dask=True)
Load y similarly then you can call:
hotelling_t2(x,y)
2
2
Dion Research LLC retweeted
21 Jul 2021
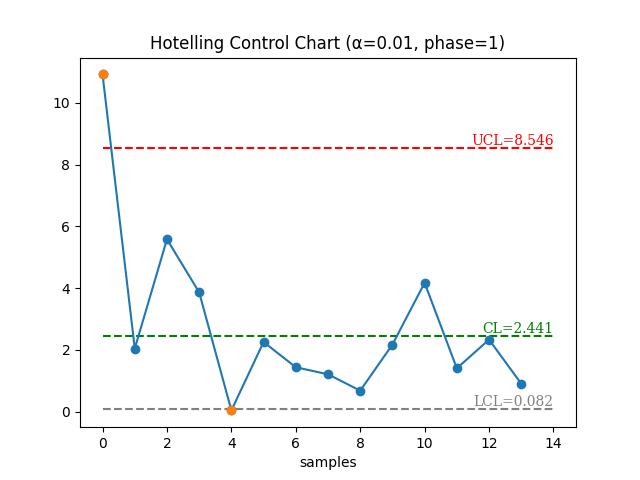
My (@DionResearchLLC ) Hotelling #python package v0.5.0 now available! It's been beta tested for > month by companies to monitor #manufacturing #quality & large scale #financial #audits in another. Now supports very large datasets.
#stats #anomaly #pandas
pypi.org/project/hotelling
1
2
3
28 Mar 2021
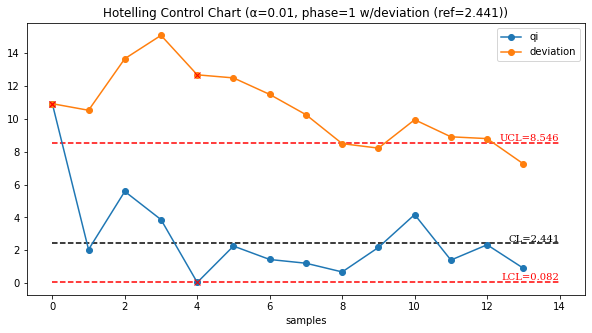
Hotelling v0.4.3 has just been released on pypi, now with plotly templates support and deviation charts (cusum)
pypi.org/project/hotelling/
#runcharts #controlcharts #dataviz #infoviz #stats #t2 #tsquared #multivariate #matplotlib #plotly #Hotelling #deviation #qa #quality
1
28 Mar 2021
Along with documentation, including example notebooks at:
dionresearch.github.io/hotel…
These notebook examples even cover the brand new deviation feature (cumulative sum chart).
#datascience #dataquality #dataviz #controlcharts
21 Mar 2021
While at it, not only did we update @stemgraphic documentation, but we've also pushed the latest documentation for Hotelling, the python package for T2 tests and uni/multivariate control (run) charts:
dionresearch.github.io/hotel…
#quality #datascience #eda #statistics
2
20 Mar 2021
And to go along @stemgraphic 0.9.1 on pypi.org, documentation has been updated at:
Https://dionresearch.github.…
20 Mar 2021

stemgraphic v0.9.1 has been released on pypi. From stem-and-leaf plots to stem-and-leaf heatmap grids, now working with the most recent #pandas #cufflinks #plotly
#EDA #DataVisualization #dataexploration #stemandleaf pypi.org/project/stemgraphic…
Dion Research LLC retweeted
25 Feb 2021
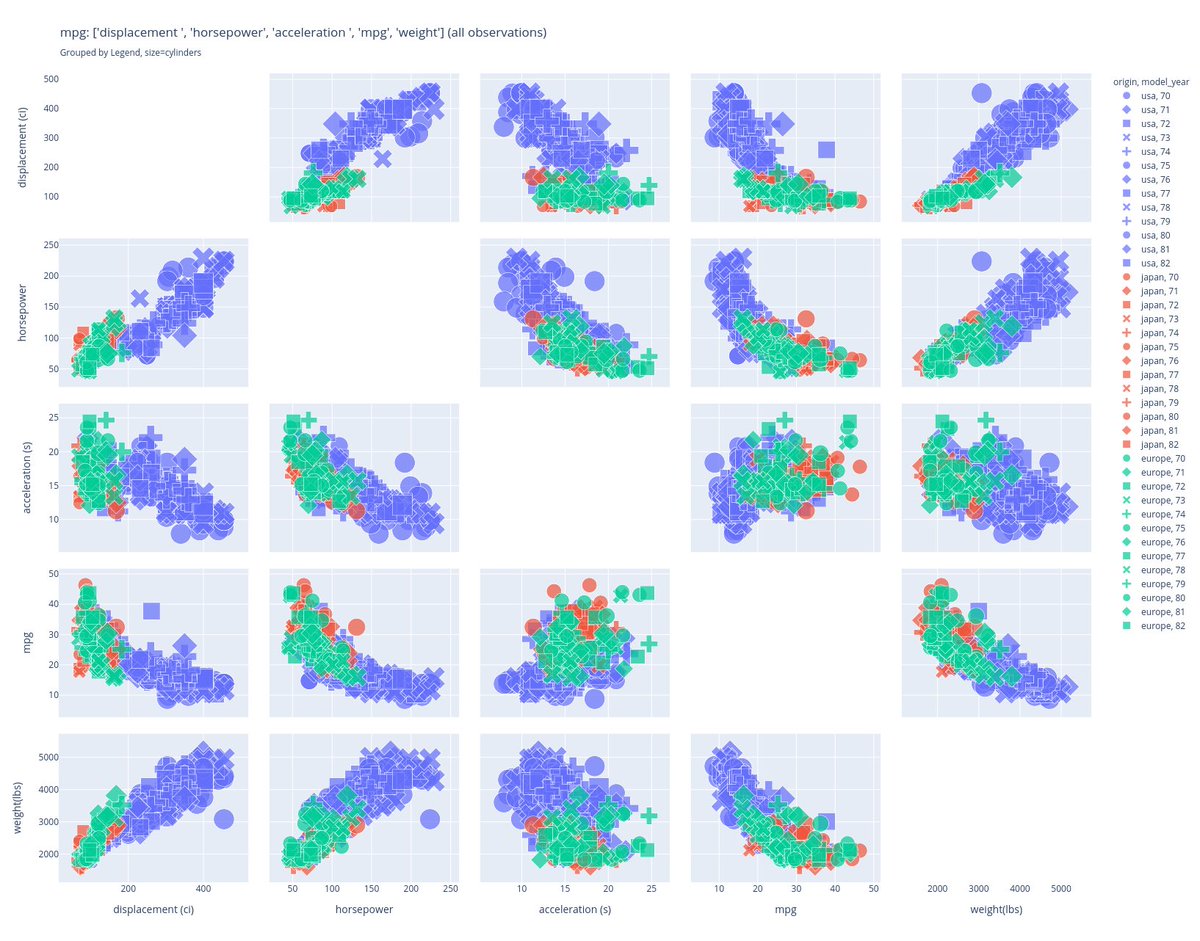
Another example of automated title on a fairly detailed plot, a scatter graph matrix. Title includes the dataframe name, the selected variables (without units, unlike the x and y axis), references the legend, the size that is not on the legend.
Good news? PR merged in #pandasGUi
1
1
2
Dion Research LLC retweeted

17 Feb 2021
📢 Plotly.js v2.0 is coming soon, after 5 years and 177 releases since v1.0! 🎉Check out the pre-release announcement to find out what's changing and how you can kick the tires on the Release Candidate 🚀 community.plotly.com/t/plotl…
1
9
29
5 Oct 2020
5 Oct 2020
Excel works, until it doesn't. With scheduled checks, @visu_ai (visu.ai) would have caught this issue (spelled out, in this case), and many more. Data quality matters. Get in touch to learn more.
#datamanagement #d…lnkd.in/dTQ882H lnkd.in/dHTSgTf
1
1
Dion Research LLC retweeted
11 Sep 2020
"Seeking Exotics"
#anomalydetection #outliers #inliers #ml #datascience
github.com/fdion/seeking_exo…
1
Dion Research LLC retweeted
27 Jul 2020
If you've started using Python 3.8:
- did you know about the walrus operator? ( := aka assignment expressions or pep 572)
- how often do you use it?
- what do you think of it?
I'm actually growing fond of it, after doubting it in…lnkd.in/gNWcRqD lnkd.in/gMrxhBw
1
1
Dion Research LLC retweeted
9 Aug 2020
50 years ago, John Tukey introduced Exploratory Data Analysis. Imagine walking into his classroom in 1970 to witness history in the making: beyond his philosophy of EDA, he introduced several plots, including the box plot, one of the most popular statisti…lnkd.in/dBe-3VZ
4
3
Dion Research LLC retweeted

6 Aug 2020
Check out this video tutorial on stem_graphic (the classic stem-and-leaf plot revisited)
youtube.com/watch?v=AH6FSh7-…
1
Dion Research LLC retweeted

30 Jul 2020
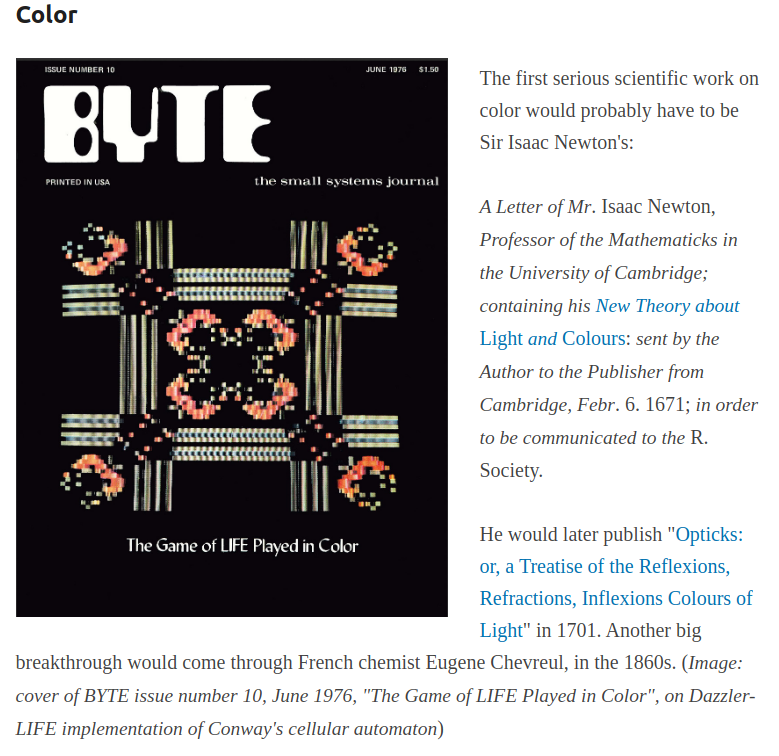
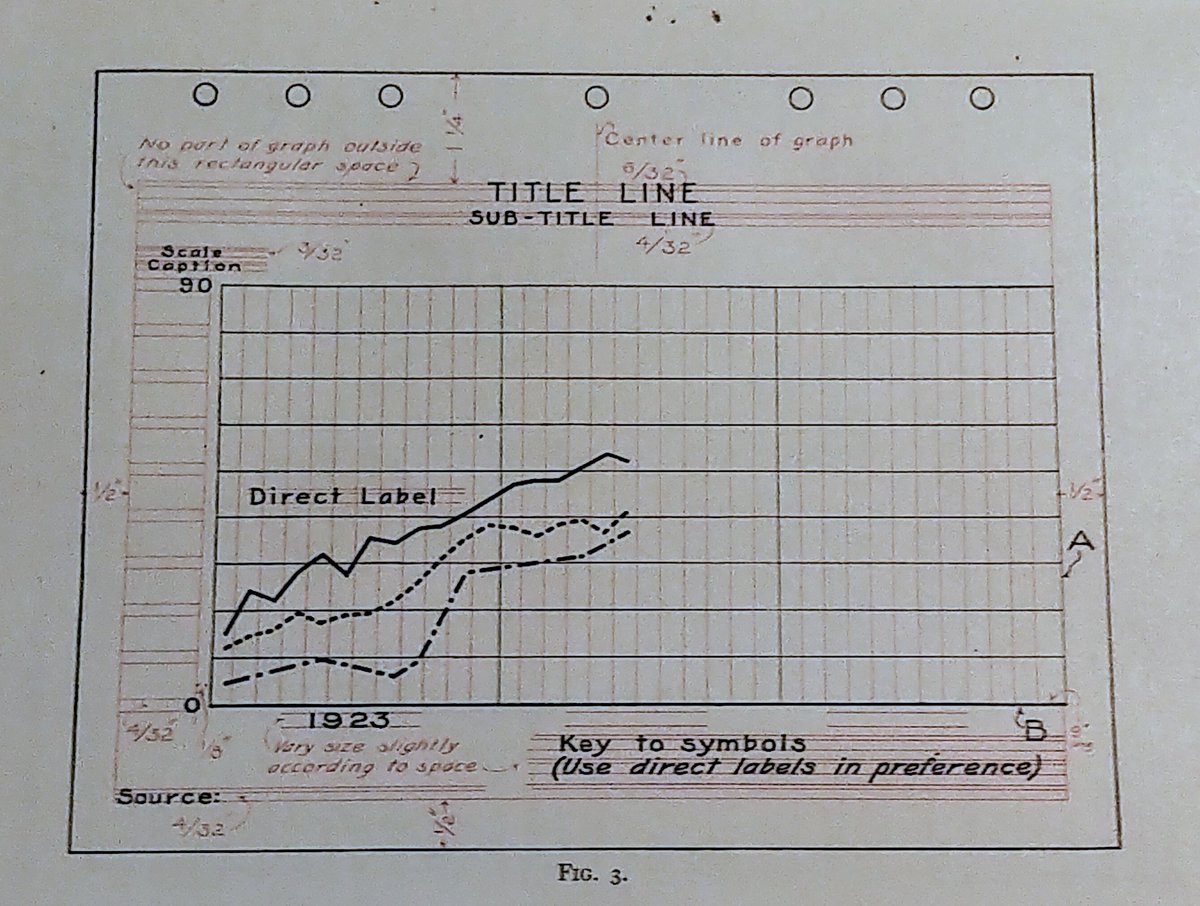
😍 For all the designers who've ever toiled away at specs and style guides like this (i.e. financial research report templates, investment statements, etc)
30 Jul 2020
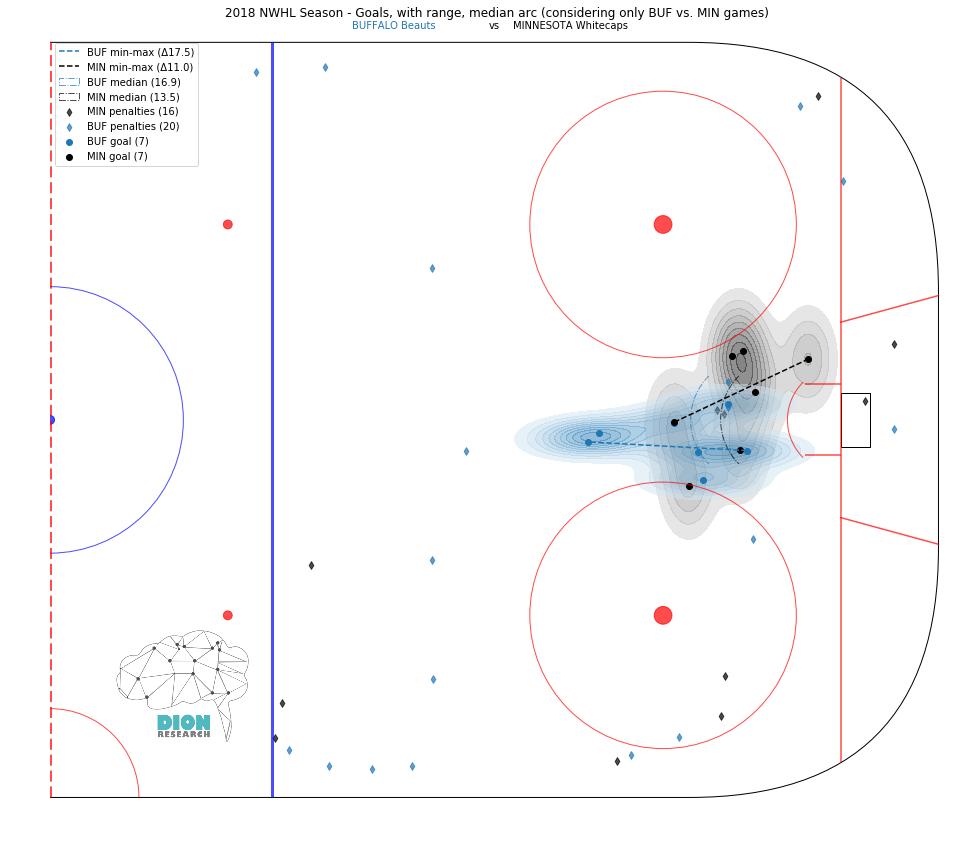
They do have a well defined approach to legend text on charts. Scale, title and subtitle, key to symbols, source (rare these days with people"borrowing" other people's work) & breathing room (margins) for the chart. There is a bit more reference lines than I would use, but 1920s!
2
3