
May 23
descriptive statistics
b.) Summarizing Data using Pivot Tables
c.) Conditional Formatting to derive insights
d.) Identifying anomalies and outliers.
#datacleaning #dataexploration #dataanalytics #justagirlwholikesdata💕
3
318

Feb 3
If you’re learning data analysis, my advice: just start. You’ll make mistakes (I made plenty), but that’s literally how you learn.
#python #dataanalysis #dataexploration
#datacleaning
medium.com/@ifechukwuokoli97…
2
174

Data isn’t the problem. Understanding it is.
Data Exploration Software enables smarter AI and better enterprise decisions.
🔗 cipher9.tech/data-exploratio…
#DataExploration #EnterpriseAI #AIAnalytics
14
11 Jun 2025
Sam introduces Dr. Pablo Mejia to the team, spotlighting AI-driven exploration and use of historical data to target high-margin zones like the northern corridor. Full interview: ow.ly/P7cy50VZukF
[More: ow.ly/PGrF50VZukG] #AIDriven #HistoricalData #DataExploration
3
12
777

4 Apr 2025
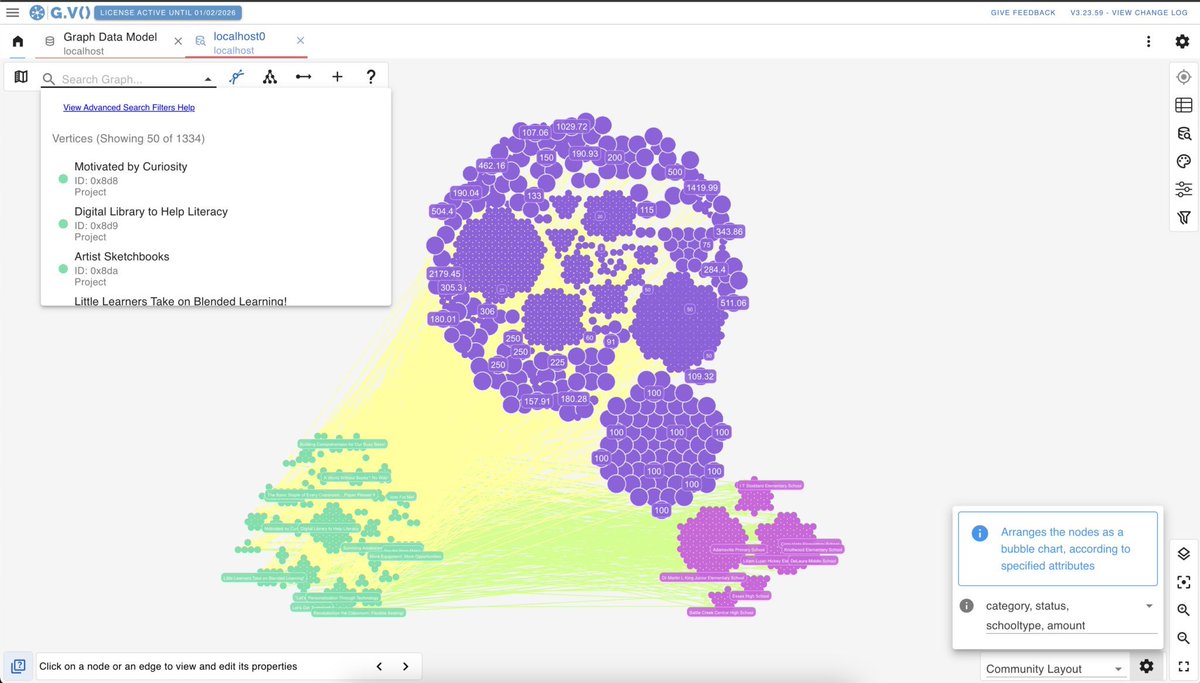
Enhance your Dgraph experience with G.V()'s interactive visualization features. Explore complex data relationships intuitively and share insights seamlessly.
Learn how: hypermode.com/blog/G-V-bring…
#DataExploration #Dgraph #GraphVisualization #GV
1
2
500

12 Mar 2025
Sometimes, the lack of drill-down in reports limits insights to just one side of the story. 📊 #PowerBI #DataExploration

1
2
162

9 Feb 2025
🚀 We’ve partnered with @mombasa_computers for our upcoming event #TechInCampus.
Join us on 27th February as we dive deeper into data exploration. 📊💡
Register here: lu.ma/0hlw7o3z
#TechEventsKE #DataExploration #Innovation #CampusTech 🎓 #TechInKenya #GadgetLifeKE
2
180

12 Jan 2025
Feeling a bit bored, so I decided to check out the populations and area sizes of major cities in Somalia using maps.ie! 📊🌍 #Somalia #DataExploration #Maps
9 Jan 2025

Overall I got this for Somalia overall. Some of the borders are disputed so I put some degmos under one of the mamuul gobleeds for simplicity

2
6
9
4,133

20 Dec 2024
Meet Dr. Tarek Azzam, mentor for our #UN Data Analytics Professional Certificate course!
Hear his insights on guiding learners in #DataExploration & #DataAnalysis to build confidence and context.
Watch now & register: unssc.org/courses/un-data-an…
#UNSSC #Data
1
2
131

20 Dec 2024
PS: 📅 #HELPLINE. Want to discuss your article? Need help structuring your story? Make a date with the editors of Low Code for Data Science via Calendly → calendly.com/low-code-blog-w…
#datascience #dataexploration #dataviz #KNIME #lowcode #nocode #opensource #visualprogramming
2
55
20 Dec 2024
#DataExploration reveals dataset #structure, #patterns, & #relationships before analysis or modelling. Vijaykrishna Venkataraman's brilliant tutorial uses #KNIME to #explore a dataset of hourly pedestrian counts from sensors in Melbourne.
📌 #READ → medium.com/low-code-for-adva…
1
4
5
166

18 Nov 2024
A few days ago, I made a post about why EDA is important in data analytics and I feel I should tell you some more benefits of EDA.
EDA stands for Exploratory Data Analysis and you perform basic and high-level analysis in EDA to have a better understanding of the data.
𝗜𝘁 𝗵𝗮𝘀 𝘃𝗮𝗿𝗶𝗼𝘂𝘀 𝗯𝗲𝗻𝗲𝗳𝗶𝘁𝘀 𝘀𝘂𝗰𝗵 𝗮𝘀:
• So, I also posted how to select relevant variables according to your business problems when your datasets are massive. EDA helps in that too.
• EDA also allows you to shop for KPIs or metrics when you are familiarizing yourself with the data.
• It can also allow you to flag some anomalies in the data because sometimes crucial data points can be missing. If you spend enough time in EDA, you can notice it and thus solve it.
So, always perform EDA as a data analyst. Never skip it.
Enjoy. Follow for more!
#ExploratoryDataAnalysis #DataAnalytics #DataScience #DataAnalyst #DataExploration #EDABenefits #Analytics #DataAnalysis #BusinessIntelligence #DataDrivenDecisionMaking #DataAnalyticsUSA #USDataAnalyst #DataScienceUSA #USAnalyticsJobs #DataDrivenUSA #DataAnalyticsUK #UKDataAnalyst #DataScienceUK #AnalyticsCareersUK #BusinessIntelligenceUK #DataAnalyticsEurope #EUDataAnalyst #DataScienceEurope #EuropeanAnalytics #DataJobsEurope #DataAnalyticsSG #SingaporeDataAnalyst #SGDataScience #AnalyticsJobsSG #SingaporeAnalytics #DataAnalytics #GlobalDataAnalyst #DataScienceCommunity #DataDriven #AnalyticsCareersWorldwide
2
28

🚀🔭 Embark on a multi-sensory journey to a #blackhole with Dr. @CMHarrisonAstro! Explore how sound can transform astronomical data, enhancing accessibility and immersive learning. 🌌🎶
Sign up to the lecture today ➡️ tinyurl.com/43re5h2u
#Astronomy #DataExploration

1
4
181
14 Nov 2024
When you work as a data analyst, a lot of time you will try to understand your customers so that you can target them effectively, improve their experience, improve marketing strategies, and much more.
𝗟𝗲𝘁 𝗺𝗲 𝗴𝗶𝘃𝗲 𝘆𝗼𝘂 𝘀𝗼𝗺𝗲 𝗯𝗮𝘀𝗶𝗰 𝗮𝗱𝘃𝗶𝗰𝗲 𝘁𝗵𝗮𝘁 𝗺𝗶𝗴𝗵𝘁 𝗯𝗲 𝘂𝘀𝗲𝗳𝘂𝗹 𝗶𝗻 𝘁𝗵𝗶𝘀:
• Perform EDA to understand key customer behavior such as purchases according to regions, age, gender, and more. This will allow you to have a high level of understanding about customers.
• Then try to group customers according to age (creating age groups), region, gender, and more.
• Now, analyze some important business metrics such as their membership tier, ratings, complaints, average spend, delivery timelines, and more.
• Now, try to combine customer variables with these key metrics such as:
1. Membership tier for each age group.
2. Segment customers according to complaints and age groups or regions.
3. Understand the satisfaction score given by customers who had complaints (you can create categorical variables for satisfaction scores such as "Bad", "Good" or "Excellent").
4. Then you can also dive deep into delivery timelines for different regions so that delivery time can be improved and more.
These are just some basic instances and how deep you can go into customer behavior actually depends upon how many crucial variables you have.
Enjoy. Follow for more!
#DataAnalyst #CustomerInsights #CustomerBehavior #DataAnalytics #CustomerExperience #CustomerSegmentation #CustomerSatisfaction #DataExploration #DataDriven #BusinessIntelligence #DataAnalysisTips #EDA #DataScience #TargetedMarketing #AnalyticsForBusiness #MarketAnalysis #CustomerJourney #AnalyticsCommunity #GlobalDataInsights #USDataProfessionals #UKAnalytics #EuropeDataScience #EUDataExperts #AnalyticsUK #USEmployment #GlobalAnalytics #WorldwideAnalytics #DataUSA #AnalyticsUK #EUDataAnalytics #UKDataCommunity #USDataScience #EUAnalytics #UKTechJobs #EuropeAnalytics #DataCareersUK #USAnalyticsJobs #DataInsightsEurope #GlobalDataCommunity #USDataProfessionals #UKHiring #DataAnalystEurope #EuropeDataJobs #GlobalTechCareers #WorldwideDataScience
2
19
8 Nov 2024
When you are working on a product or a feature, you cannot push it to all the customers/users at once. You need to test its performance first.
𝗕𝘂𝘁 𝗵𝗼𝘄 𝘄𝗶𝗹𝗹 𝘆𝗼𝘂 𝗱𝗼 𝘁𝗵𝗮𝘁?
Here comes A/B Testing.
𝗟𝗲𝘁 𝗺𝗲 𝗵𝗲𝗹𝗽 𝘆𝗼𝘂 𝘂𝗻𝗱𝗲𝗿𝘀𝘁𝗮𝗻𝗱 𝗶𝘁 𝗶𝗻 𝗲𝗮𝘀𝗶𝗲𝘀𝘁 𝘄𝗮𝘆 𝗽𝗼𝘀𝘀𝗶𝗯𝗹𝗲. 𝗛𝗲𝗿𝗲, 𝘄𝗲 𝘄𝗶𝗹𝗹 𝗷𝘂𝘀𝘁 𝘁𝗼𝘂𝗰𝗵 𝘁𝗵𝗲 𝘀𝘂𝗿𝗳𝗮𝗰𝗲 𝗼𝗳 𝗔/𝗕 𝘁𝗲𝘀𝘁𝗶𝗻𝗴.
• So, when you have a feature, you simply take a percentage of customers as a sample, let's say 5-10% of total customers. Also ensure that the sample is divided randomly among control and experimental sets.
• Then you divide this sample into two sets - control set and experimental set.
• Here, experimental set has the new feature while control group doesn't.
• Then you run the test so that the data collected is statistically significant (appropriate p-value or confidence intervals). Predefine your significance level, often with a p-value < 0.05 and confidence intervals.
• Then you check key metrics of both the sets such as customer engagement, conversion rate, customer retention and more. Key metrics depend upon the industry, feature and more.
• Now, if you are uncertain about the result, you can perform A/B testing again with bigger sample, for ex: 25-30% of total customers as sample. This will allow you to have better statistical power if you had high margin of error in your initial test.
• Now, if you find that experimental set is performing better than control set, rollout the feature for all the customers.
Also, I have excluded a lot of things which might make this explanation complex like you should use power analysis to decide how much customers to select in the sample.
Enjoy. Follow for more!
#ABTesting #DataAnalysis #DataAnalytics #ProductTesting #DataDriven #CustomerInsights #AnalyticsCommunity #DataScience #TestingStrategies #DataMetrics #DataTesting #CustomerEngagement #AnalyticsJobs #DataProfessionals #GlobalData #TechCareers #AnalyticsHiring #StatisticalAnalysis #DataCareers #ProductAnalytics #AnalyticsExpert #BusinessIntelligence #DataExploration #DataInsights #TechCommunity #DataAnalyticsUSA #DataAnalystUSA #TechJobsUSA #USDataScience #DataCommunityUSA #AnalyticsUSA #DataAnalyticsUK #DataAnalystUK #TechJobsUK #UKDataScience #AnalyticsUK #DataCommunityUK #DataAnalyticsEurope #DataAnalystEurope #TechJobsEurope #EUDataScience #AnalyticsEurope #DataCommunityEurope #GlobalDataAnalytics #DataAnalyticsGlobal #WorldTechJobs #DataScienceWorldwide #AnalyticsWorldwide #GlobalDataAnalyst
2
23

🚀 What can Explore Data do for you? Instantly find the perfect dataset, view sample sizes, population means, and more—no downloads needed! 📈🔍 #DataExploration #ExploreDataICPSR #ResearchDataEcosystem @NSF
ALT ICPSR Explore Data logo with a brief description of added functionality for statistical data exploration, allowing users to find data quickly without downloading, and gain insights on sample sizes and means for populations and subgroups.
2
3
355

24 Oct 2024
🚀 Deploy #NewRelic's fork of the #OpenTelemetry Community demo app on #Kubernetes using Helm. Enable a feature flag 🏁 and explore the data. 📊
#HelmDeployment #FeatureFlag #DataExploration #K8s #Observability #DevOpsTools #TechImplementation bit.ly/4hmTMGv
1
3
36

13 Oct 2024
Day 2
Data exploration
Data Exploration Begins!
With pre-cleaned NBS data, I'm diving into Nigeria's crime statistics. Stay tuned for fascinating findings! #CrimeStatistics #DataExploration
#datafam #datafestafrica2024 @alase_ayorinde @aromeibrahim_ @AyoSolarin @ezekiel_aleke
12 Oct 2024

Day 1
Downloaded the dataset from NBA(Nigeria beareu of statistics)
N.B changed the topic to crime rate analysis in Nigeria in 2017
2
221

11 Oct 2024
Day 78 of #100DaysOfCode #Python #Pandas #Data #DataScience #DataExploration #Google #Visualization #Pandas #Seaborn #Regression #LinearRegression
Linear regression and data visualisation with Seaborn.
Keep learning.....

1
2
73

10 Sep 2024
Use Powerdrill AI, explore your datasets using natural language for clear, insightful, and visually organized Q&As now!🥳
Try it now! powerdrill.ai/
#PowerdrillAI #DataExploration
1
90