
Experienced technical analyst with a passion for deciphering market trends. Using charts and indicators to navigate the world of finance. #TechnicalAnalysis
Joined June 2020
- Tweets 3,971
- Following 586
- Followers 1,258
- Likes 23,741
1,885 Photos and videos


Pinned Tweet

14 Jun 2023
Disclaimer: The content shared on this account is for informational purposes only and should not be considered as financial advice. Always do your own research and consult with a professional before making any investment decisions. #NotFinancialAdvice
9
2
18
12,115
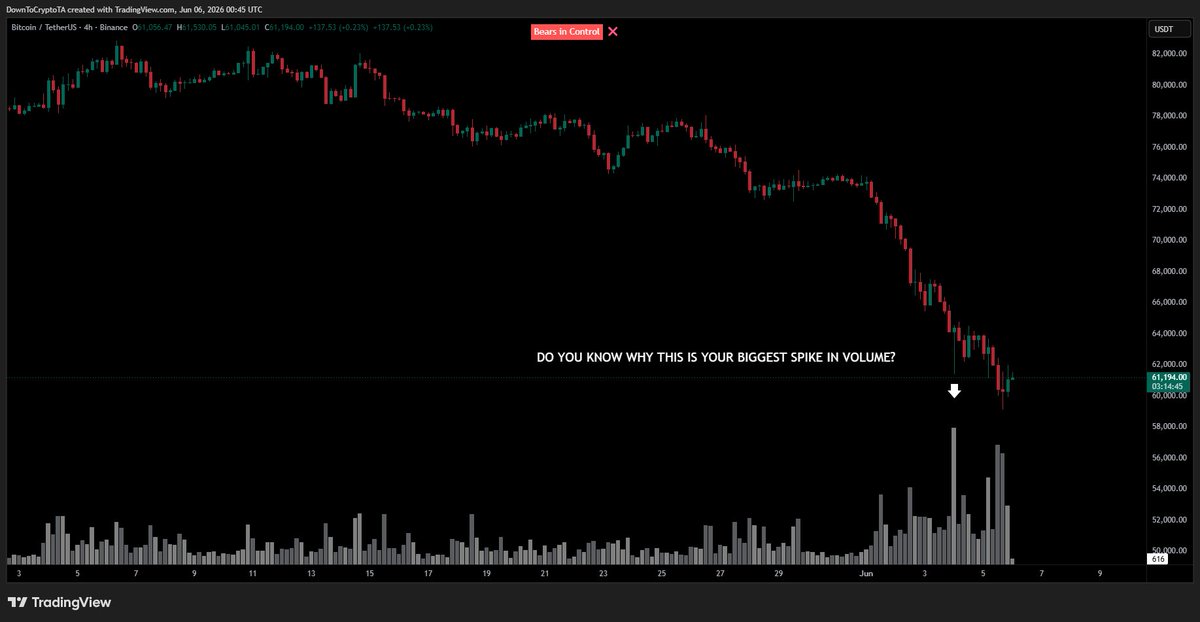
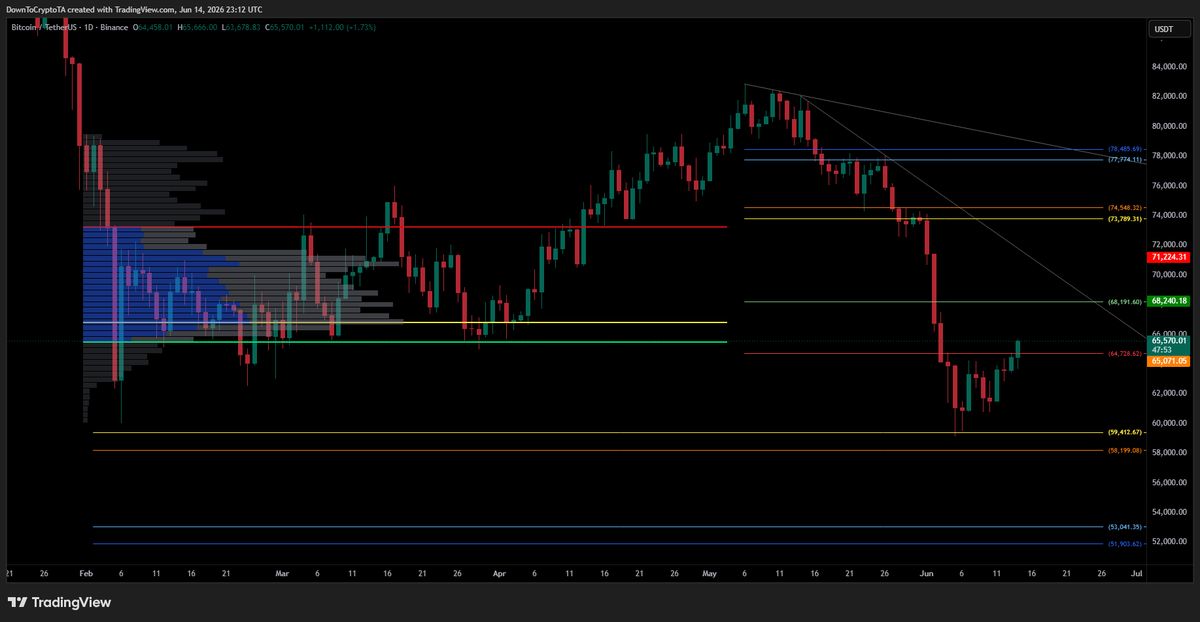
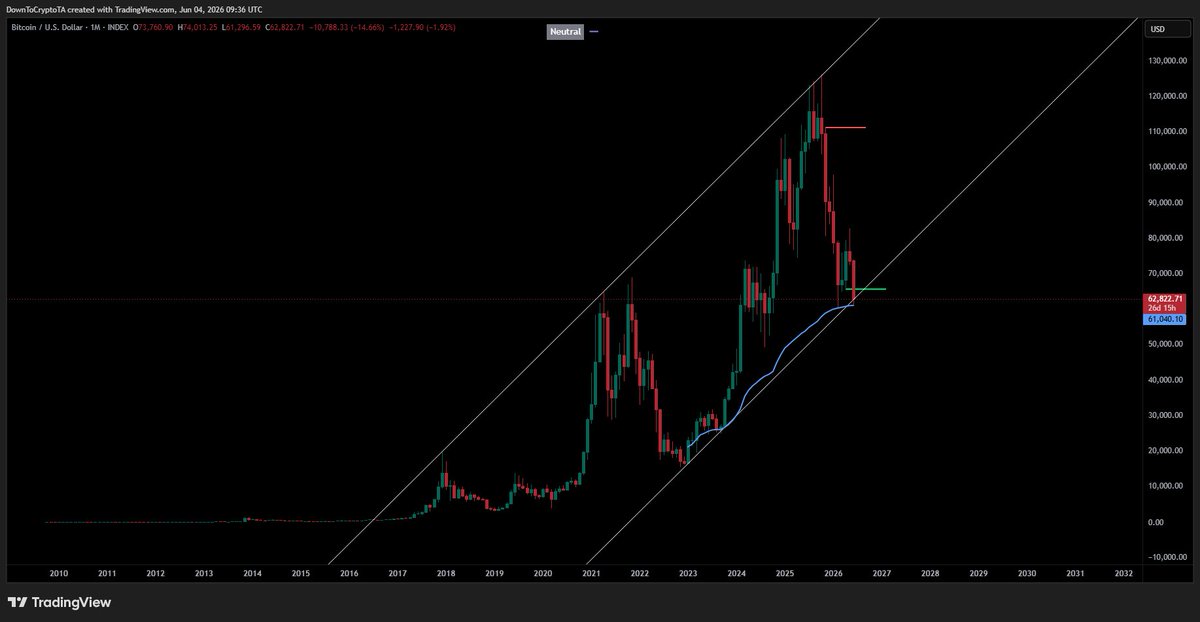
The last thing I expected was for #Bitcoin to get a successful backtest of the breakout. My assumption was that the breakout itself was more of an overshoot than a sustainable move higher.
Leading into the breakdown, price had been overlapping within a rising structure while simultaneously showing bearish divergence at the highs. Because of that, when we finally broke down from the pattern, I expected Bitcoin to rotate lower into the Golden Pocket retracement zone and potentially backtest the underside of the larger triangle structure. Given the lower liquidity conditions that we often see over the weekend, that seemed like the more probable outcome.
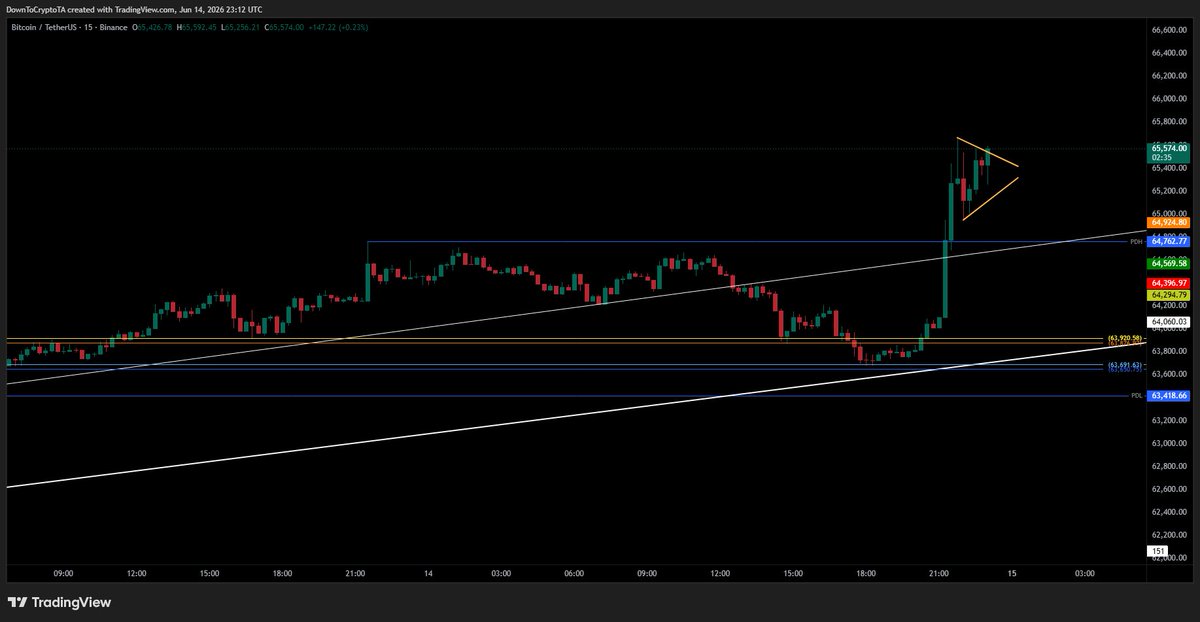
Instead, we saw a significant surge in volume push price back to the upside. That move carried Bitcoin directly into the Value Area Low of the broader range, which is now becoming an important area to monitor.
If Bitcoin can successfully reclaim and hold above the Value Area Low, then I think there is a reasonable case for continuation higher, with the 0.382 Fibonacci retracement level becoming the next area of interest.
That said, I'm generally not eager to trade aggressively over the weekend. Weekend price action can be deceptive due to thinner liquidity conditions, and I prefer to see how the market behaves once traditional market participants return.
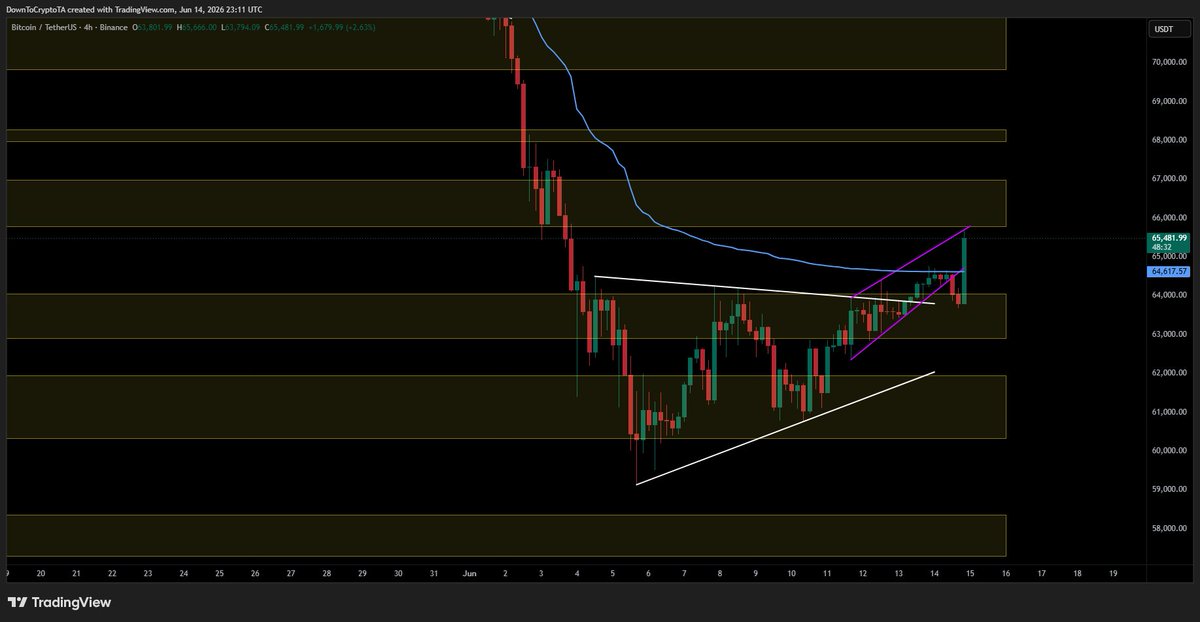
What is encouraging is that the Value Area Low is producing a reaction. On the lower timeframes, specifically the 15-minute chart, price appears to be forming a triangle pattern that could potentially develop into a bull flag. If that structure resolves to the upside and price can maintain acceptance above the Value Area Low, it would strengthen the bullish case heading into next week.
For now, I'm remaining patient. The reaction at the Value Area Low is constructive, but I want to see confirmation before assuming this move has enough strength to continue higher.

Just wanted to share a quick #Bitcoin update.
I am currently holding a long position on Bitcoin, but I recently opened a short position as well after price action began showing significant overlap and started developing what appears to be a more bearish structure. As price pushed into VWAP, I felt it was a reasonable area to hedge some of that long exposure and position for a potential pullback.
At the moment, I'm looking for a move back down into the Golden Pocket retracement zone, potentially extending toward the 0.786 Fibonacci retracement level. That area would be of particular interest if the market decides to continue correcting before the next meaningful move higher.
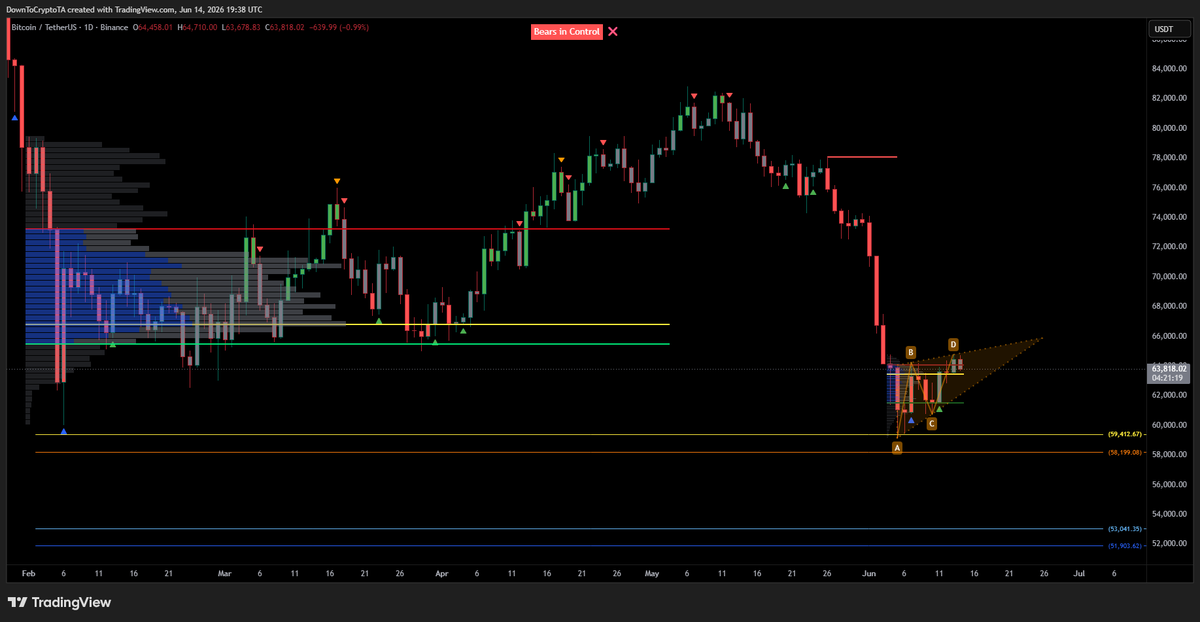
One thing I'm watching closely is the recent break above this wedge structure. Right now, I don't think we can confidently say that Bitcoin is successfully backtesting the breakout. Price has not provided enough confirmation for me to view it as a clean breakout-and-retest scenario just yet.
Adding to my caution, the daily timeframe is beginning to resemble either a bear flag or a rising wedge formation developing at these new highs. Both patterns have the potential to resolve lower, which is why I'm remaining defensive in the near term despite maintaining my longer-term bullish exposure.
For now, I'm looking for the market to show its hand. If Bitcoin can reclaim strength and invalidate the bearish structure, I'll reassess. Otherwise, a move back into the Golden Pocket would be a completely normal retracement and an area where I would be paying very close attention for the next long opportunity.

50
Well #Bitcoin came back and stopped me out 🤣. Thankfully with profits locked, lol
28
Just wanted to share a quick #Bitcoin update.
I am currently holding a long position on Bitcoin, but I recently opened a short position as well after price action began showing significant overlap and started developing what appears to be a more bearish structure. As price pushed into VWAP, I felt it was a reasonable area to hedge some of that long exposure and position for a potential pullback.
At the moment, I'm looking for a move back down into the Golden Pocket retracement zone, potentially extending toward the 0.786 Fibonacci retracement level. That area would be of particular interest if the market decides to continue correcting before the next meaningful move higher.
One thing I'm watching closely is the recent break above this wedge structure. Right now, I don't think we can confidently say that Bitcoin is successfully backtesting the breakout. Price has not provided enough confirmation for me to view it as a clean breakout-and-retest scenario just yet.
Adding to my caution, the daily timeframe is beginning to resemble either a bear flag or a rising wedge formation developing at these new highs. Both patterns have the potential to resolve lower, which is why I'm remaining defensive in the near term despite maintaining my longer-term bullish exposure.
For now, I'm looking for the market to show its hand. If Bitcoin can reclaim strength and invalidate the bearish structure, I'll reassess. Otherwise, a move back into the Golden Pocket would be a completely normal retracement and an area where I would be paying very close attention for the next long opportunity.
84
I was looking back at the mistake I made when analyzing $HYPE, and I finally identified where I went wrong.
I was correctly tracking the five-wave move to the downside, but when it came time to project the Wave 5 target, I accidentally used a Fibonacci retracement instead of a Fibonacci extension. Because of that mistake, I underestimated the downside target and completely missed the move.
I've corrected that error on my chart now and have the proper Fibonacci extension applied.
Looking at the current structure, I'm viewing the move as an ABC correction. You could make the argument that the B wave is already in place. Personally, I don't think the structure looks ideal for a completed B wave, but it is possible considering the reaction came from roughly the 50% retracement of Wave A.
If that interpretation is correct, then the next thing I want to see is price break above the descending trendline currently visible on the chart. A breakout through that trendline and a move above the Wave 4 high would strengthen the case that Wave C is underway.
If that scenario does not play out, then I'll be watching for a deeper retracement into the Golden Pocket, potentially extending toward the 0.786 retracement level. Should price reach that area, I'll be looking closely for a long opportunity based on the price action that develops there. One possible setup that could emerge is an inverse head-and-shoulders formation.
Another piece of confluence that stood out to me is the centerline of the parallel channel. Interestingly, the Wave 5 completion occurred right at that centerline, adding another layer of technical support to the area and helping validate the significance of that low.
For now, the key question is whether the current structure has already completed its B wave and is preparing for a Wave C advance, or if one final retracement is needed before the next meaningful move higher can begin.

53
Jun 12
Unfortunately I did not get in the trade. Busy day and missed the conformation alarm for $AMZN
Jun 10
I'm holding out for the next potential long opportunity on $AMZN. The short setup has played out, and while there may still be a little more downside left in the move, most of the downside objective has already been achieved.
At this point, I'm not interested in rushing into another long position (attempted a corrective long shared). I need to see additional confirmation that buyers are stepping back in and that a meaningful low is beginning to form before I take another shot on the long side.
For now, patience is the plan. If Amazon can establish support, put in a higher low, or show other signs of strength, I'll start paying much closer attention to a potential long entry. Until then, I'm content to let the chart develop and wait for the market to provide a clearer signal.
The short thesis has done its job. Now it's a matter of determining whether Amazon is preparing for a larger reversal higher or if it needs more time to correct before the next meaningful bounce can begin.
1
72
Jun 10
I'm holding out for the next potential long opportunity on $AMZN. The short setup has played out, and while there may still be a little more downside left in the move, most of the downside objective has already been achieved.
At this point, I'm not interested in rushing into another long position (attempted a corrective long shared). I need to see additional confirmation that buyers are stepping back in and that a meaningful low is beginning to form before I take another shot on the long side.
For now, patience is the plan. If Amazon can establish support, put in a higher low, or show other signs of strength, I'll start paying much closer attention to a potential long entry. Until then, I'm content to let the chart develop and wait for the market to provide a clearer signal.
The short thesis has done its job. Now it's a matter of determining whether Amazon is preparing for a larger reversal higher or if it needs more time to correct before the next meaningful bounce can begin.
Apr 24
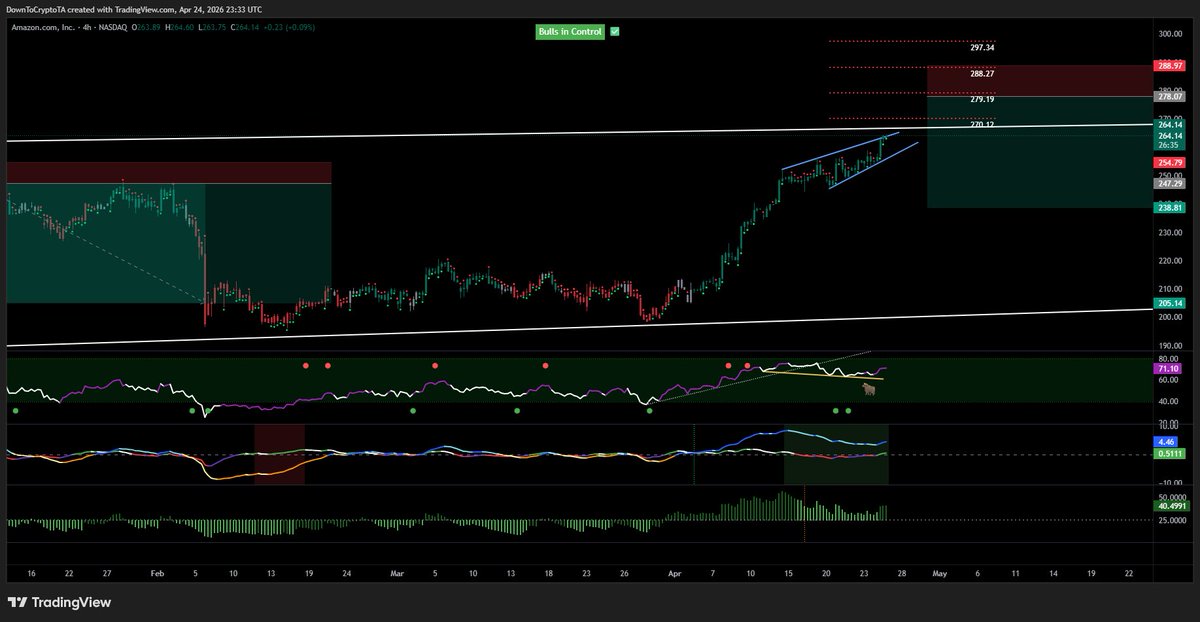
Watching Amazon ( $AMZN ) here as it continues to grind higher.
At this point, price looks like it needs to catch its breath.
I’ve got an ascending trend line overhead that’s been adjusted for prior taps, and price is getting pretty close to it now. Momentum still looks relatively strong with bullish divergence underneath, so this isn’t a high-conviction reversal—more of a potential pullback setup.
If we get a clean rejection off that trend line, I’ll be looking for a short with roughly a 3:1 setup back into local support.
If price pushes through and finds acceptance above, I’m watching around 278.00 for signs of exhaustion before considering anything.
Overall, I’m not expecting anything major to the downside here. This still looks like a higher low in the making before continuation to the upside—but a pullback wouldn’t be surprising at all.

1
117
Jun 10
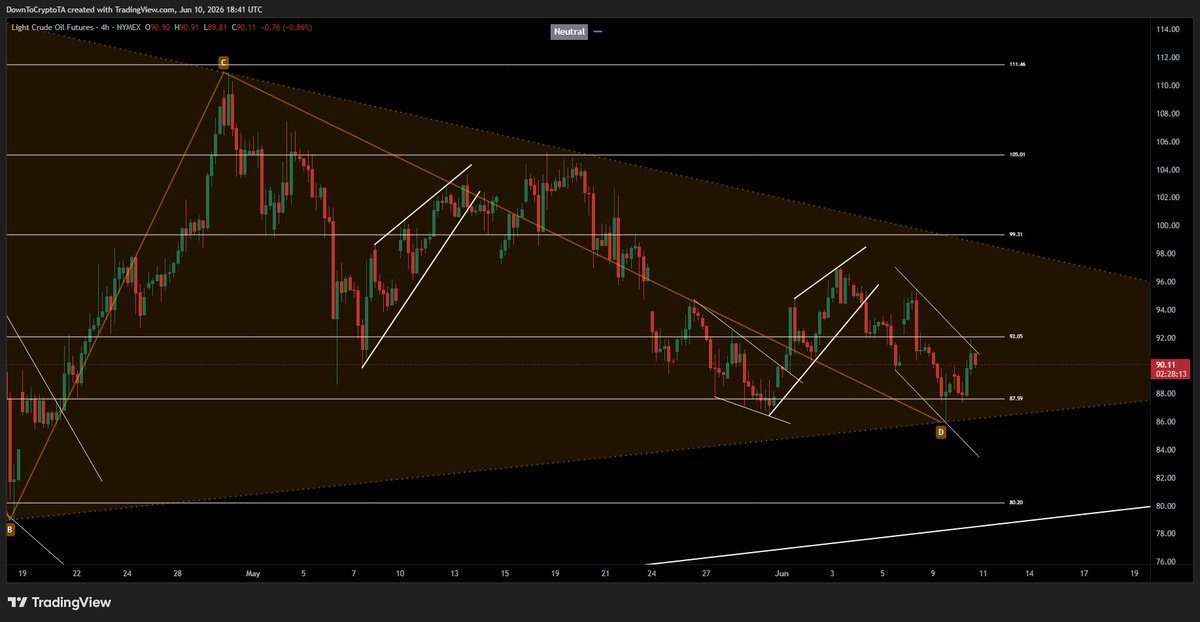
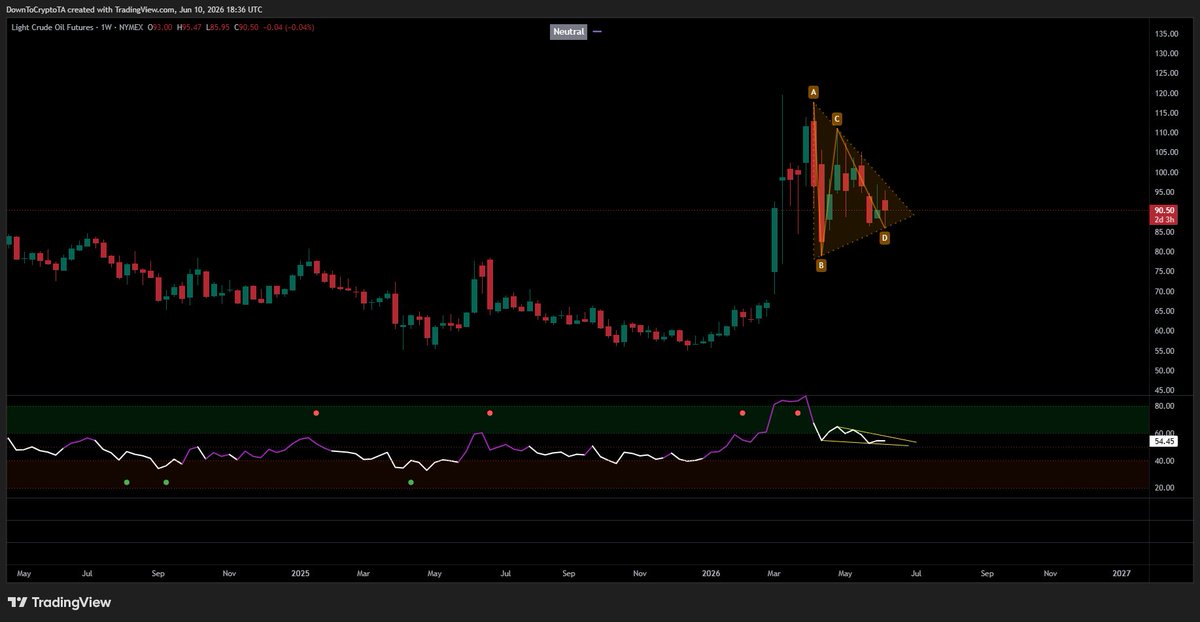
$CL Oil has been trading in a very tight consolidation range for quite some time, and it appears to be approaching a decision point where a meaningful breakout or breakdown is becoming increasingly likely.
One thing that stands out to me is that this is now the second time oil has rotated back toward its mean on the weekly timeframe. While that alone doesn't guarantee a bearish outcome, it does add to the growing confluence that supports the possibility of a breakdown from the current consolidation pattern. At the moment, price is trading much closer to the lower boundary of the range than it is to a bullish breakout level, which slightly favors the downside scenario from a risk perspective.
Looking at the larger picture on the monthly timeframe, I see an even broader consolidation structure developed. I've applied a channel to the range, anchoring it off the major highs and lows. Admittedly, the lower boundary cuts through a portion of the candle bodies more than I would normally prefer, but after testing several alternatives, it appeared to be the most reasonable way to frame the overall structure.
Because of that larger consolidation, I think it's worth considering the possibility that oil has already put in a significant top and is simply consolidating before the next directional move lower. Of course, confirmation is still needed, but the setup is something I'm watching closely.
If we do get a breakdown, one of the first areas I'd be monitoring would be the most recent breakout level. Former breakout zones often become important backtest areas, and that level could provide the first meaningful opportunity for buyers to attempt a defense or for traders to evaluate whether the breakdown has conviction behind it.
For now, the market remains trapped in consolidation, but it feels like we're getting closer to a resolution. The next decisive move out of this range could provide valuable insight into the larger trend going forward.


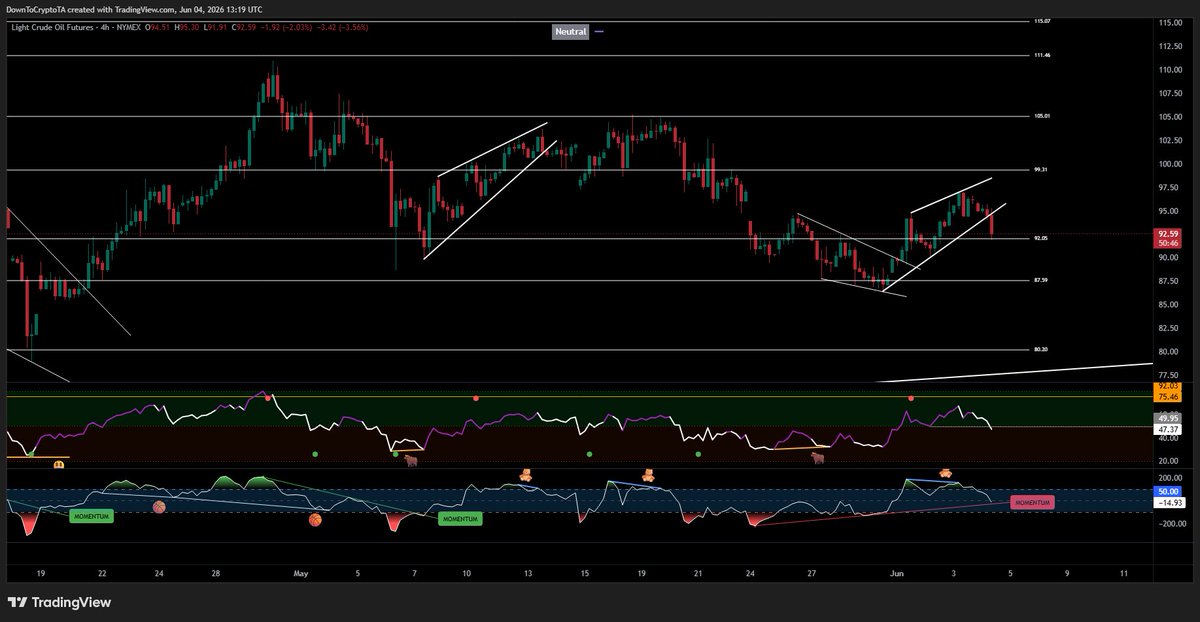
I shared an update on #oil $CL yesterday, highlighting a rising structure on the 4-hour timeframe along with bearish divergence beginning to develop. During today's livestream, I mentioned the possibility of a spring effect around the 92.05 level now that price has finally broken below the lower boundary of that rising formation.
If buyers are able to step in and defend this area, we could see a short-term reaction bounce from these levels. However, if the spring setup fails to materialize, then 87.59 remains a key area to watch. Historically, price has shown a tendency to revisit that level, making it a logical downside target should weakness continue.
For now, the breakdown from the rising structure shifts the focus toward downside risk, while the 92.05 area serves as the first line of defense for the bulls.
1
2
192
Jun 10
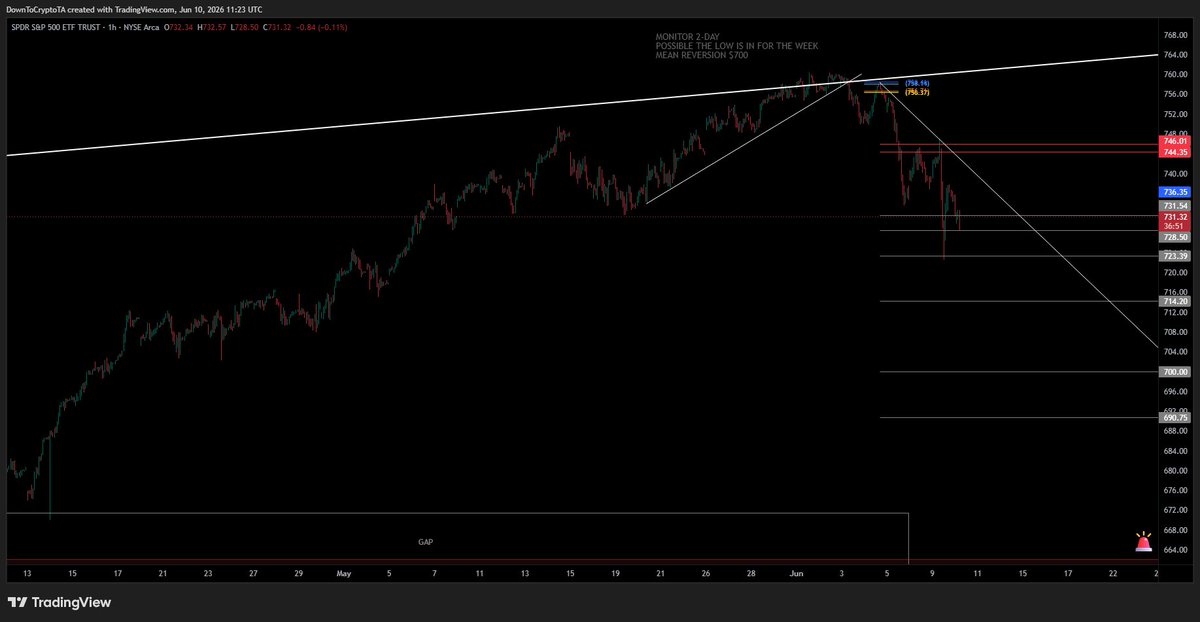
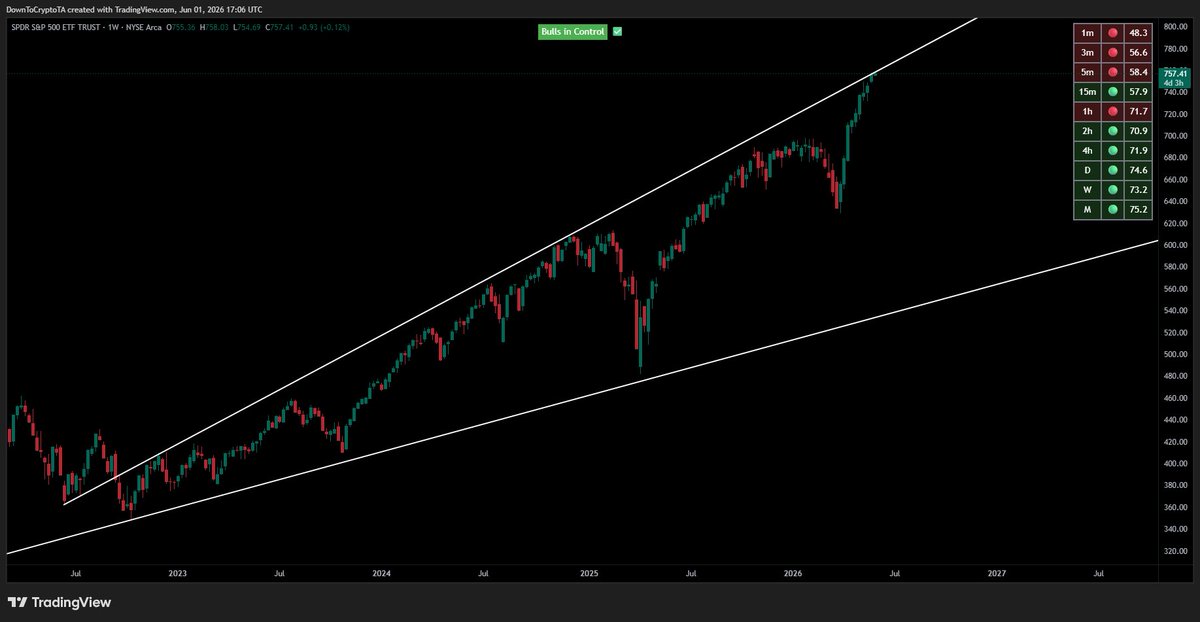
Here's what I'm currently seeing on $SPY.
On the weekly timeframe, there is a possibility that the $723 area may have marked the low for the week. At the moment, my indicators are reading more neutral than bullish or bearish, which would suggest that consolidation is the more likely near-term outcome rather than an immediate directional move.
The key level I'm watching is $720. If price loses that low, it would likely trigger an expansion phase on the daily timeframe. At the same time, the weekly timeframe would begin transitioning out of a relative-strength environment and into one that favors relative weakness. That shift in character could increase the probability of a deeper correction developing.
If that downside scenario unfolds, the primary mean reversion target I'm tracking sits around the $700 level. That area represents the most significant reversion zone on my charts and would be a logical place to look for buyers to step in and attempt to stabilize price.
For now, the market appears to be in a wait-and-see environment. As long as the $720 level remains intact, consolidation remains the base case. However, a break below that level could quickly change the tone and open the door for a move toward the $700 mean reversion zone.
$SPY hit the topside of the trendline in our previous discussions. Price displayed a short reaction, but will we stall out longer at this resistance is the question. So far nothing is broken.
1
144
Stopped out of the aggressive $AMZN long after a small bounce.
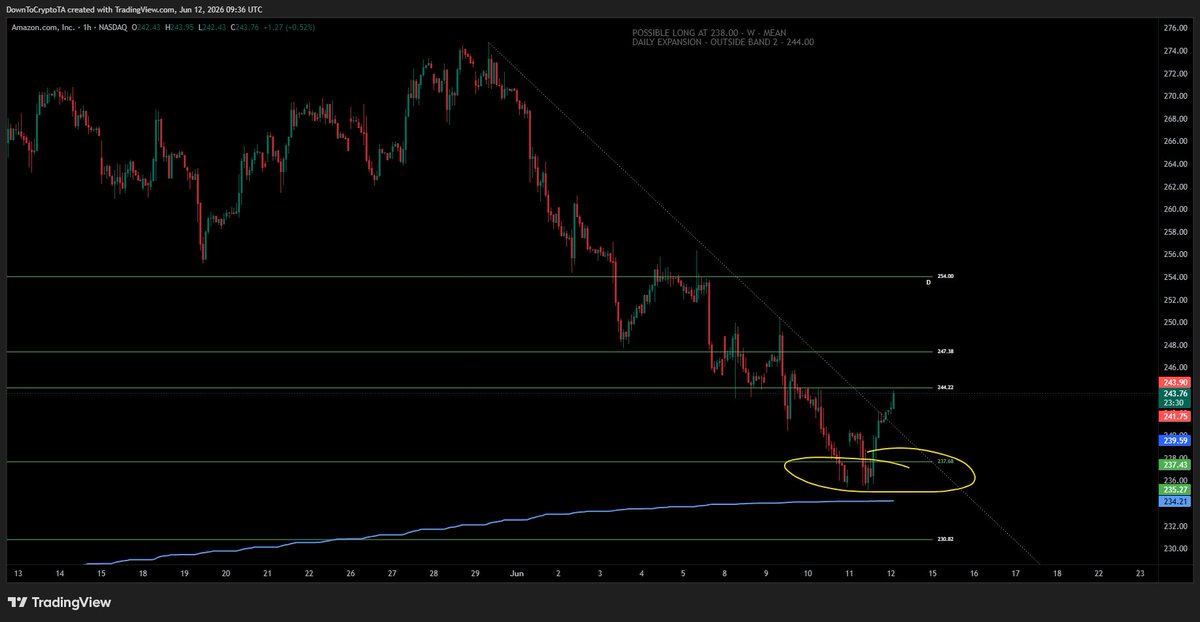
I entered a long position on $AMZN here, but I want to be clear that this is a very aggressive entry. The indicator conditions are not particularly strong at the moment, and the setup is far from ideal. Because of that, I'm treating this as a higher-risk trade than I normally would.
If the trade works, great. But if I get stopped out, I'm not going to force another entry immediately. Instead, I'll be watching the area around 238 to 237 very closely. That zone lines up with a mean reversion level on the weekly timeframe and is a location where I would be much more interested in seeing how price reacts.
My preference would be to see Amazon trade down into that area, find support, and show signs that buyers are stepping back in. If we get that reaction, it could provide a much more attractive risk-to-reward opportunity for a long position than what is available right now.
For the time being, I'm giving this current long a chance to work, but I'm fully aware that the technical conditions are not ideal. If price proves me wrong, I'll step aside and wait patiently for a potentially better setup lower down.
83
I entered a long position on $AMZN here, but I want to be clear that this is a very aggressive entry. The indicator conditions are not particularly strong at the moment, and the setup is far from ideal. Because of that, I'm treating this as a higher-risk trade than I normally would.
If the trade works, great. But if I get stopped out, I'm not going to force another entry immediately. Instead, I'll be watching the area around 238 to 237 very closely. That zone lines up with a mean reversion level on the weekly timeframe and is a location where I would be much more interested in seeing how price reacts.
My preference would be to see Amazon trade down into that area, find support, and show signs that buyers are stepping back in. If we get that reaction, it could provide a much more attractive risk-to-reward opportunity for a long position than what is available right now.
For the time being, I'm giving this current long a chance to work, but I'm fully aware that the technical conditions are not ideal. If price proves me wrong, I'll step aside and wait patiently for a potentially better setup lower down.
1
237
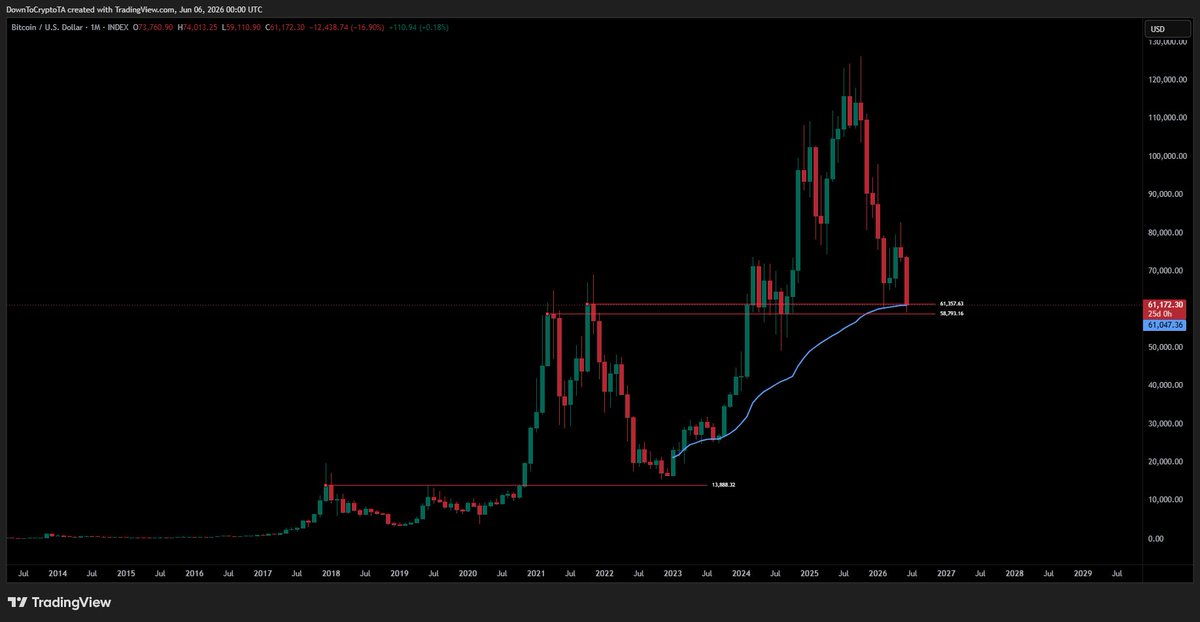
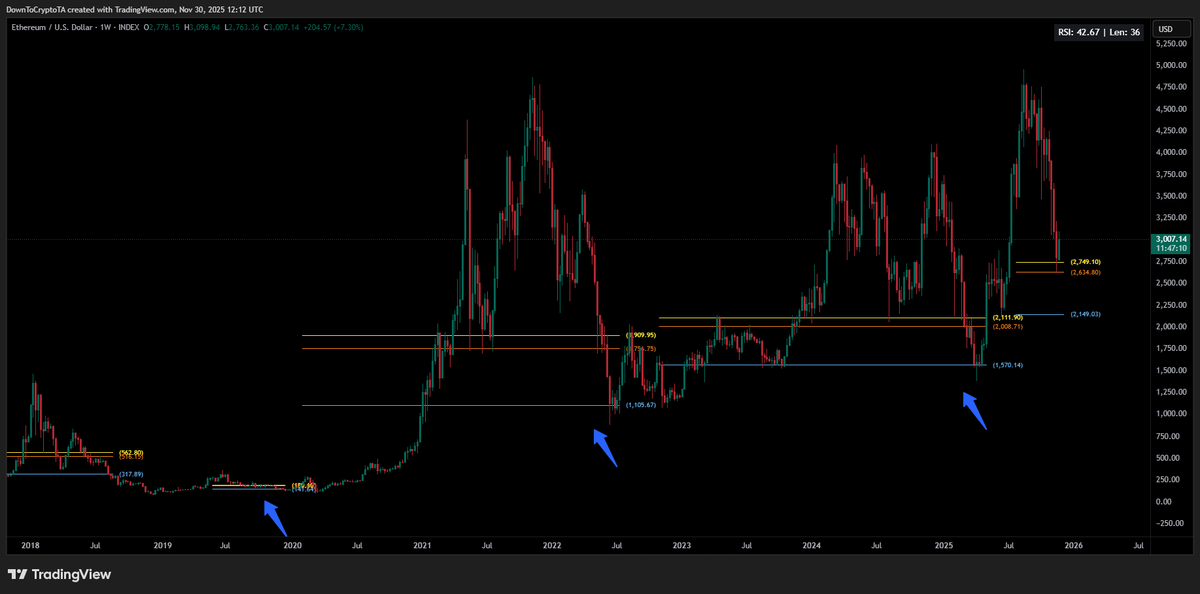
It was last year when I shared the levels $ETH may find support and price is now at the most important level that held the prior three major swing lows. This is the level of levels. Follow me for future road maps.
30 Nov 2025
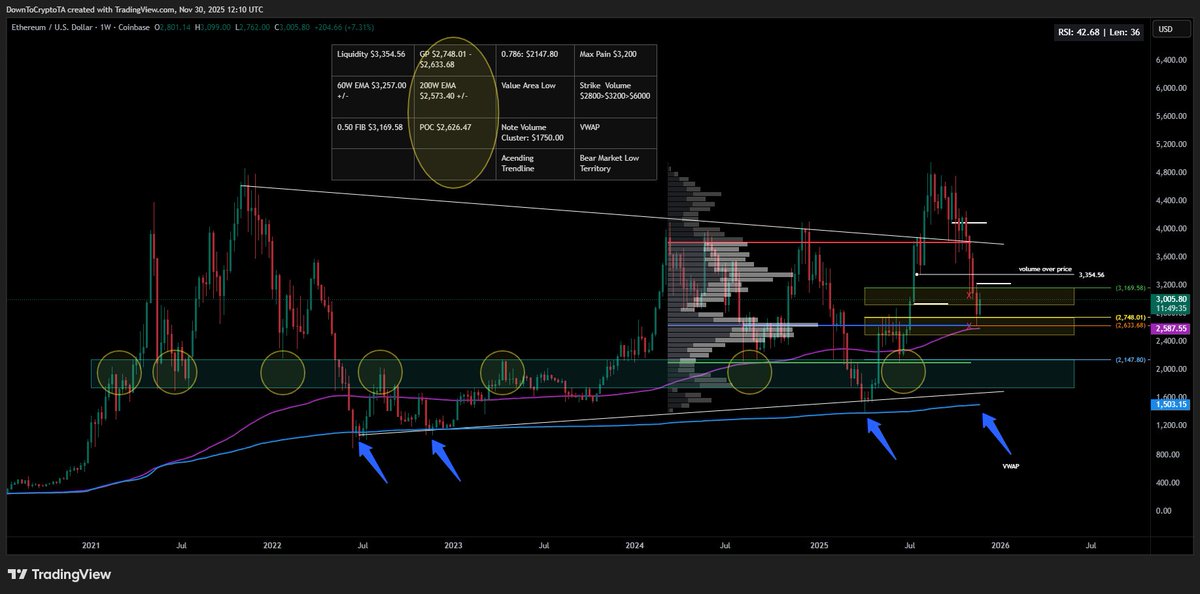
#Ethereum Update
I’ve updated my notes on Ethereum — the only major chart change being the addition of VWAP for broader context.
One key observation: the last three significant recoveries in $ETH didn’t occur from the Golden Pocket, but rather from a deeper retracement into the 0.786 Fibonacci level. In contrast, the current bounce is happening directly from the GP, which historically has not been the level where Ethereum’s major reversals formed.
If price does see further downside, the levels I’ve highlighted should serve as strong points of interest, especially where VWAP, standard deviations, and Fib confluence overlap. I’ll be walking these levels back as price corrects, adjusting the confluence zones accordingly.
2
170
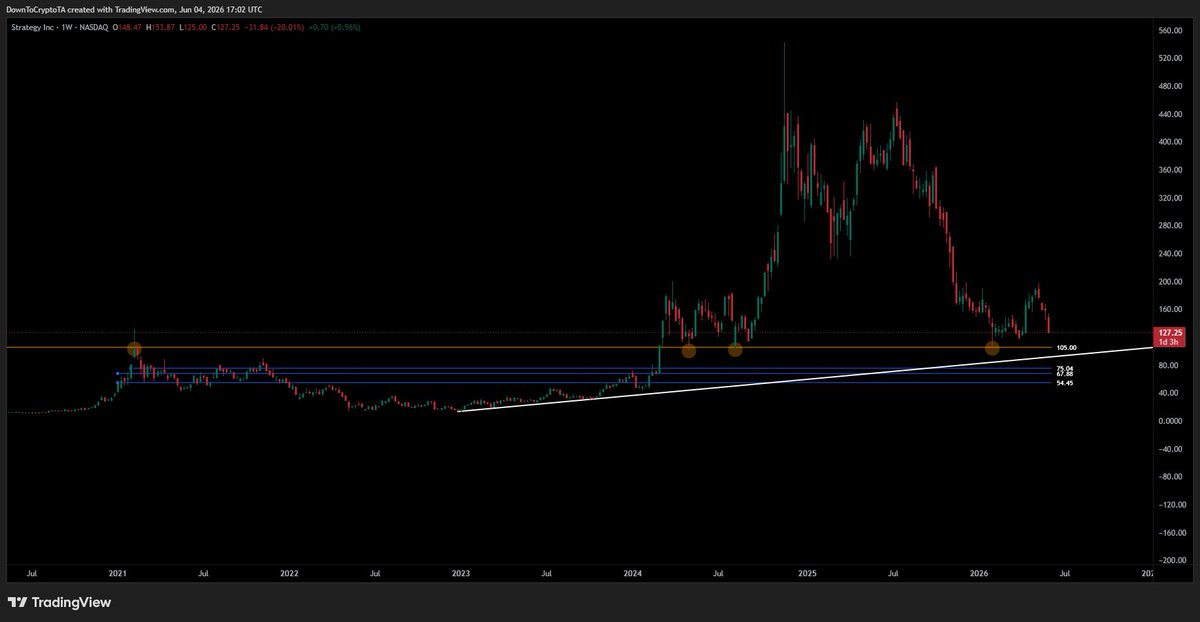
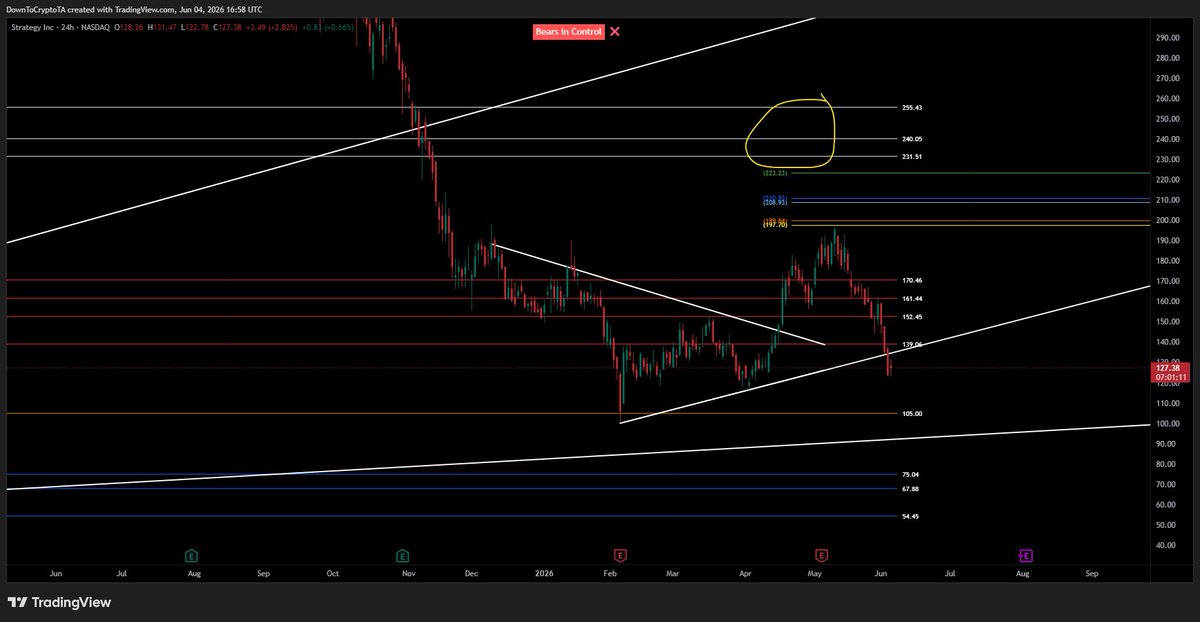
I completely missed the mark on my $MSTR (MicroStrategy) call, and sometimes that's just part of trading. When you're putting your analysis out there publicly, you're going to get some right and some wrong. This one definitely falls into the latter category.
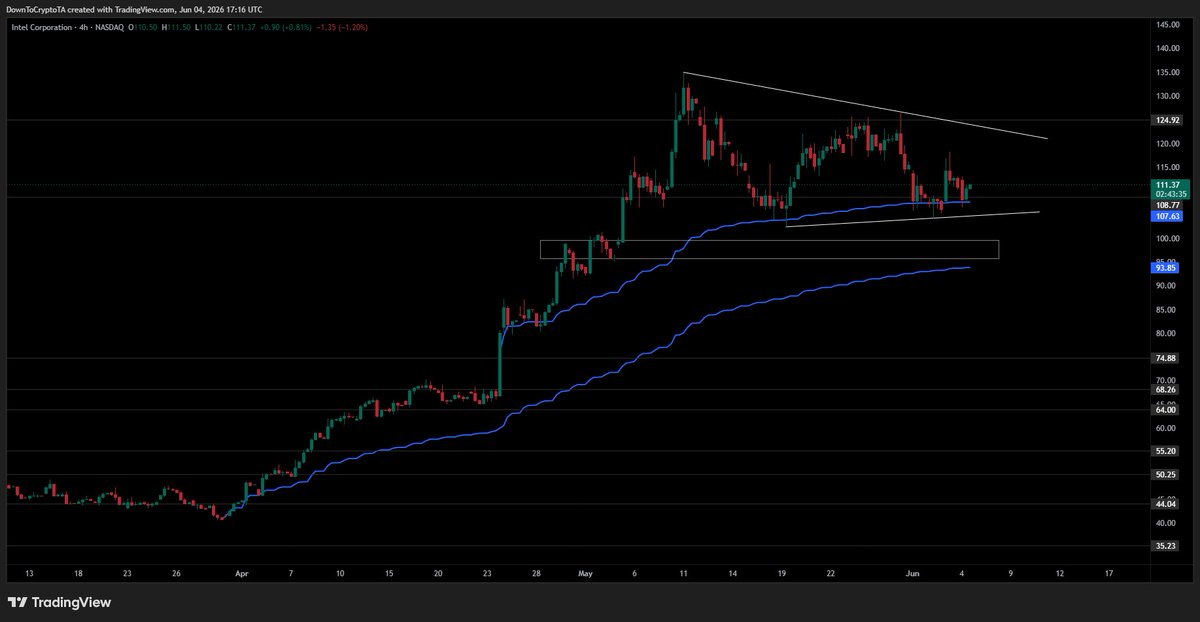
Looking at the chart now, the 4-hour timeframe appears to be trying to establish some support around the $127 area. Personally, I don't see that level as a major support zone. It sits in an area that doesn't have much significance based on the levels I'm tracking, which makes it difficult for me to have a high degree of confidence in it.
Because of that, I think the possibility of continued downside remains on the table. The next area I'm watching is a lower trend line that comes in just below $105. That's a region where Strategy has previously found support, so it would not surprise me to see price gravitate toward that level. If it gets there, a temporary breakdown or wick below the trend line followed by a recovery back above it could potentially create a stronger support signal.
Below that area, the next meaningful support zone I'm watching doesn't really begin to appear until around $80 and lower.
For now, I'm treating this chart cautiously. Until price proves it can establish and defend a meaningful support level, I think it makes sense to remain defensive and let the chart show its hand before making any strong assumptions about a bottom being in place.
Apr 18
Major resistance in play for $MSTR.
Price has now filled the gap near my top red zone, and there is a wedge structure that aligns with this resistance area.
If price continues higher from here, I’d be targeting the white zone next.
There is a pocket between the red and white zones that I consider a “low resistance” area. It has acted as a reversal point in the past, but it’s not something I heavily factor into my analysis.
On the higher timeframe, the monthly doesn’t show a strong trend, but it does highlight that the recent bounce came from a common momentum reversal zone. Combined with the MACD, this leans toward continued upside.
That said, continuation doesn’t mean straight up — pullbacks are still on the table, but as long as lows hold, the structure remains intact.
For now, it’s a waiting game. Price will tell the story.

2
108
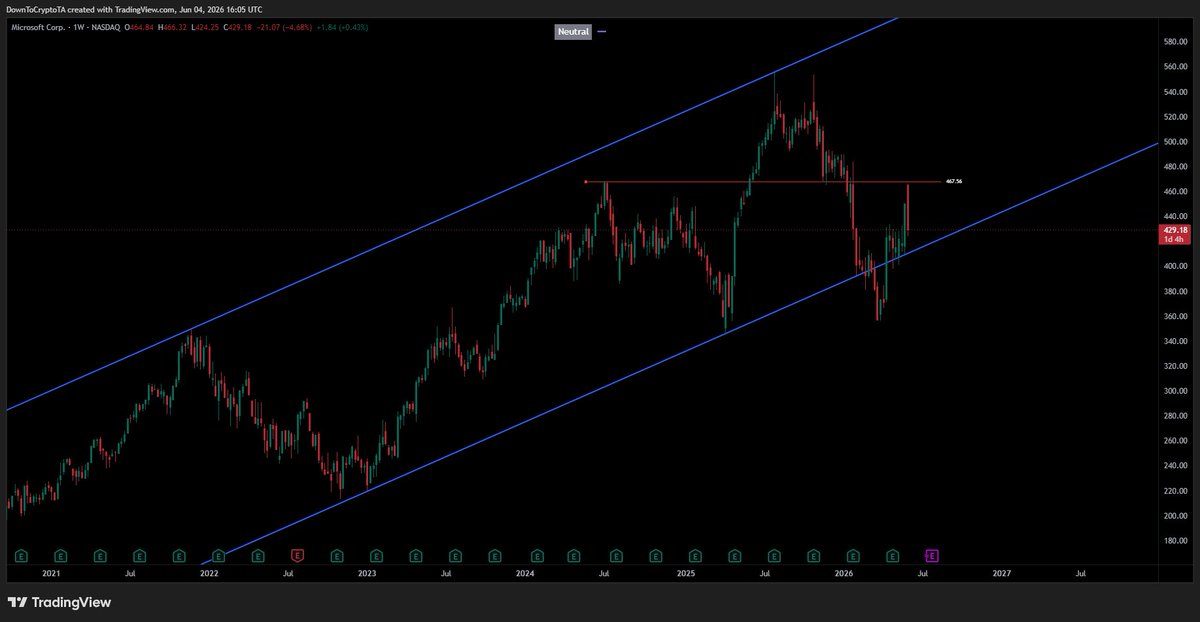
It's been a little while since I last looked at $MSFT on one of my live streams, but the last time I analyzed it, I had drawn a Fibonacci retracement from the major low up to the peak around $445. At that time, I was looking for price to pull back and hold the 0.382 to 0.50 Fibonacci retracement zone as support.
That's exactly what happened. Microsoft found support in that area and produced a solid bounce. Once price reclaimed the channel, it looked like there was a legitimate opportunity for continuation to the upside. However, the rally eventually ran into one of the key levels I was watching—a major pivot and rejection zone around 467.
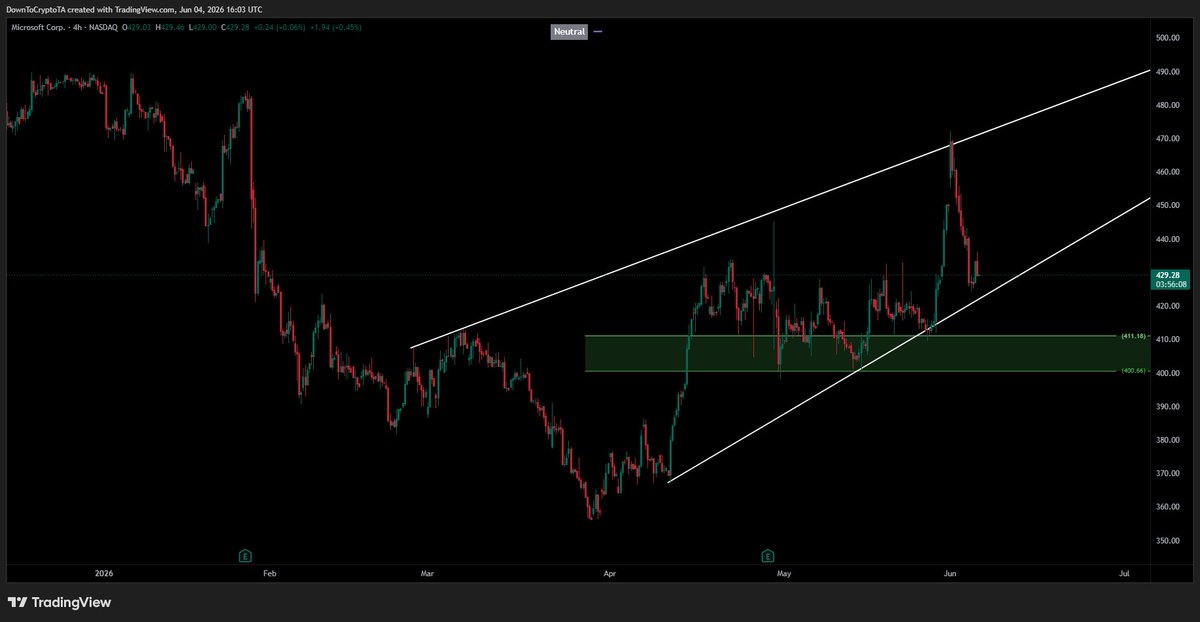
Right now, on the 4-hour timeframe, Microsoft is trading within a rising formation, but the chart doesn't look particularly healthy. In fact, that same $467 area is beginning to resemble the potential right shoulder of a developing head-and-shoulders pattern. The price action feels very sticky here, and momentum appears to be fading.
What concerns me even more is the weekly chart. The weekly candle structure looks rough, and if Microsoft loses its current support area and breaks back below the channel formation, the downside could accelerate quickly.
For now, this is a chart I'll be watching closely. As long as support holds, the bulls still have a chance to regain control. But if the channel fails and sellers push price back below that structure, things could get ugly for Microsoft in a hurry.
1
124
Here's what that short setup would look like if it plays out on $GOOG .
If you look at the upper portion of the 4-hour timeframe, you'll notice a small head-and-shoulders formation that developed. The measured move from that pattern was essentially fulfilled when price declined into the 0.382 Fibonacci retracement level, which is where we're currently seeing buyers step in and produce a bounce.
As price moves higher from here, I'll be paying close attention to the neckline of that head-and-shoulders pattern. Ideally, I would like to see price rally back into that area, get rejected, and fail to reclaim the level. More importantly, I would not want to see price break above the right shoulder, as that would weaken the bearish setup considerably.
If the neckline acts as resistance and the lower-high scenario develops, then the downside targets around the 320 to 308 area remain in play. That would align with the broader bearish structure I'm watching and provide the type of confirmation I'd like to see before becoming more aggressive on the short side.
For now, the bounce off the 0.382 retracement is constructive for the bulls in the near term, but the real test will be whether price can reclaim key resistance levels or if sellers step back in and defend the neckline.

The $GOOG bounce may just be getting started. On the 4-hour timeframe, price has reacted nicely off the 0.382 Fibonacci retracement level, which is generally a bullish development in the short term.
That said, there is still a descending trend line overhead that could act as resistance or break. My preference would be to see Google struggle in this area, fail to take out the recent high, and ultimately put in a lower high before continuing lower.
I have a more attractive entry zone in mind if that scenario plays out. Specifically, I'm watching the ascending trend line below current price as a potential area of interest. If price retraces back toward that trend line, I would be looking for a possible entry with downside targets in the 320 to 308 range.
For now, keep a close eye on this move. It is entirely possible that the current bounce develops into a more meaningful reversal. The 4-hour chart certainly looks constructive from a bullish perspective. However, until resistance is cleared decisively, I'm still hoping to see a rejection that provides an opportunity for an entry at lower levels.

29
The $GOOG bounce may just be getting started. On the 4-hour timeframe, price has reacted nicely off the 0.382 Fibonacci retracement level, which is generally a bullish development in the short term.
That said, there is still a descending trend line overhead that could act as resistance or break. My preference would be to see Google struggle in this area, fail to take out the recent high, and ultimately put in a lower high before continuing lower.
I have a more attractive entry zone in mind if that scenario plays out. Specifically, I'm watching the ascending trend line below current price as a potential area of interest. If price retraces back toward that trend line, I would be looking for a possible entry with downside targets in the 320 to 308 range.
For now, keep a close eye on this move. It is entirely possible that the current bounce develops into a more meaningful reversal. The 4-hour chart certainly looks constructive from a bullish perspective. However, until resistance is cleared decisively, I'm still hoping to see a rejection that provides an opportunity for an entry at lower levels.
70