
Preparing for the next age of Earth | Husband. Engineer. Anxious father. Bad swimmer.
Joined February 2026
- Tweets 616
- Following 163
- Followers 1,611
- Likes 711
115 Photos and videos


48m
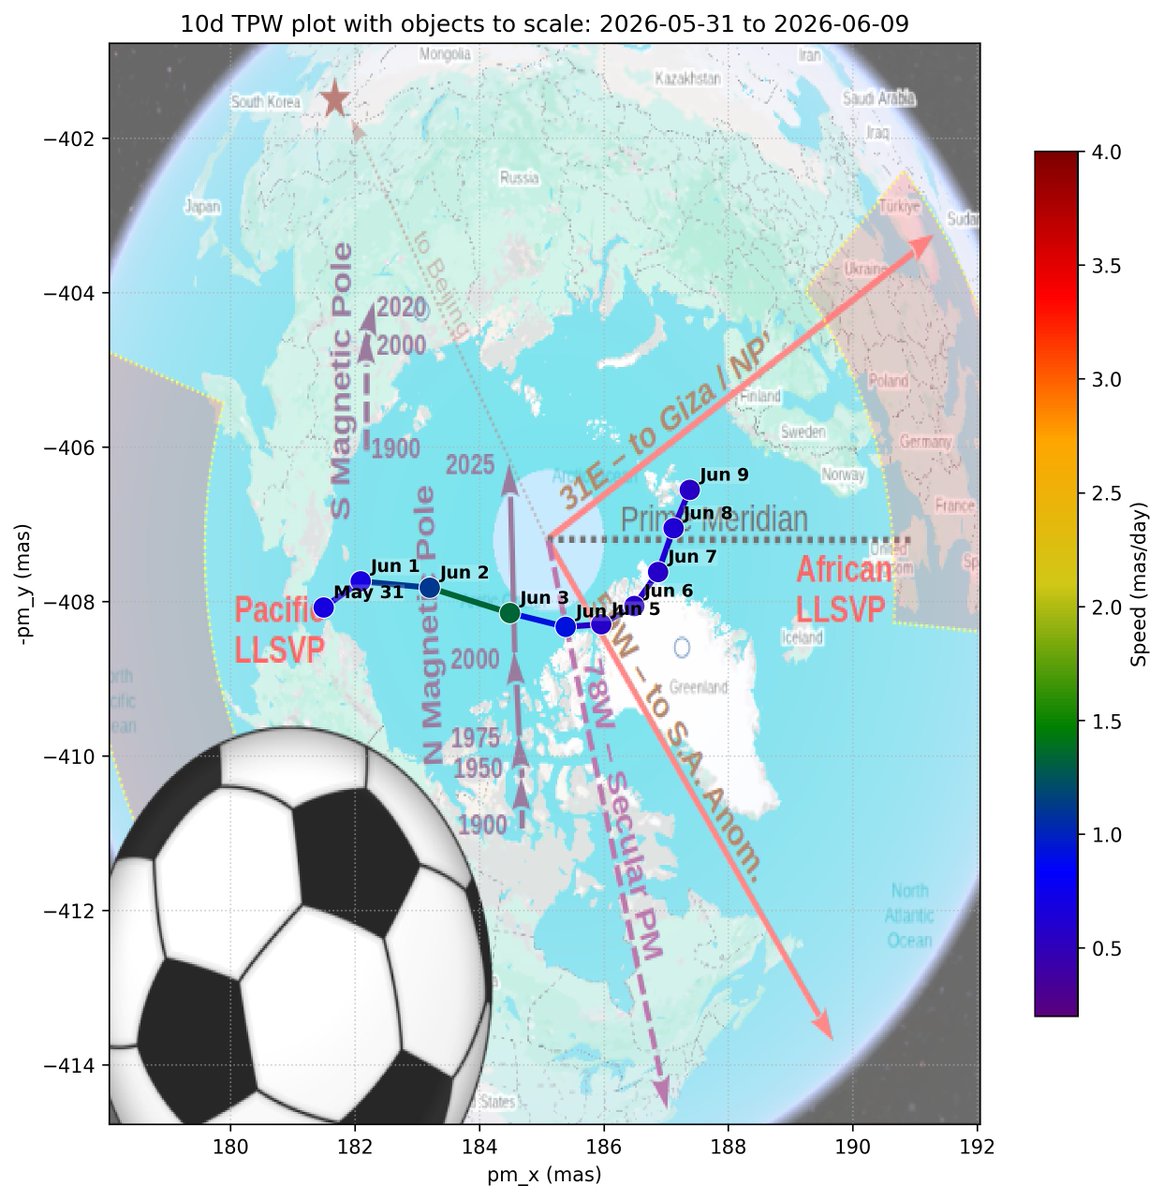
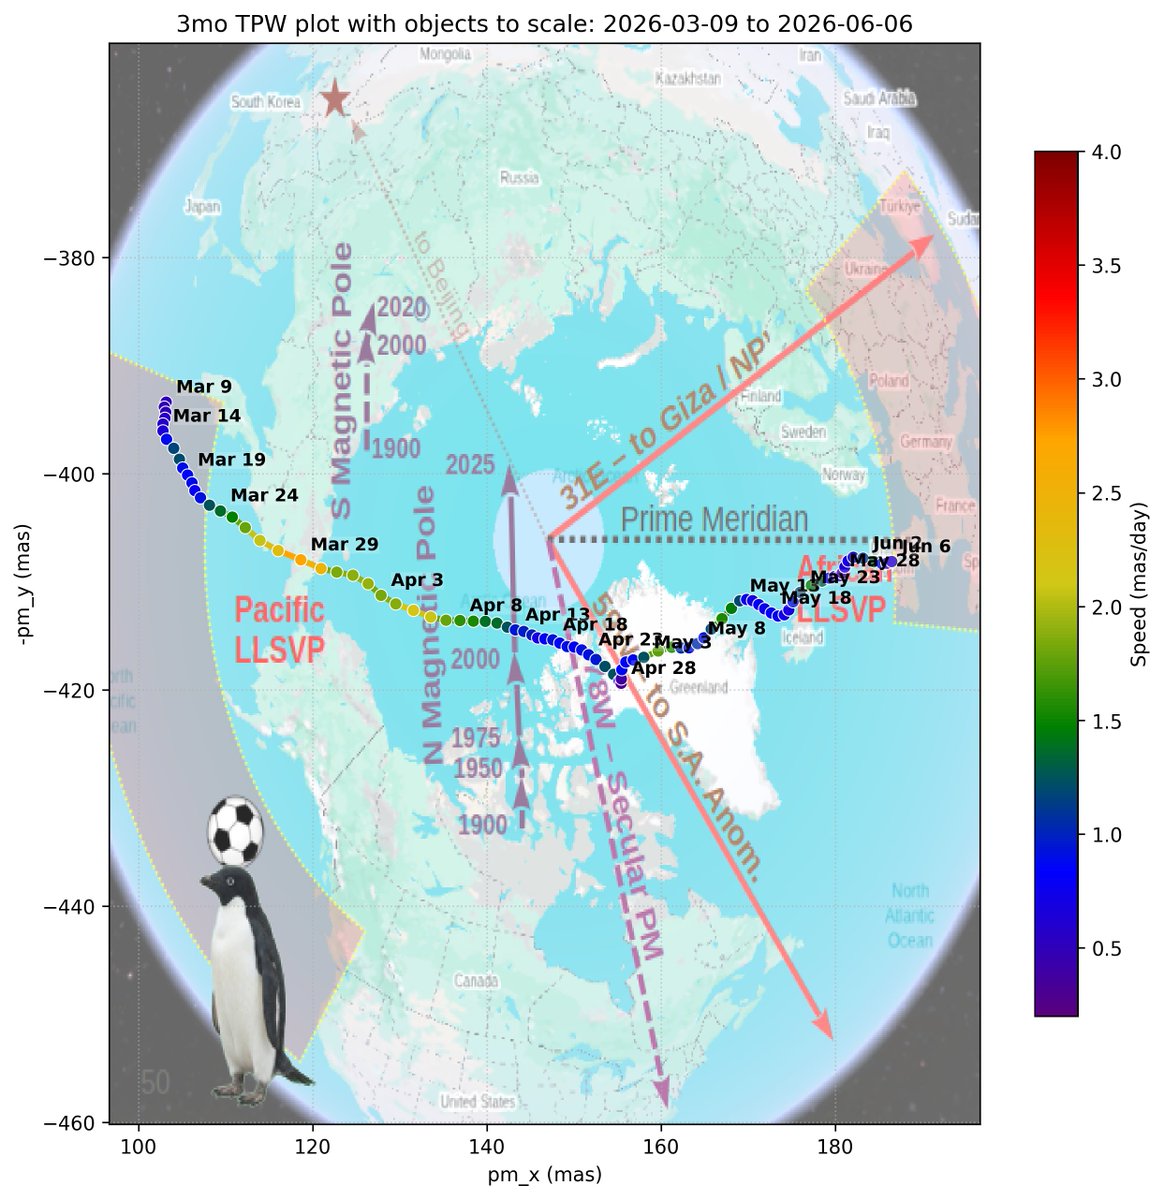
Polar motion charts with data thru June 14 at 10-day, 3-month, and 4-year timescales. Foreground objects (soccer ball, Adelie penguin, pickup) are scaled to the path to show size. The earth (not to scale) background is for orientation, including LLSVPs and select meridians. Daily velocity is color coded per the legend at right.
A primer video on how to read these charts is here: youtube.com/watch?v=8dGFB2Mi…
IERS long-term data, ~week delayed:
datacenter.iers.org/data/lat…
IERS 3-month data, ~day delayed:
datacenter.iers.org/data/lat…
2
4
111
Jun 13
Polar motion charts with data thru Jun 12 at 10-day, 3-month, and 4-year timescales. Foreground objects (soccer ball, Adelie penguin, pickup) are scaled to the path to show size. The earth (not to scale) background is for orientation, including LLSVPs and select meridians. Daily velocity is color coded per the legend at right.
A primer video on how to read these charts is here: youtube.com/watch?v=8dGFB2Mi…
IERS long-term data, ~week delayed:
datacenter.iers.org/data/lat…
IERS 3-month data, ~day delayed:
datacenter.iers.org/data/lat…


3
36
953
Jun 12
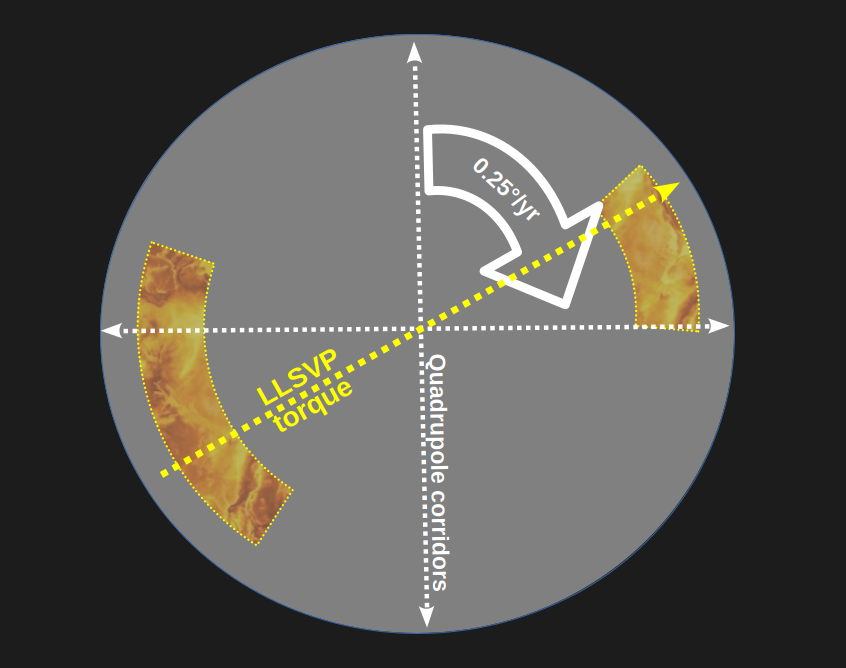
At some point this summer I hope to do a deep dive into plate tectonics and something which is akin to oscillatory crack propagation. This arises when a material breaks more easily in one direction, but the forces which cause cracking are applied in a different direction. The effect is a zig-zag with roughly 90* turns, negotiating between the direction the crack wants to go and the direction it must go.
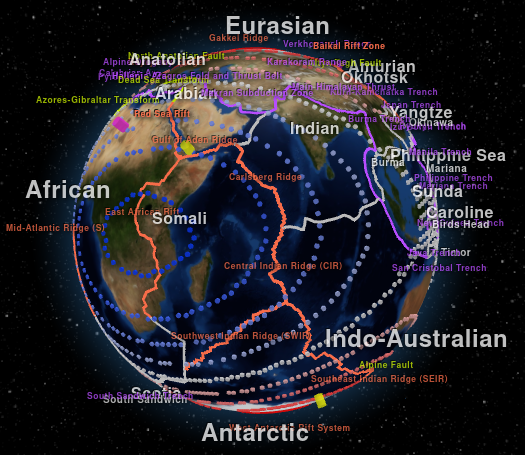
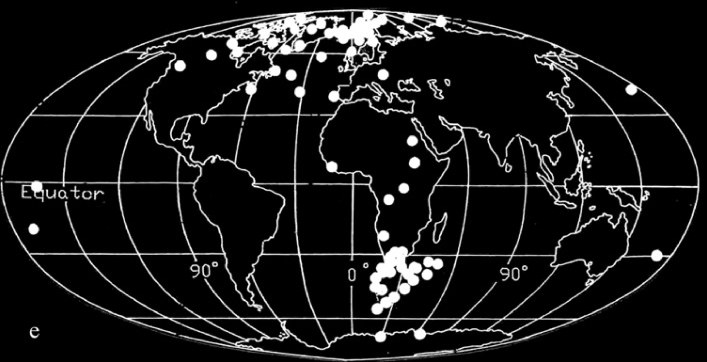
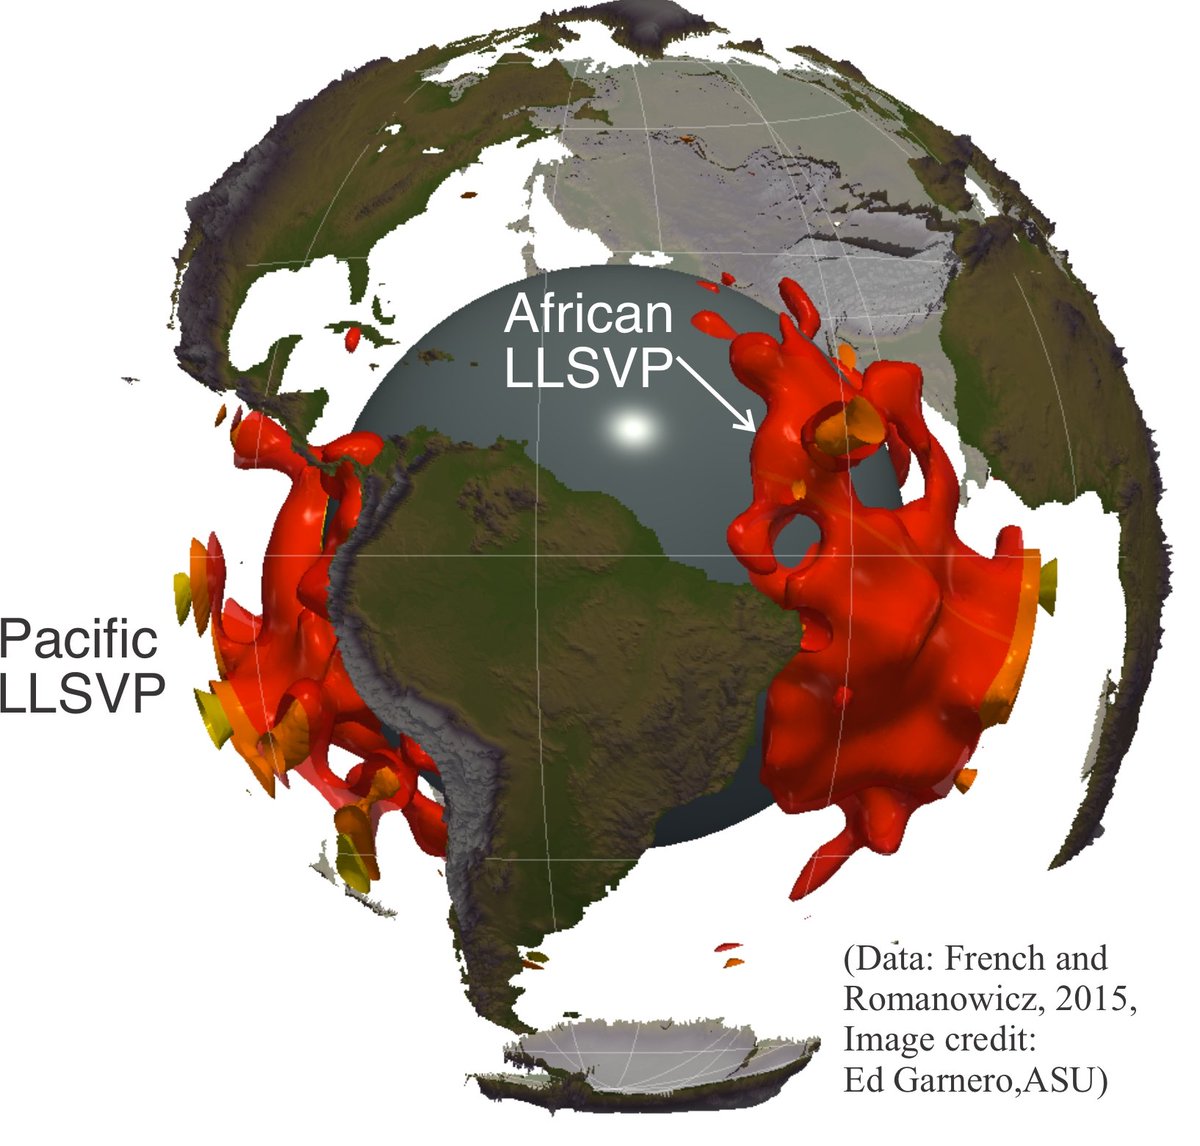
In the case of the earth, the stresses are concentric lines of oblateness differential between S1 and S2, so the stress lines are ellipses. This chart shows contours at 2 miles of vertical elevation 'stress'. Note that the East African Ridge goes right down the center of the 'target'. Further out, oceanic fault lines tend to follow these ellipses until the have to 'break', typically doing so orthogonally at 90 degree angles.
I mention this now because I find it compelling evidence that the Np' 31 E pole location is the one that 'wins' during the majority of ECDO events. I also wonder (and suspect) it contributes to the remarkable Euler-axis centric elevation symmetry @nobulart has found in his fantastic 'Groundtruth' article x.com/nobulart/status/203506…
@stephXskystory @HashZappa

3
15
122
8,757
Jun 11
Some of my followers might be familiar with @RealDutchsinse . He is the earthquake forecasting guy- not in the sense of some spiritual premonition that one is coming, but he observers patterns in their propagation. Deep ones precede shallower ones. There are preferred propagation paths- typically along plate boundaries or along the edge of the NA Craton. These paths have reliable termination points- often the Mid Atlantic Ridge, with a couple odd exceptions like Np' (he does not call it that, in fact I don't think he has ever heard of ECDO. He just notes that there is a termination point near the southern edge of the East African Rift). He also observes that mechanical breakages (fracking) or magnetic sources (power generation) can help channel smaller earthquakes (not cause them, slightly influence WHERE they propagate).
That Np' should be a termination point is curious. And while the whole west coast of the Americas is seismically active, he does observe one location near Bolivia as being a frequent origin point of deeper earthquakes. This is doubly curious.
Np' is the true N Pole best documented under ECDO theory. I believe that the 5ka event made an uncommon 'selection' of ~Bolivia as the N Pole, per this quadrupole article: x.com/EcdoPrep/status/205935…
The time over which the mantle 'forgets' magnetic character is likely on the order of ~10k years. Enough to have some distant memory of the 14ka ECDO event (Np', 31 E) and a more recent memory of the 5ka Bolivia event. That would still give some shape to the magnetic lines and Lorentz forces we see driving things today.
This is a very, very long way of saying that I am ruminating on the idea that we have underestimated the contribution of what you might call 'long term magnetic memory' in both our discussions of earthquake propagation and ECDO dynamics.
Image credit: @RealDutchsinse

14
20
182
11,044
Jun 11
The Dzhavnibekov effect is descriptive of a rigid spinning body where the rotational axis is misaligned with the axis of maximum angular inertia. But how rigid is rigid? I feel there should be something that might be called the "Dzhavnibekov stability criteria", which relates to the ratio of how elastic a body is vs density. Said differently - do small induced perturbations in shape (deformations, additions, etc.) work themselves out via some restoring force faster than they start to kickoff the exponential motion that becomes a flip.
5
3
53
1,767
Jun 10
Polar motion charts with data thru June 9 at 10-day, 3-month, and 4-year timescales. Foreground objects (soccer ball, Adelie penguin, pickup) are scaled to the path to show size. The earth (not to scale) background is for orientation, including LLSVPs and select meridians. Daily velocity is color coded per the legend at right.
A primer video on how to read these charts is here: youtube.com/watch?v=8dGFB2Mi…
IERS long-term data, ~week delayed:
datacenter.iers.org/data/lat…
IERS 3-month data, ~day delayed:
datacenter.iers.org/data/lat…


1
4
53
1,923
Methuselah retweeted

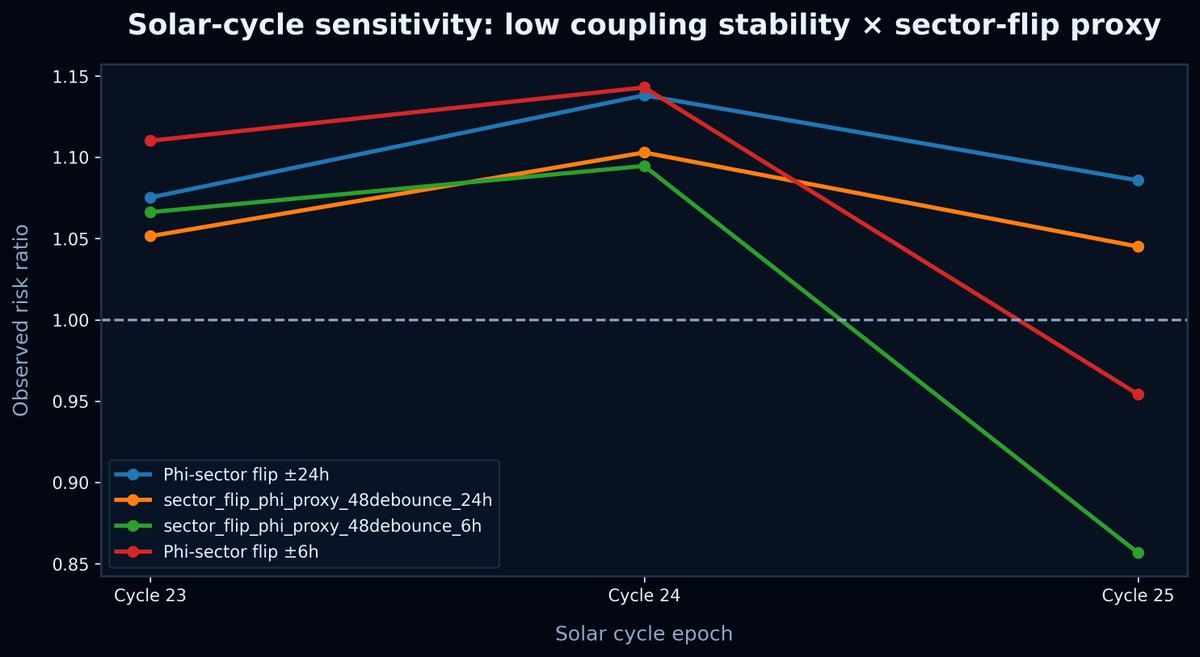
DRIFT × Solar Signal update:
The low-coupling-stability / sector-flip relationship is looking sensitive to the solar cycle.
The strongest enrichment shows up in Cycle 24.
Cycle 25 is lower in the current partial record, but we’re only halfway through the cycle, so I’m not treating that as a completed cycle comparison yet.
For now: the broader ±24h phi-sector window stays above baseline across Cycles 23 to 25, while the tighter ±6h signal does not show the same strength so far in Cycle 25, especially under the stricter 48hr filter.
2
14
797
Jun 8
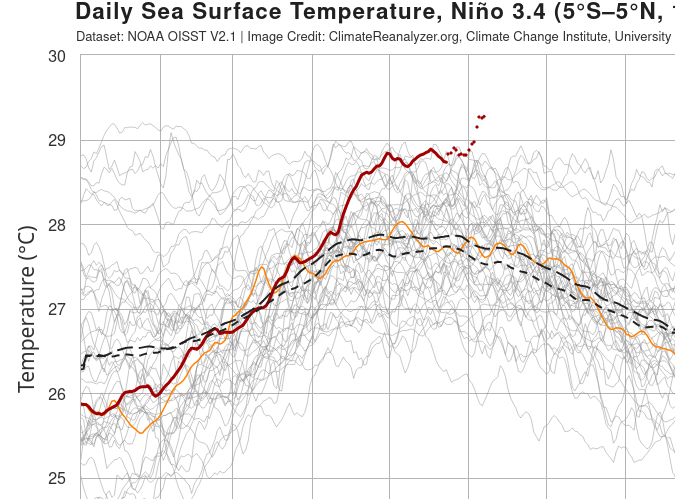
Current equatorial Pacific Sea Surface Temps are starting to show a bit of daylight between today vs any recent year on record. There will be a strong El Nino for sure, but I think we also may be under-appreciating some magnetic contributions to this heating. I hope to dive into more detail in an upcoming article.
Image: climatereanalyzer.org/clim/s…
3
7
67
3,003
Jun 7
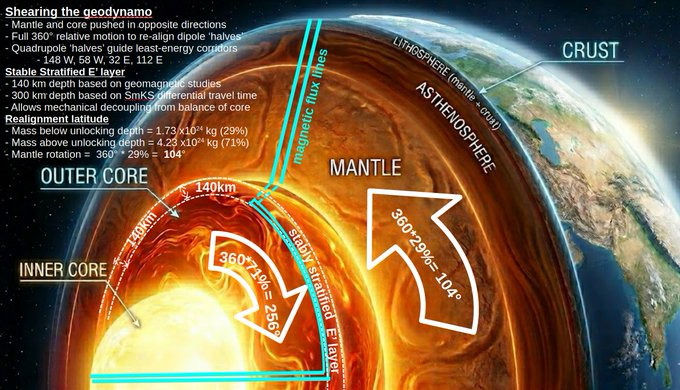
Where does the 104 degree latitudinal displacement observed in an ECDO event come from? From the relative masses above and below where the outer core is sheared.
Why there? Because the outer core shows stable stratification, and the Lortentz forces are too strong to shear the balance of it. nature.com/articles/nature13…
71% of earth's mass is above this level.
29% is below.
Equal but opposite magnetic forces push during the climax of the Dzhanibekov flip.
Mantle crust rotate 360*29%=104 degrees.
6
33
193
6,457
Jun 7
Permafrost thawing is "70 years ahead of schedule" [1]. But not all regions seem to be similarly affected. Which permafrost regions are de-frosting the fastest?
- The Yamal–Gydan Peninsula Anomaly. Large Giant Emission Craters have formed here [2], despite their absence in climatically similar regions of Canada, Alaska, and Siberia.
- The Batagaika Megaslump — Northeastern Yakutia- the largest known thaw slump on earth. It began in the 1980s.
- The Eastern Siberian Arctic- is subsiding at twice the rate of similar regions. [3]
What do these regions have in common? They sit atop comparably conductive materials in a region of the earth undergoing the quickest change in magnetic field orientation over the past century. I think we are seeing the signature of inductive heating.
- Yamal–Gydan: sits above the W. Siberian sedimentary basin with conductive, saline brine.
- Batagaika / Yana Upland: sits on the Verkhoyansk fold belt with graphitic metasediments
- East Siberian Arctic: highly conductive Laptev shelf sediments.
4
4
70
2,662
Jun 7
[1] theguardian.com/environment/…
[2] sciencedirect.com/science/ar…
[3] iopscience.iop.org/article/1…
5
449
Jun 6
Polar motion charts with data thru Jun 6 at 10-day, 3-month, and 4-year timescales. Foreground objects (soccer ball, Adelie penguin, pickup) are scaled to the path to show size. The earth (not to scale) background is for orientation, including LLSVPs and select meridians. Daily velocity is color coded per the legend at right.
A primer video on how to read these charts is here: youtube.com/watch?v=8dGFB2Mi…
IERS long-term data, ~week delayed:
datacenter.iers.org/data/lat…
IERS 3-month data, ~day delayed:
datacenter.iers.org/data/lat…

2
7
48
2,168
Jun 6
"In 10 years, the BMW's, Mercedes, and Vaction Homes will all be gone - but their souls will still be filled with the filth accumulated in subservience to the Empire and Party." Loosh destroys the soul of those who pursue it.

Delta killed a lot of people in the first year after the vaccine, yes. Vaccine had zero impact to speak of.
- what the CDC (and 5 hospital networks they assessed) did was take the MCoD assignments to Covid and (by license, with MCoD) assume that these were the unvaccinated - along with any 'unknown' status, and that is how they boosted the "only the unvaccinated are dying" illusion.
Now we have 2,000 people per week dying to the excess - with no Covid to speak of... and it is a direct result of the vaccine and the maliciousness of these people.
Now pharma is paying specific actors to attack and censor those who derive this from the data. The class action lawsuits cannot come fast enough.
They won't be able to reclaim all the Blood-BMS's and Vacation Homes of these pharma agents - but they have forever lost credibility.
In 10 years, the BMW's, Mercedes, and Vaction Homes will all be gone - but their souls will still be filled with the filth accumulated in subservience to the Empire and Party.
1
7
407
Jun 5
"Principal component analysis of the 2010 reversal of core-surface flow beneath the Pacific Ocean" nora.nerc.ac.uk/id/eprint/54…
I've been thinking about this paper a bit. It documents a brief reversal in the slow westward drift of the outer core material starting in ~2010 reducing in ~2020. Typically the drift is westward, but near the central pacific that reversed for a bit.
To tie it to ECDO is speculative, but if we entertain that speculation, I think the result is encouraging. The area where the flow reversed is near 148 W - the antipode of 31 E and the least-favored magnetic corridor given by the quadrupole. As the LLSVPs are trying to push the mantle toward a reorientation toward ~31 E, a quickening of the alignment of the ~32 E magnetic corridor may argue of a 'slowing' of the alignment on the opposite side per conservation of momentum.
But the key thing here is that the effect seems to be lessening since ~2020. It is as if we tested the corridor briefly, but the LLSVP torque was insufficient to overcome the current magnetic regime. For people as paranoid and anxious as me, this helps me sleep better at night.
5
37
3,080
Methuselah retweeted
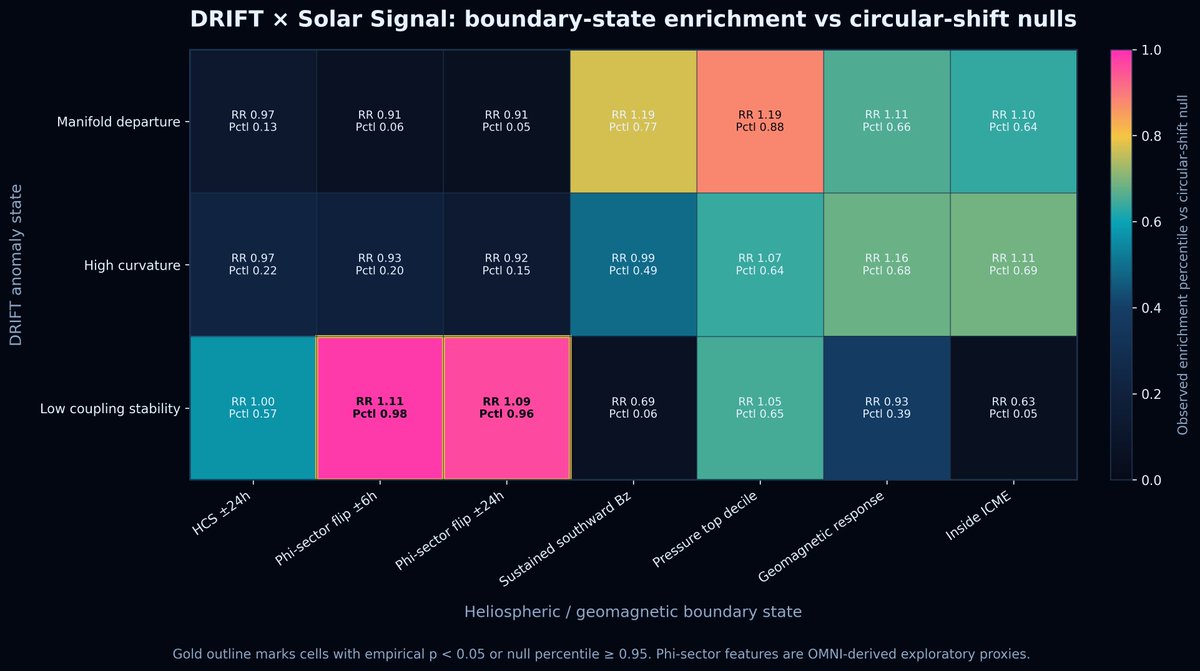
I’ve been building a first-pass analysis I’m calling DRIFT × Solar Signal.
DRIFT is Craig Stone’s (@nobulart) polar-motion diagnostic framework. I’m adding a Solar Signal layer: heliospheric boundary geometry, IMF sector changes, southward Bz, pressure enhancements, geomagnetic response, and ICME context.
The basic question:
Do unusual polar-motion diagnostics cluster near solar/heliospheric boundary states?
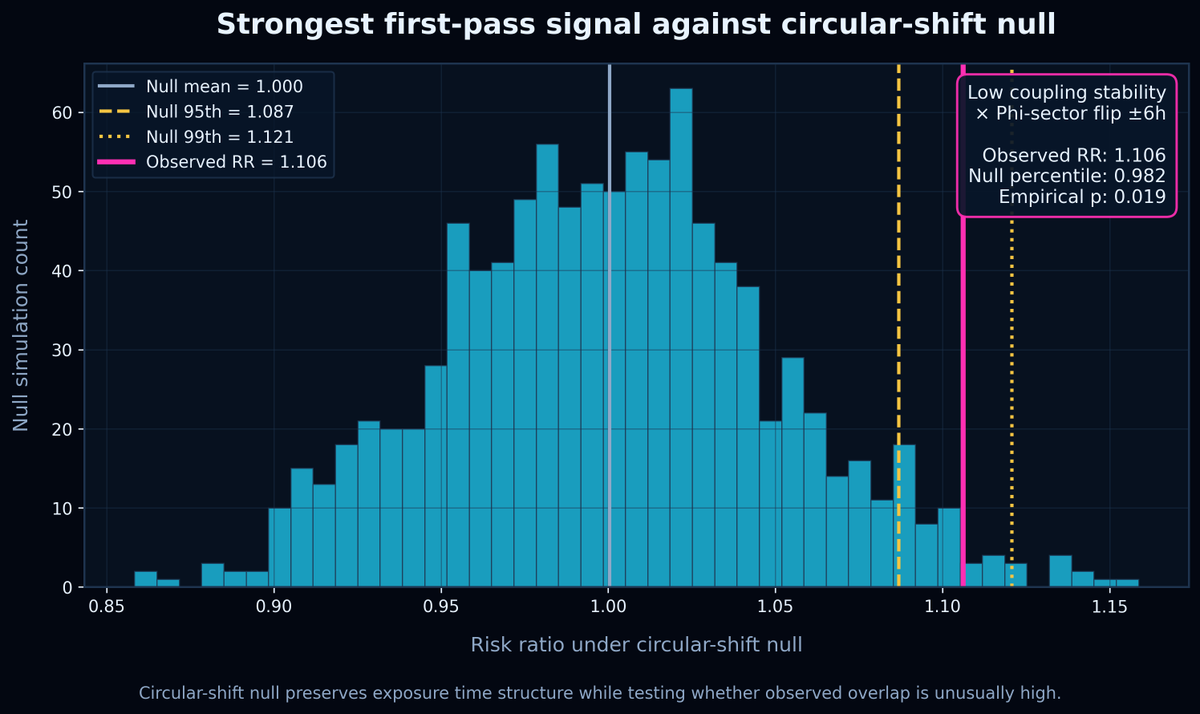
First result: Low DRIFT coupling-stability states showed enrichment near an OMNI-derived IMF phi-sector flip proxy.
Observed risk ratio: 1.106
Circular-shift null percentile: 0.982
Empirical p: 0.019
This means this specific DRIFT instability metric appeared near short-window sector-flip geometry more often than expected under randomized time-shift tests.
This is still exploratory and needs sensitivity testing. But, I ultimately want to know: when Earth-system diagnostics shift, where was Earth positioned inside the field geometry?
Method note: DRIFT diagnostics from @nobulart’s DRIFT framework; Solar Signal boundary-state layer and null testing are my extension.
8
9
45
3,659
Jun 4
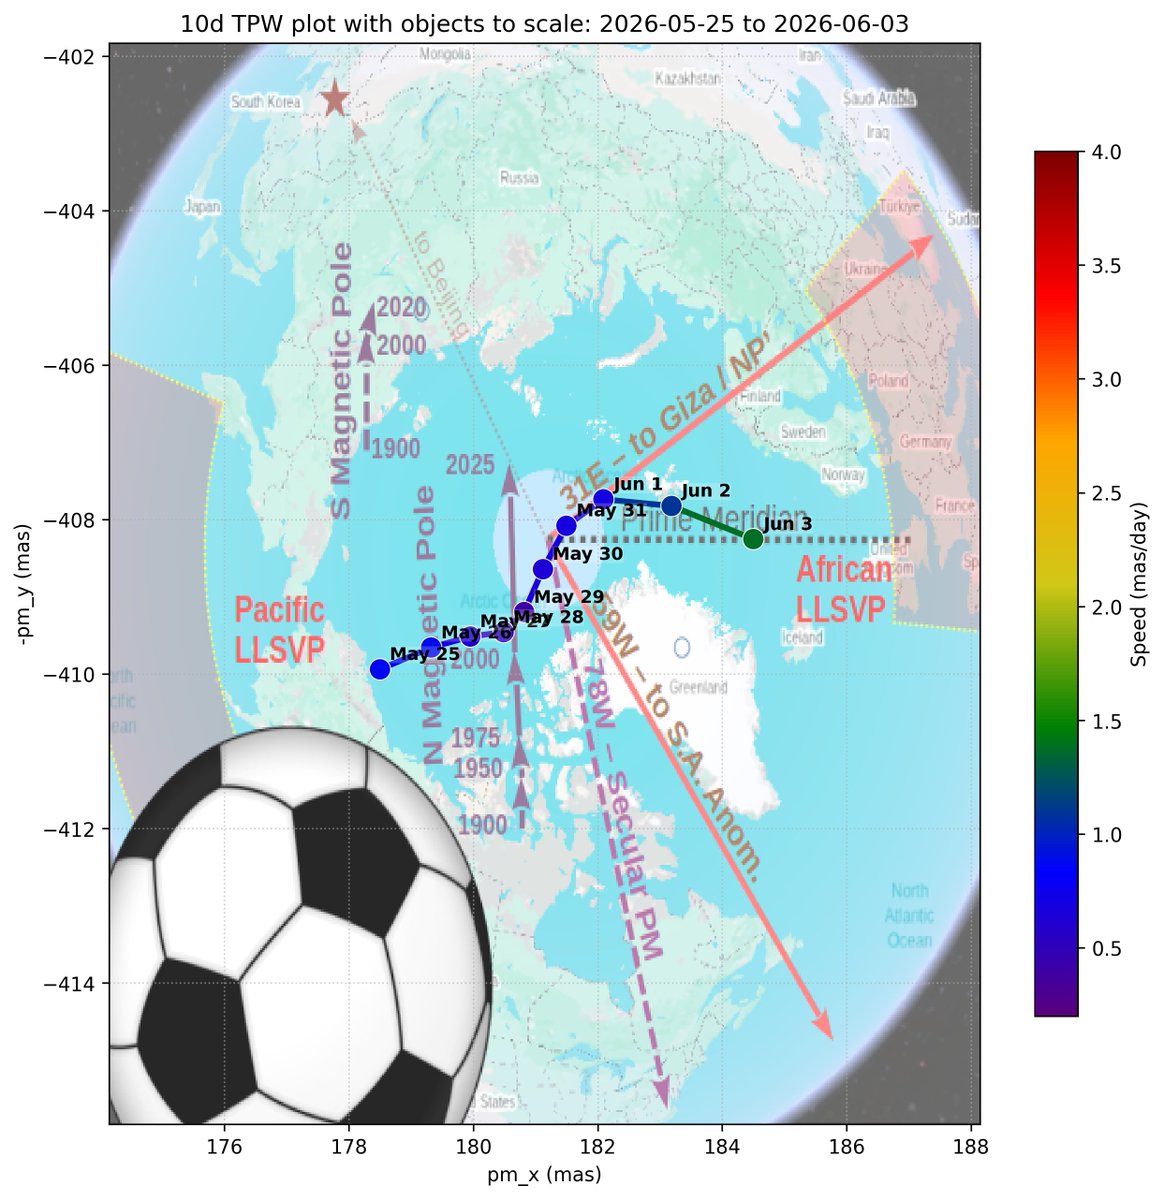
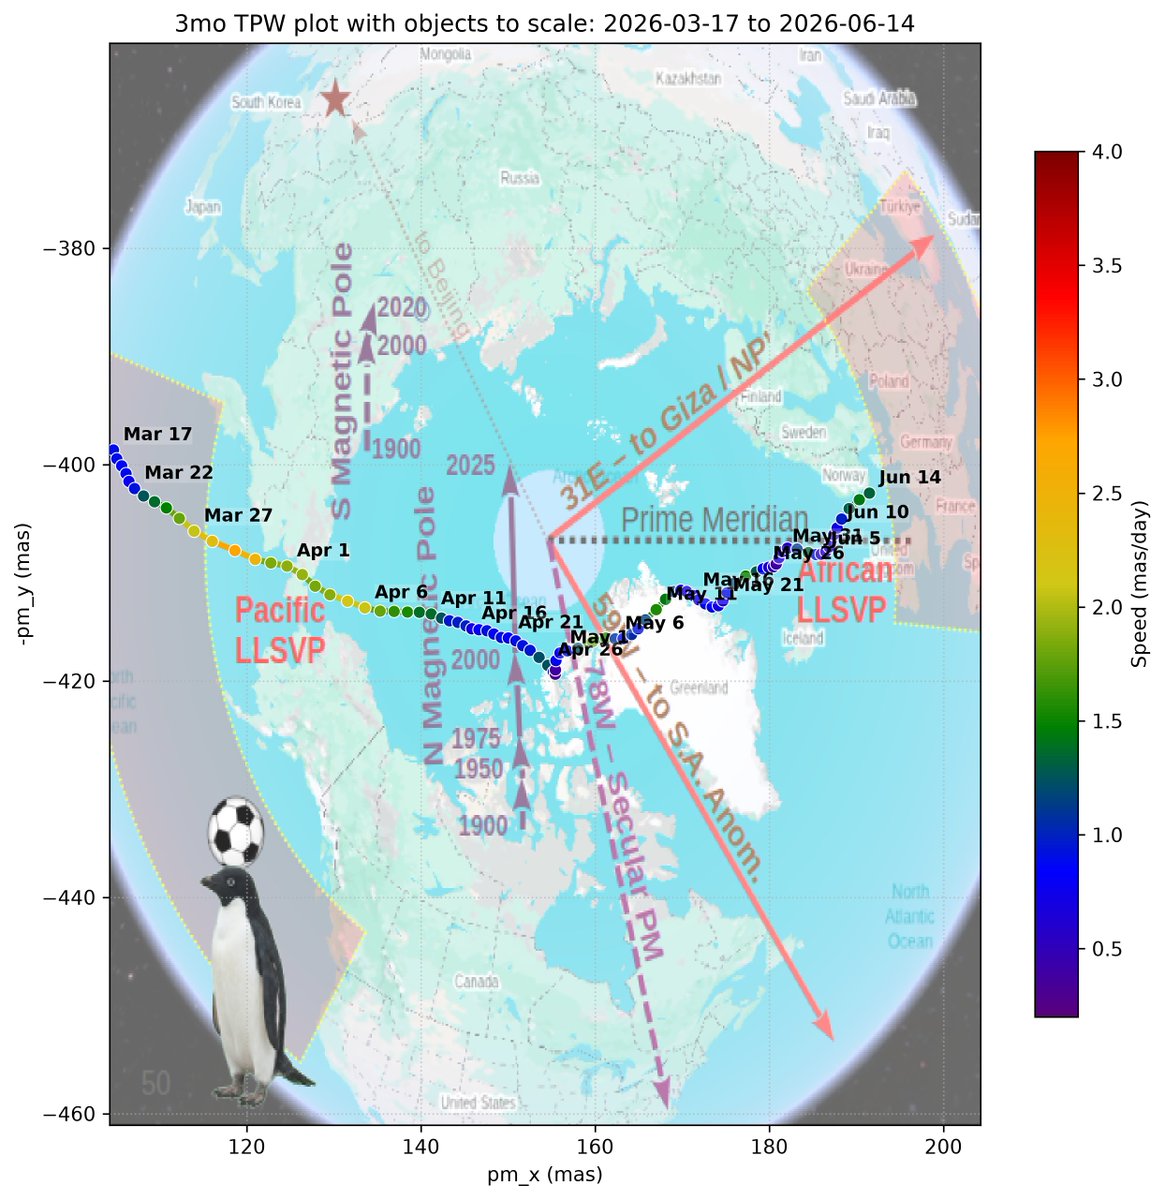
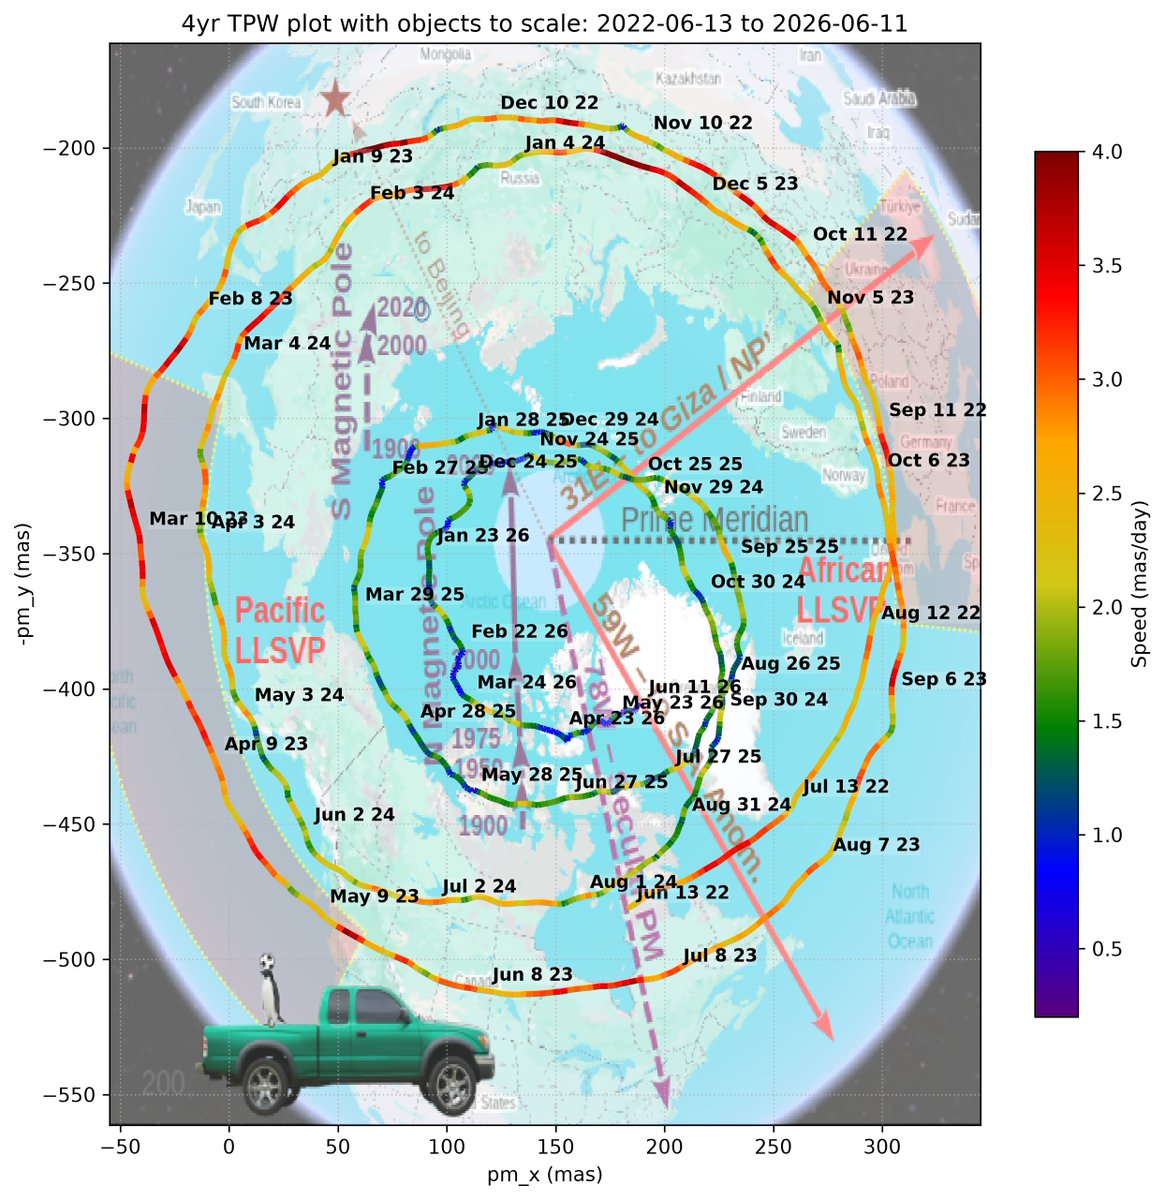
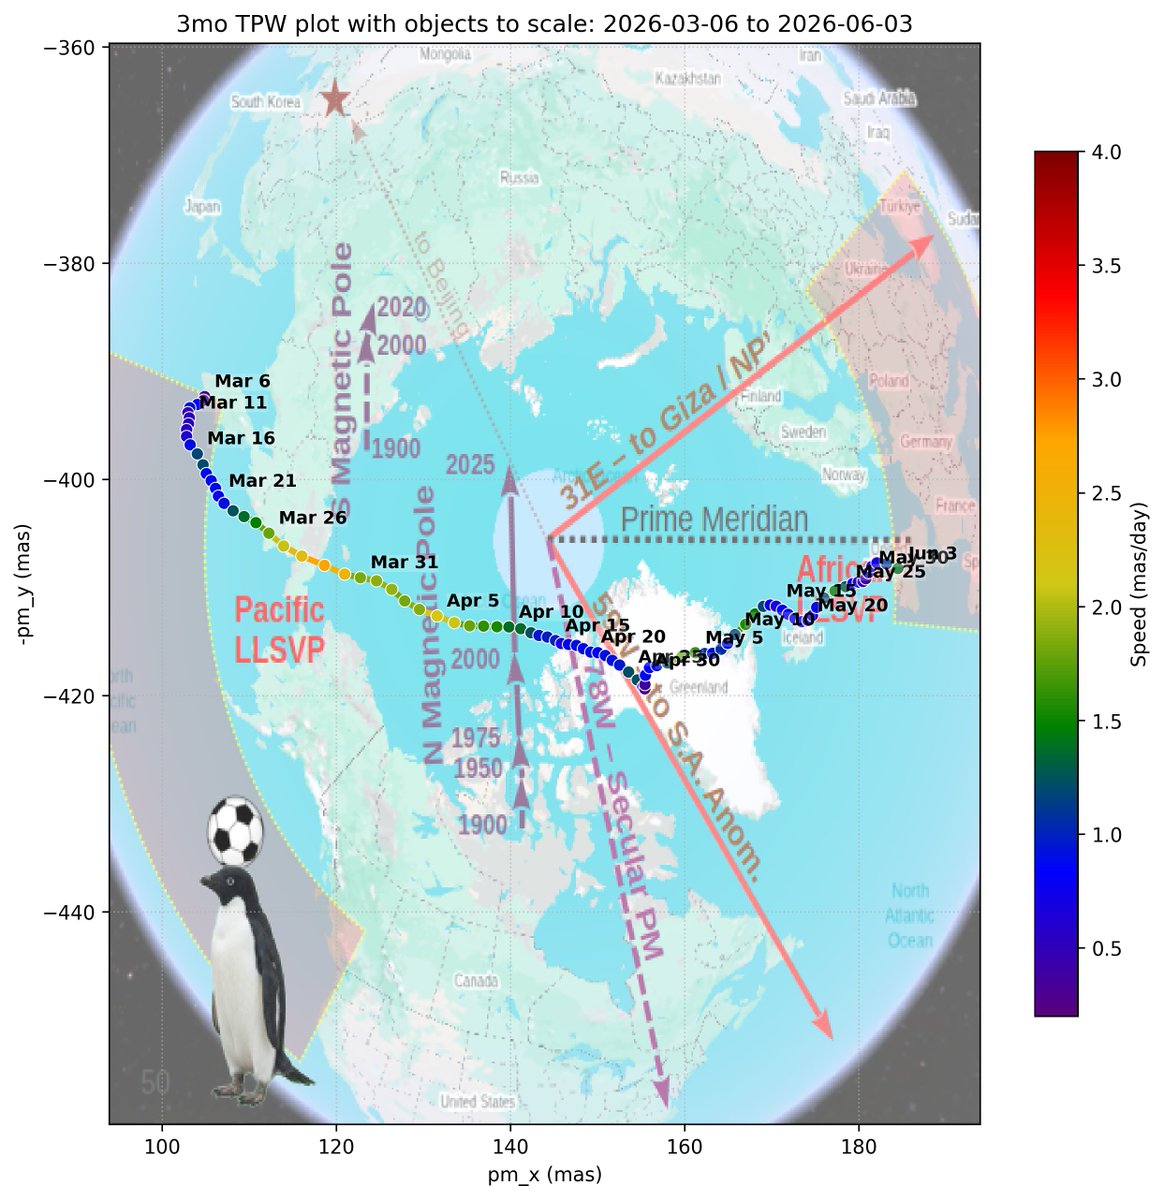
Polar motion charts with data thru Jun 3 at 10-day, 3-month, and 4-year timescales. Foreground objects (soccer ball, Adelie penguin, pickup) are scaled to the path to show size. The earth (not to scale) background is for orientation, including LLSVPs and select meridians. Daily velocity is color coded per the legend at right.
A primer video on how to read these charts is here: youtube.com/watch?v=8dGFB2Mi…
IERS long-term data, ~week delayed:
datacenter.iers.org/data/lat…
IERS 3-month data, ~day delayed:
datacenter.iers.org/data/lat…

1
35
1,241