
Économiste, gestionnaire, cycliste, observateur intéressé de tout ce qui est politico-économique
Joined April 2009
- Tweets 4,427
- Following 747
- Followers 227
- Likes 2,204
276 Photos and videos


Jean-Denis Fréchette retweeted

Jun 12
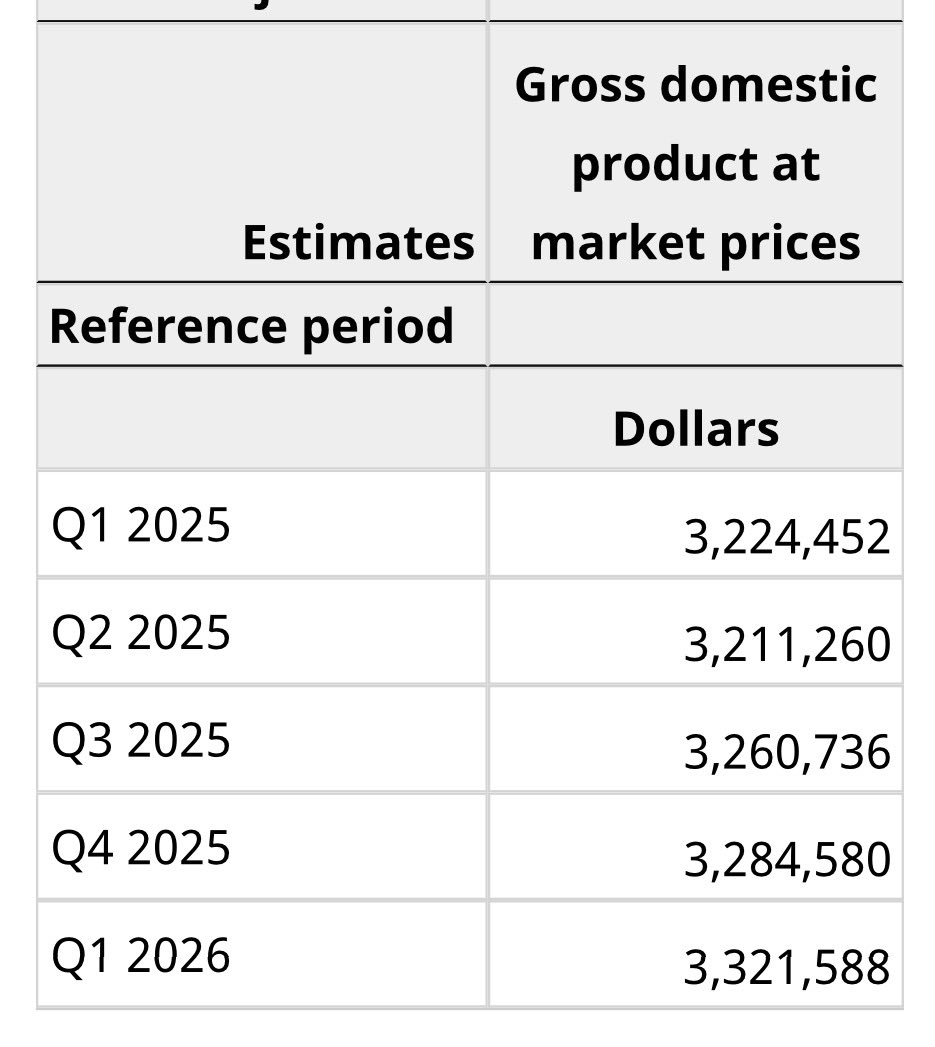
Canadian nominal GDP in CAD terms is about $3.32 trillion as of last quarter.
Thats more than $200 billion higher at current exchange rates than $2.2T USD.
Please do math.
#cdnpoli
Jun 12

SpaceX is now valued at $2.2 trillion, worth more than all of Canada.
SpaceX went public today, immediately surging 22% as the largest IPO in history — The Globe and Mail

11
32
112
11,064

Le bénéfice de @LaSAQ_officiel est en baisse, tout comme son service à la clientèle et sa récente politique de retour de produits défectueux, son jupon monopolistique dépasse.
18
Jean-Denis Fréchette retweeted

I keep insisting it's important to not interpret the recent reduction in the trend growth rate for a recession, and here's why: I remember what happened the last time we made that mistake.
It took us 20 years to recover, I don't want Canada to relive that lost generation.
1/5
11
9
45
16,331
Je valide que les prévisions économiques et/ou météorologiques de @MarcLevesqueEco sont d’une justesse redoutable: il avait prévu exactement la météo du Grand Prix de F1 de Montréal. Une chance, le spectacle était au rdv.
1
1
260
Jean-Denis Fréchette retweeted

May 11
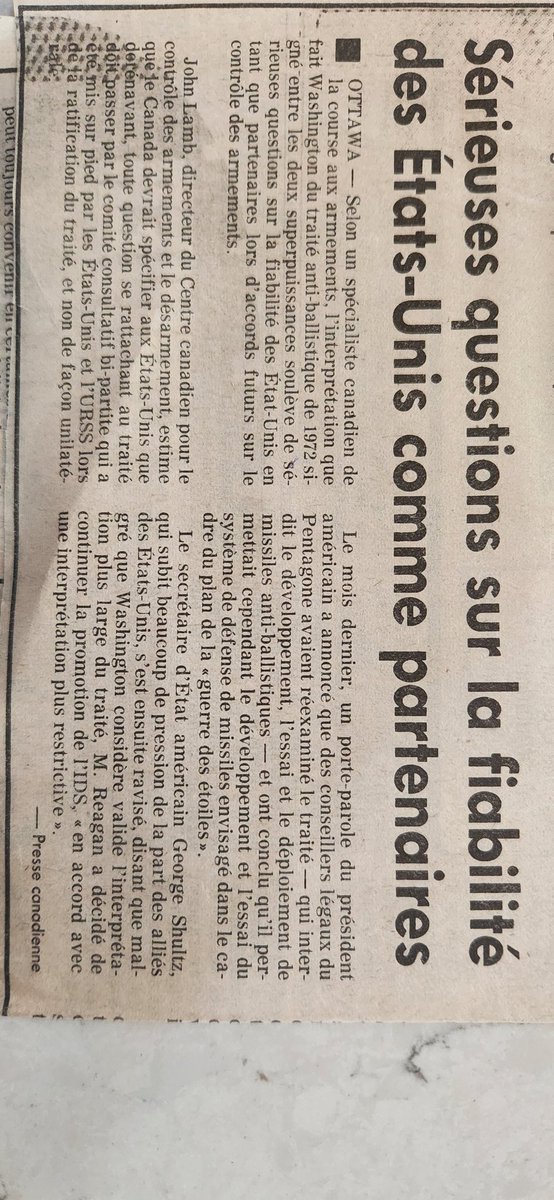
Face à l’Iran, les États Unis sont dans une impasse. Ils vont payer le prix de leur aventurisme que ce soit après une reprise des combats ou par la signature d’un mauvais accord, les deux pouvant d’ailleurs se conjuguer. Le plus étrange est que ce résultat était prévisible.
14
123
548
23,494
Réflexion du jour: je me demande pourquoi le Pape ne profiterait pas de son 45 minutes d’audience pour excommunier Marco, live sur YouTube, me semble que ça serait satisfaisant.
1
5
247
Jean-Denis Fréchette retweeted
When I worked at the Library of Parliament, I was sad to learn that the Librarian didn't use the sword to go after those with overdue books. Shame really.

This uniform showcases early 20th-century ceremonial style.
Worn by Joseph de la Broquerie Taché, it features a wool and silk tunic, a feathered bonnet and a sword. 🪶
Learn more: ow.ly/O0CY50YLjEB

ALT A black tunic and trouser set with gold detailing.

ALT A bonnet with synthetic feathers.

ALT A sword made of silver with a gold handle and golden tassel.
3
5
37
3,400
Ce syndrome se nomme Dunning-Kruger Effect….il y a bcp de gens dans tous les domaines, mais notamment en politique, qui l’ont contracté. J’en ai rencontré plusieurs. @MarcLevesqueEco @rstjac1032
Apr 25

What is most shocking about all of this is that a very large number of people are exceedingly confident in their understanding of something that they never bothered reading even slightly about.
They did not study the topic, they do not work in the field, they don't even do it as a hobby, but they legitimately believe that they somehow see something that all of us are missing.
Then, if you try to explain to them that they aren't quite applying the ideas they are trying to apply correctly, that there's legitimately something wrong about their views, that's arrogance...
I have seen the comments some people left you today. The level of arrogance is absolutely staggering and impossibly ironic given that they, themselves, call other people arrogant.
1
1
3
708
Jean-Denis Fréchette retweeted

Apr 25
Une belle vulgarisation. Faudrait que quelqu'un l'explique encore plus simplement à Poilievre.
Apr 24
Let me clatify this problem for everyone.
MV = PY is an identity. It simply states that you need enough money to cover all transactions. The theory is about how you think money M, velocity V, prices P, and output Y interact.
The intuition behind monetarism is often conveyed to undergraduates by saying that if you hold V and Y constant, then changes in M will be reflected in changes in P. That is the simplest way to say that printing money causes inflation. The problem is that this isn't the actual theory and it glances over important nuances.
For starters, in the theory behind all of this, 1/V is money demand and that thing varies over time. The grown-up version of V is constant is V is covariance stationary meaning that it fluctuates around a stable mean. That is precisely what people debated in the 80s and 90s, and more recently in the 2010s using a different way to measure money in the US (specifically, the latter research used Divisia indexes).
One reason this matters is that if money demand and money supply both increase, M rises and V falls, so there need not be a rise in prices. Intuitively, people have to use the money to bid up prices. Nothing happens if everyone sits on it.
The other reason this is important is the nature of the signal you get from variations in M to predict variations in P. What theory gives you is a long-run relationship between M, P, and Y: if V fluctuates around a stable mean, then M, P, and Y have to "grow together" and, if they break apart too much, they get pulled back in. The technical term is that M, P, and Y share a stochastic trend -- they are cointegrated. So, what the theory buys you is what we call an "error correction" mechanism that keeps everything together over long periods of time. It's not nothing. To first order and with some assumptions, it says that 2% inflation and 2% real GDP growth requires 4% money growth over the long-run. But it's not clear that it's a great signal to forecast inflation -- other things besides monetary policy moves stuff in that equation.
Now, back to policy. Monetary policy in Canada only engaged in quantitative easing during the pandemic. Otherwise, the Bank of Canada usually works by setting a short term interest rate, not by targetting changes in the money supply. So, it's hard to measure those things just for Canada, but one can try.
To do it, you have to ask yourself what happened between March 2020 and the peak of inflation in June 2022 (healine CPI peaked there year-over-year). Can you really attribute all or even most of this to unconventional monetary policy? Because there were massive fiscal expansions in both Canada and the US, lockdowns and subsequent easing of punlic health policy, disruptions in shipping, energy and commodity markets, and the Canadian labor market was extraordinarily tight for a while... Where does any of this figure in your analysis?
I am working on a project specifically on that inflation episode for the US and Canada using a model estimated before the pandemic (partly to see if "old" explanations are enough). I don't explicitly treat unconventonal monetary policy like QE and FG, but it would probably show up as demand shocks in my model. And I also have some policy counterfactuals to think about the cost of moving to hike rates earlier when inflation started rising. I'll be sharing preliminary results in two weeks at the SCSE conference in Quebec City. Feel free to follow my work and take a look later this year when we have a full working paper ready.
1
1
224
Jean-Denis Fréchette retweeted

Apr 17
On this day in Canadian parliamentary history - April 17, 1982: Her Majesty signs something on Parliament Hill.
Also, and perhaps relatedly, Happy Birthday to the Canadian Charter of Rights and Freedoms! 🎂 :p

1
3
22
695
Bon enfin, quelque chose à se mettre sous la dent pour la nouvelle @DPB_PBO
GOUVERNEMENT CARNEY - Une mise à jour économique présentée le 28 avril #lapresseplus plus.lapresse.ca/screens/1a1…
1
16
Avec l'abandon de la taxe d'accise sur l'essence, le PM a revêtu son power suit de politicien, ses habits d'économiste viennent d'être rangés pour de bon.
2
3
5
1,286
« Gouverner, ce n’est pas seulement dire ce qu’on va faire. C’est faire ce qu’on a dit. » Très fort, malheureusement au Québec le verbe “faire” reste une affaire vide.
@AlainRayes
ALAIN RAYES - L’écart entre dire et faire #lapresseplus plus.lapresse.ca/screens/dea…
1
31
"Le ton compte", même la BduD adhère à mon motto: "les mots comptent, les chiffres parlent". @DPB_PBO
devrait s'en inspirer dans ses interventions.
banqueducanada.ca/2026/04/ar…
1
42
Jean-Denis Fréchette retweeted
More on the story re historic Canadian Senate debates not being available in French (article en français)
francopresse.ca/francophonie…
3
5
1,201
Jean-Denis Fréchette retweeted

Mar 26
If there is precisely one thing you watch today, make it this. French Senator Claude Malhuret. A microphone. And the most magnificently savage dismantling of the Trump administration ever delivered in a language they almost certainly don’t speak.
He covers Iran. He covers corruption. He covers the kind of staggering, industrial-scale incompetence that would get you fired from managing a car park. And he does it with the calm, unhurried certainty of a man who has read every page of the indictment and found it, if anything, worse than expected.
France has never pretended to like these people. But this is contempt elevated to an art form. The kind of refined, aristocratic disdain that takes centuries of civilization to produce and approximately ninety seconds to deploy.
Malhuret sounds like he is four seconds from the button. Not out of panic. Out of sheer, exhausted disgust.
Honestly? Understandable.
Watch it. Share it. The adults are speaking.
Gandalv / @Microinteracti1
432
10,277
24,226
696,615
Comme les USA n’ont besoin de rien du Canada…
La fermeture du détroit d’Ormuz prive le marché américain d’une partie de son approvisionnement en aluminium primaire qui vient du Qatar et de Bahreïn et fait grimper en flèche le prix du métal gris (LaPresse)
56
Un article non seulement étrange, mais construit autour de concepts disparates. Je me demande pourquoi les commentateurs/ analystes ne se penchent pas sur la machinerie gouvernementale du BCP qui est la vraie source de cette « indolence ».

C’est un article étrange. Elle a tout à fait raison qu’il est inacceptable que Carney n’ait pas nommé un DPB plus rapidement. Mais une nomination est maintenant en cours et la candidate semble être un excellent choix. Problème réglé.🤷
2
53
Hé Vailles, je ne suis pas inactif tsé…
“la proportion des personnes de 65 ans et plus et des jeunes de 0-14 ans divisée par celle des 15-64 ans, donc les « inactifs » …si l’on peut dire.”
Le taut de dépendance du Québec augmente #lapresseplus plus.lapresse.ca/screens/65c…
42
Les commentateurs sur la saga @PBO_DPB ont un sérieux angle mort: les incidences de la frivolité de gestion du @pco_bcp sur les xn--employs-gya.es actuels et futurs du BDPB et la pression induite sur la réputation et la charge mentale du futur DPB
#cdnpoli
1
5
530