
Matt Allington is a professional Power BI consultant, trainer and Microsoft MVP. Author of books that will teach you DAX. Expert in Power BI and Power Query.
Joined April 2015
- Tweets 1,956
- Following 184
- Followers 8,743
- Likes 2,250
449 Photos and videos
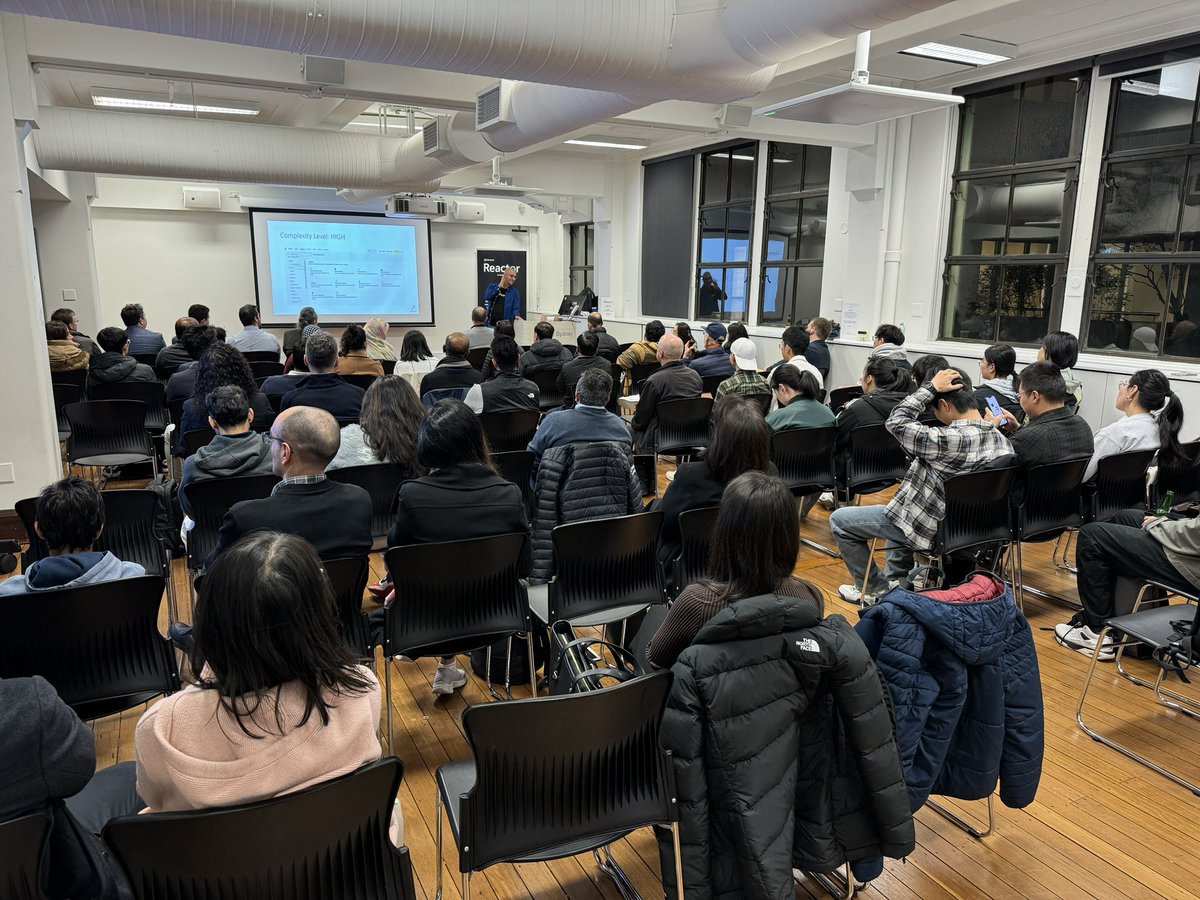


9 Apr 2024
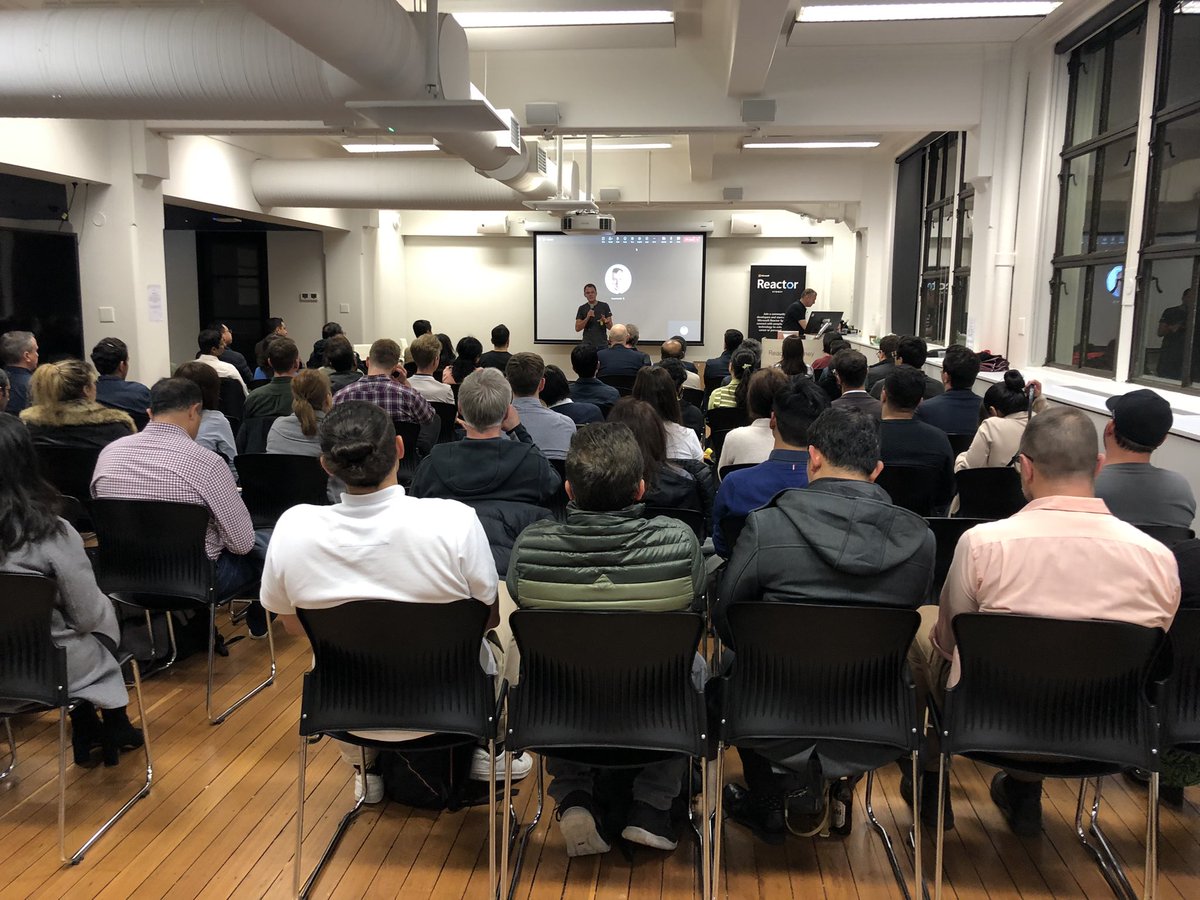
Fabulous Five about to present to the Power BI User group here in Sydney.
3
1
17
1,765
9 Apr 2024
I’m looking forward to having @PhilSeamark and @patrickdba et al from the Power BI CAT team at the Sydney Power BI User Group tonight. Hope to see some Sydneysiders there. meetup.com/sydney-power-bi-u…
1
1
2
1,264
Matt Allington retweeted

1 Mar 2024
We love hearing things like this from our students! 🤩
That's why we're committed to being the best learning resources for #BusinessIntelligence and #DataAnalytics, created by the best instructors in the business. 👩🎓
(Save 20% with code PBILOVE, go to skw-t.com/pbilove.)
1
2
764
13 Feb 2024
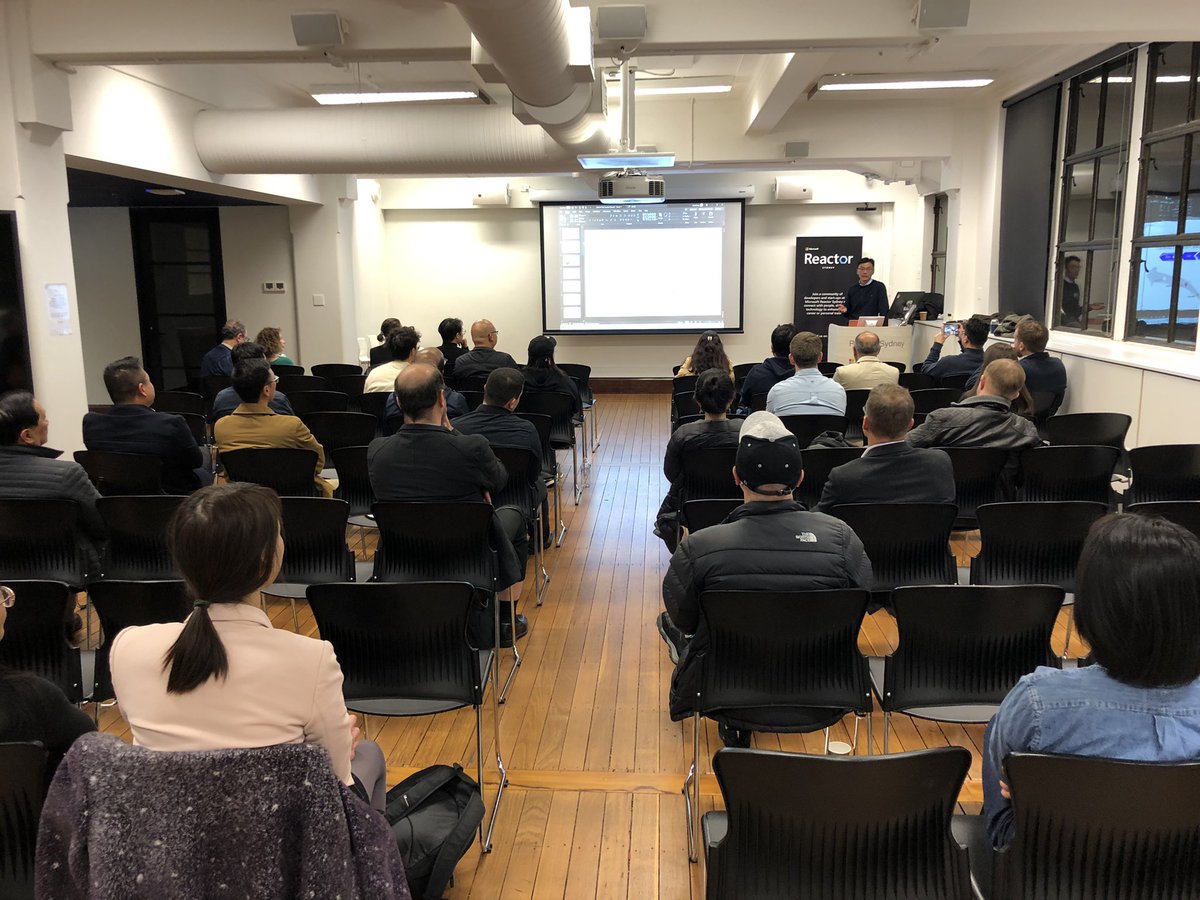
Tonight @BILAnalytics is presenting to the Sydney Power BI User Group. If you haven’t seen Roland’s video channel on YouTube, you’re missing out big time.
bilingualanalytics.com.au/
5
1,088
1 Feb 2024
My journey as a #Microsoft #PowerBI MVP is coming to an end. It's be fun; thanks a lot Microsoft. Keep up the good work.
Read about it here: exceleratorbi.com.au/my-jour…
15
1
68
5,052
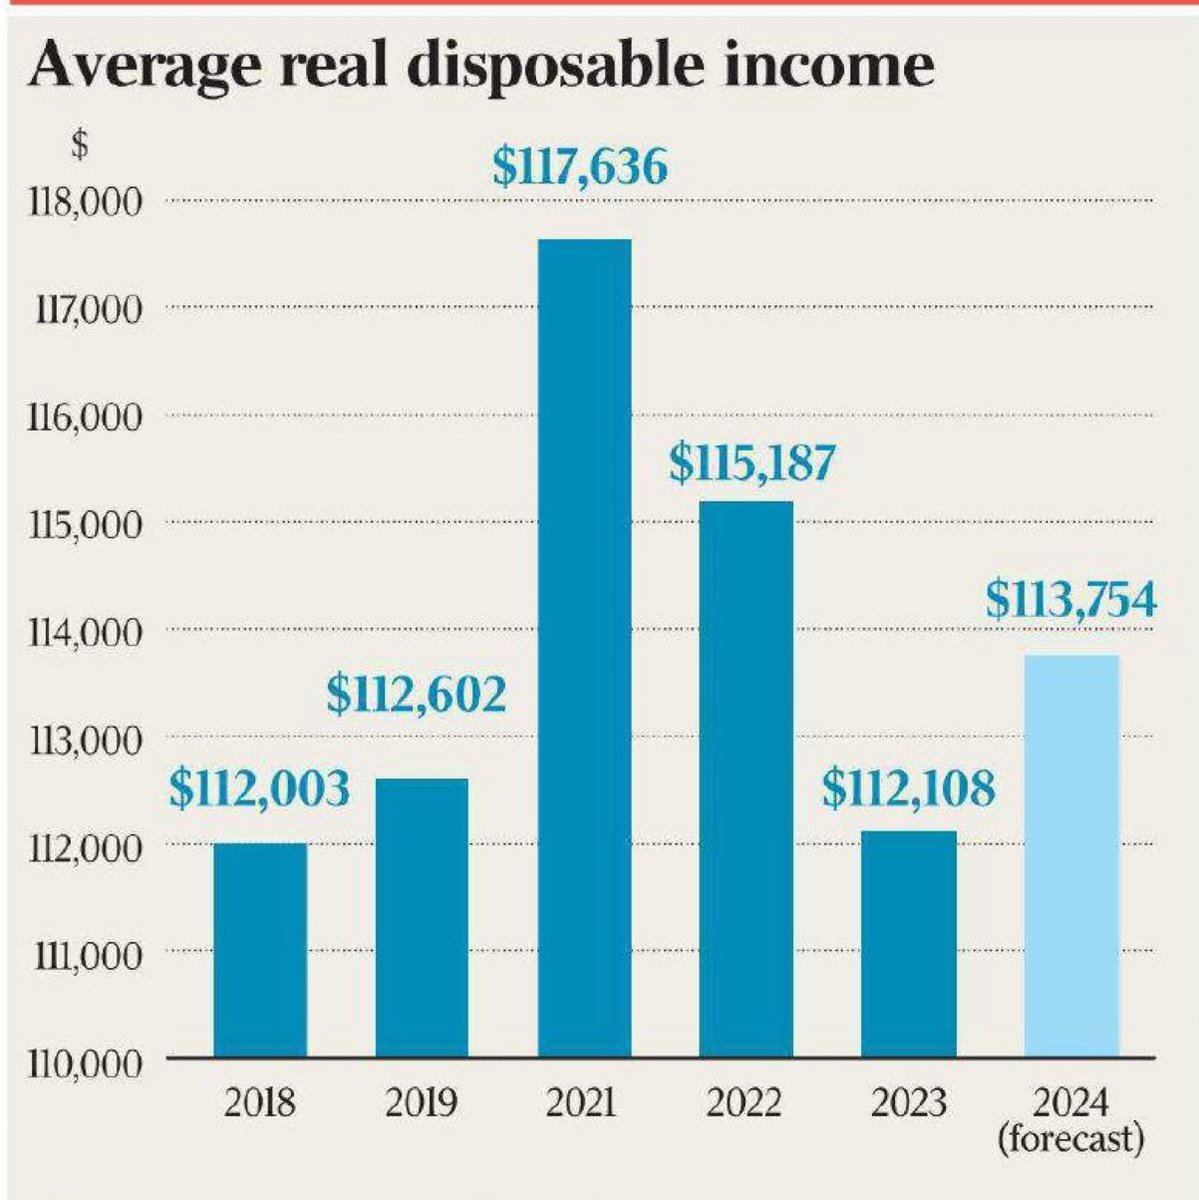
4 Jan 2024
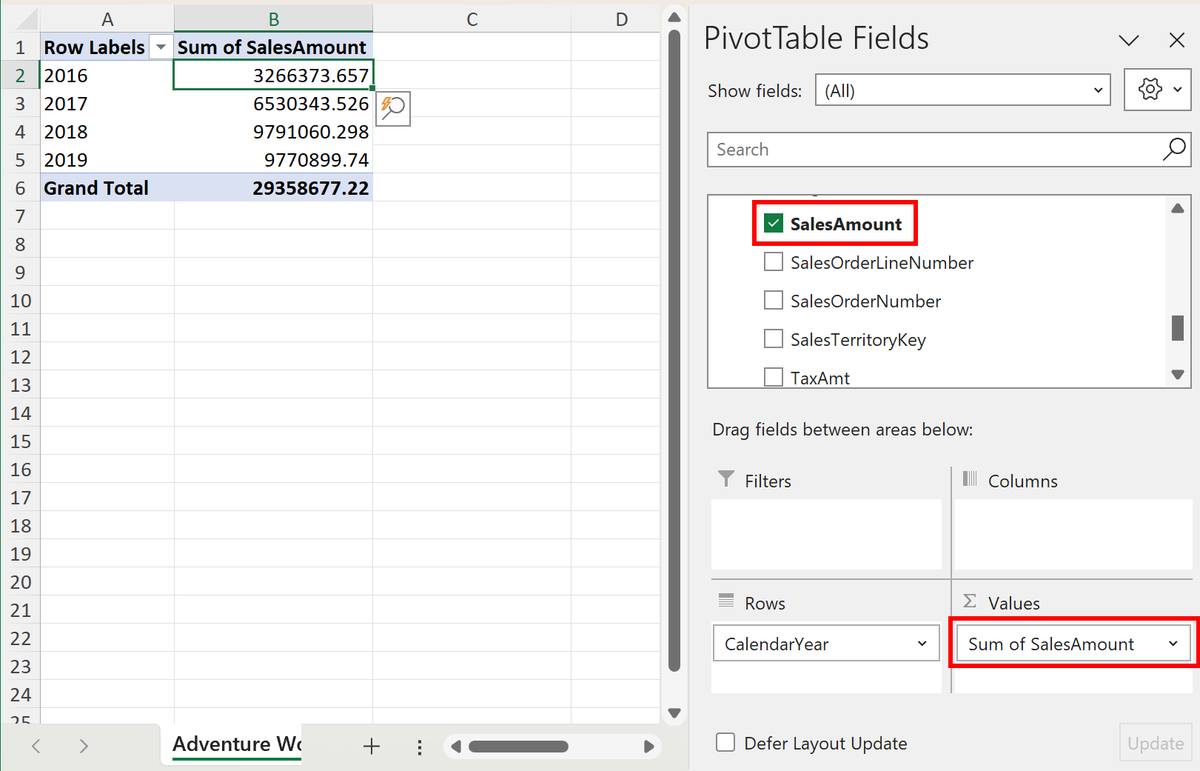
This chart was in @australian newspaper today. 🙄. Seriously! In this case, the chart implies 2024 is half the 2021 number. A column chart encodes the value in the height of the column. Don’t be like The Australian; always set the axis to start at zero.
6
32
2,941
Matt Allington retweeted
21 Nov 2023
Data professionals, it's time to level up! Stop the repetitive #datacleaning and start focusing on #dataanalysis. Learn how to save time and boost your career with #PowerQuery. 📈💼
Enroll now and enter code CYBERWEEK23 to save 23%: skw-t.com/cyberweek23-pqa
#Excel #PowerBI
2
7
3,852
22 Nov 2023
Have you noticed that Microsoft recently announced the renaming of #PowerBI datasets and they're now called "semantic models"? Are you a bit confused by all of this, and/or want to learn more. I have written a short article explaining it all here bit.ly/46ljSms
1
2
6
1,935
Matt Allington retweeted

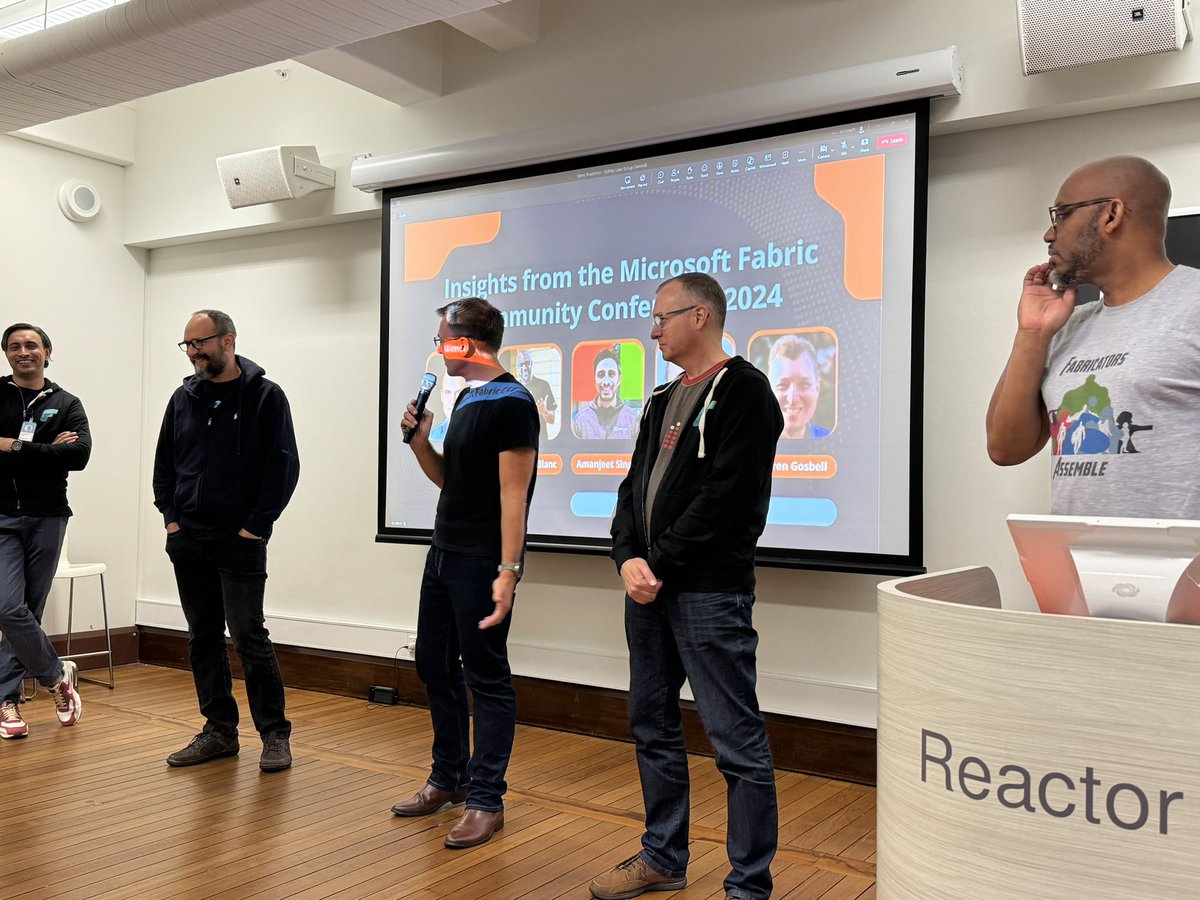
30 Aug 2023
Fantastic turnout despite thunder and lightning in Sydney tonight to hear about #MicrosoftFabric from @darrengosbell the user group.

1
1
17
2,287
30 Aug 2023
About to hear Phil Seamark and Darren Gosbell from the Microsoft CAT team talk to the Sydney #PowerBI User Group about all things Fabric
6
1,447
22 Aug 2023
If you are in Sydney, then next week is a MUST ATTEND #PowerBI User Group. The Sydney PUG has the pleasure of having @darrengosbell , @PhilSeamark and Amanjeet Singh from #Microsoft presenting to us on the topic of Fabric.
We would love to see you there
meetup.com/sydney-power-bi-u…
4
8
2,537
25 Jul 2023
David Ding is our guest speaker this week at the Sydney Power BI User Group. Another great turnout on another cold Sydney evening.
1
7
1,636
13 Jul 2023
oooohh, interesting. I just stumbled upon the fact that when using Analyze in Excel connected to a Power BI Online report, that you can now create implicit measures. It used to be that you could only use explicit measures. Was I the only one not knowing this?
4
22
5,164
Matt Allington retweeted

4 Jul 2023
🏀 Shooting for the Stars - a Microsoft MVP! 👨💻
Who would've thought that my dreams of being an MVP would be realized in the tech world, not on the basketball court? 🤷♂️
#MVPBuzz #MicrosoftMVP #TechGameStrong #DreamBig #TechCommunity #PowerBI #DataPlatform #Analytics #Data

1
1
8
2,314
13 Jun 2023
The new card Visual in #PowerBI looks awesome.
powerbi.microsoft.com/en-us/…
We recently had Miguel speak at the Sydney PUG. If you want a sneak peak of what’s coming and how Miguel is making a difference, you can watch it here youtu.be/m4uLv9wWq7Y
6
23
3,289