
Joined June 2020
- Tweets 155
- Following 130
- Followers 64
- Likes 400
17 Photos and videos


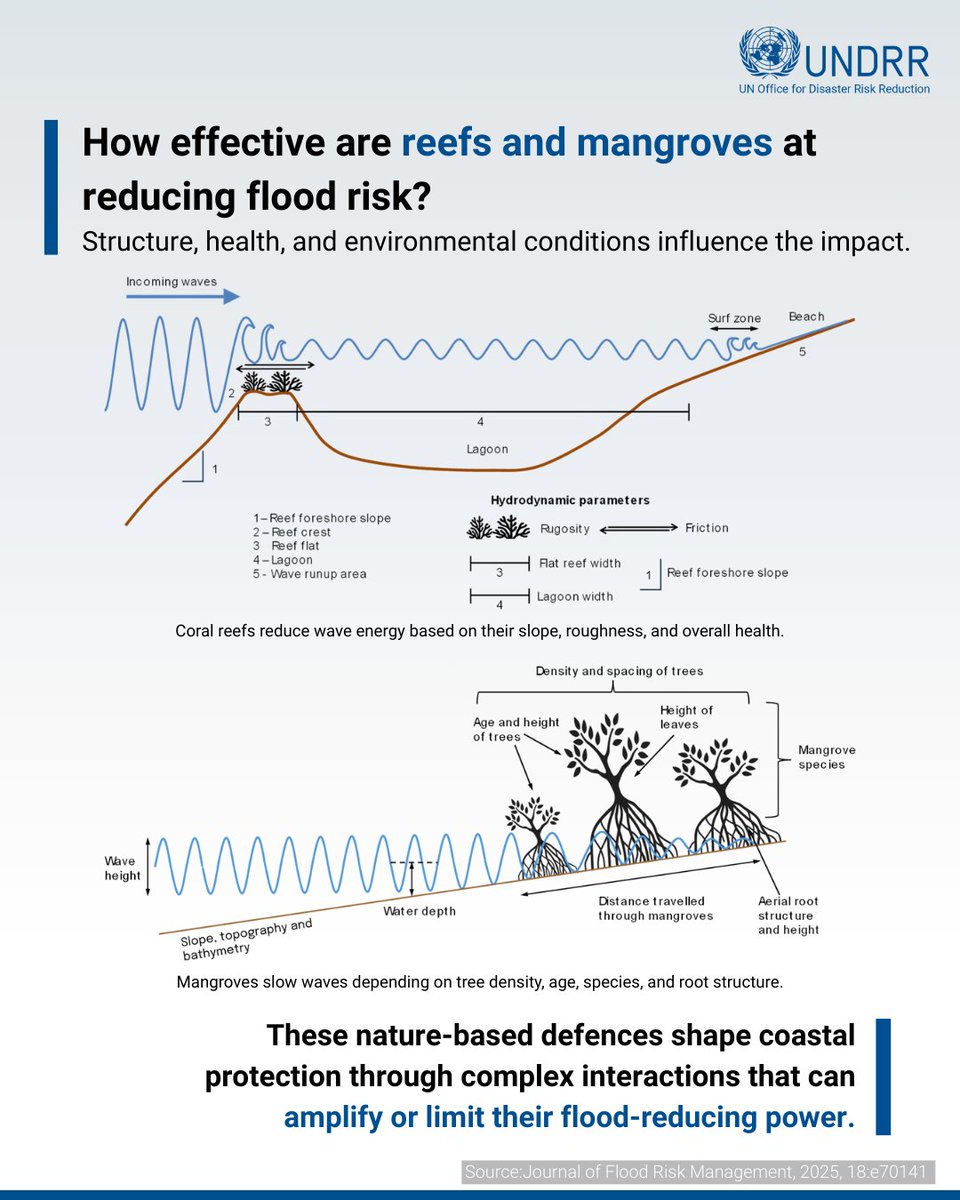
🌊 Not all nature-based solutions protect coasts equally.
Coral reefs and mangroves can significantly reduce wave heights and coastal flood risk, but their effectiveness depends on a complex mix of ecological and physical factors.
Read the full study➡️ ow.ly/SWjq50XzVEX
2
27
31
1,241
Gabriela Aguilera retweeted

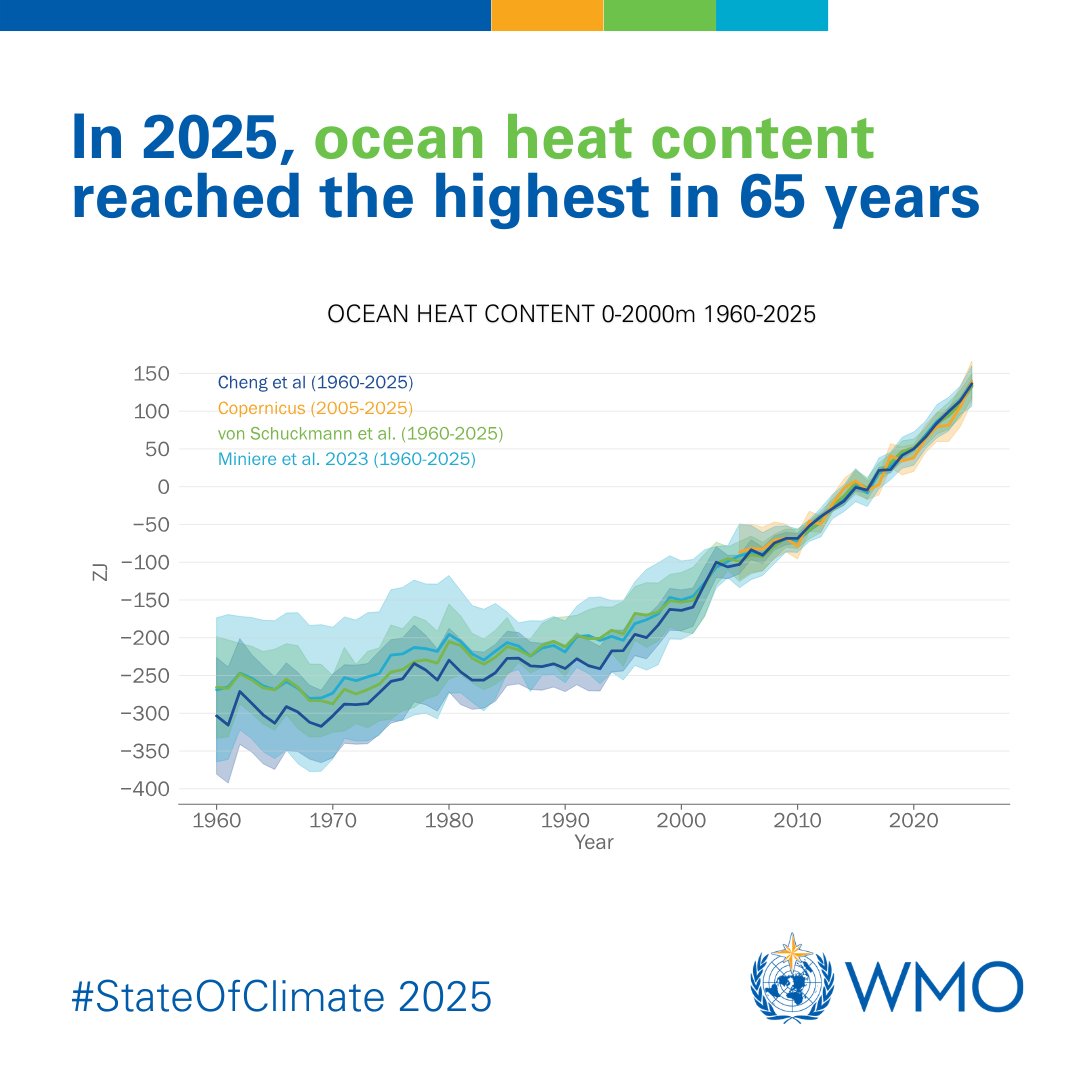
The ocean continued to warm in 2025, reaching record high levels.
It is expected that the ocean will continue to warm well into the future – a change which is irreversible for hundreds to thousands of years.
Check out the #StateOfClimate 2025: bit.ly/StateOfClimate2025sto…
66
424
653
85,835
Forests reduce the probability of all floods — including the largest events. 🌳
This new research challenges assumptions that forests only protect against smaller events.
Protecting nature is effective DRR. 🌿
➡️ ow.ly/cbHH50YKPfM #NatureBasedSolutions
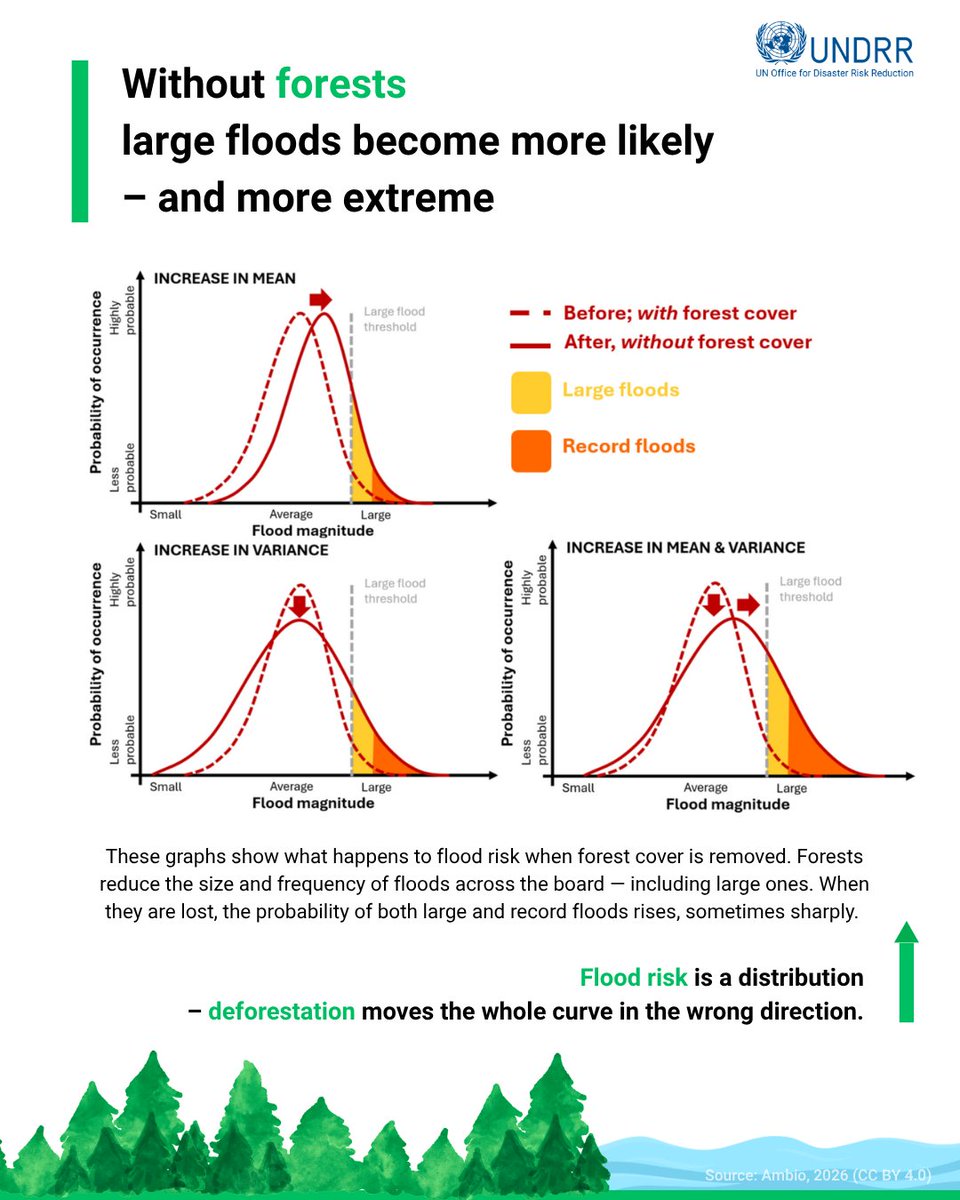
ALT Graphs showing flood risks increase in size and frequency when forests are removed, highlighting higher chances of large and record floods.
4
52
77
2,827
Gabriela Aguilera retweeted

4 Nov 2025
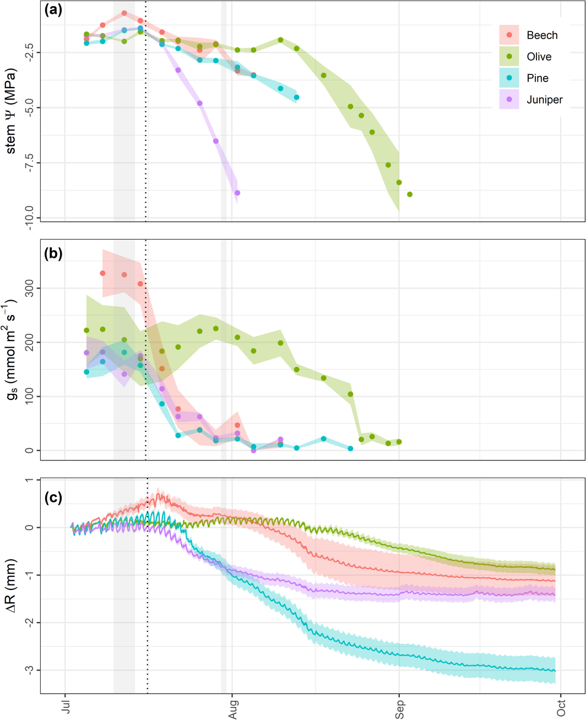
#Drought doesn’t follow one script: trees vary in how they close #stomata, lose conductivity, and regulate #aquaporins🌿💧
📰New paper out in @PPLplantarum
doi.org/10.1111/ppl.70619
7
29
1,282
Gabriela Aguilera retweeted

21 Sep 2025
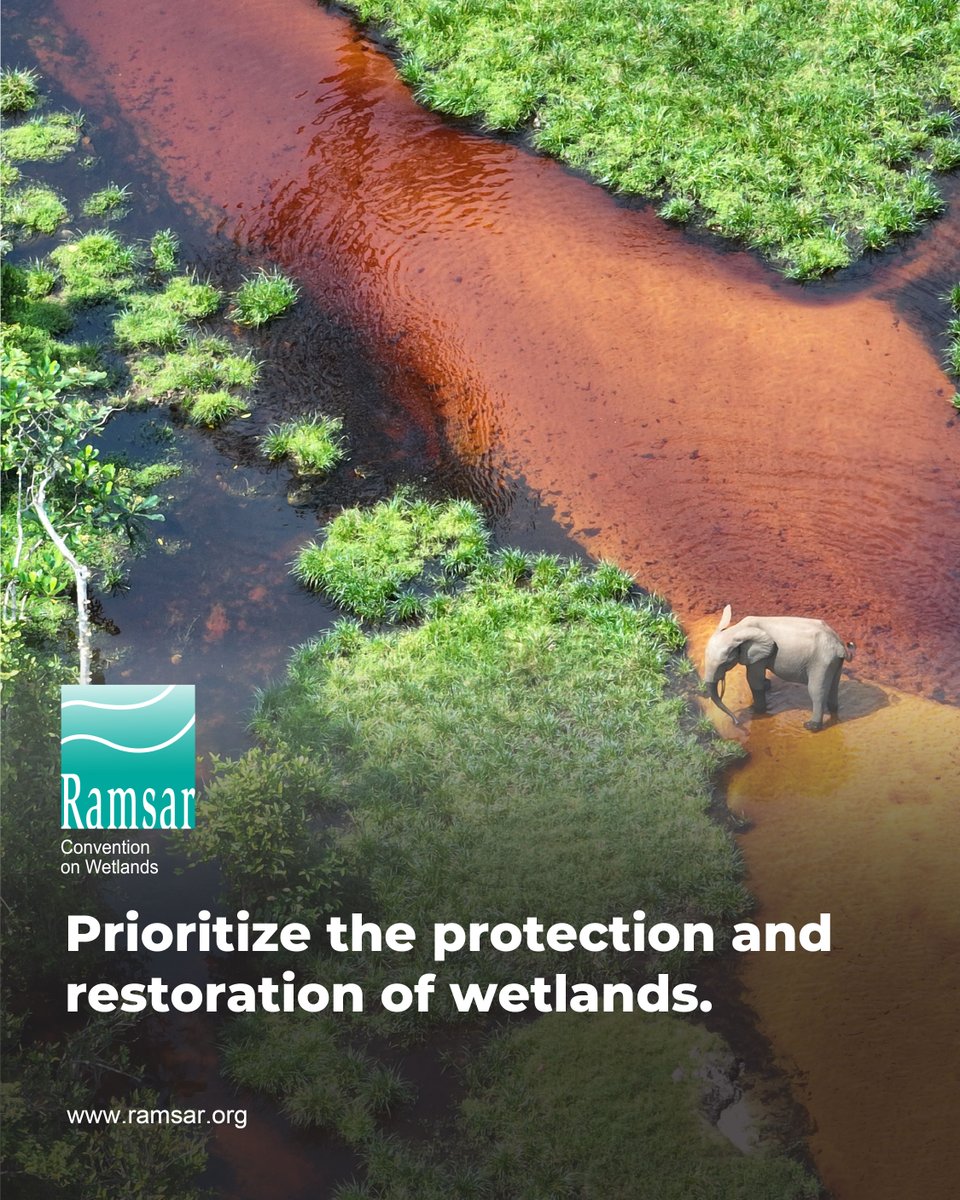
🌿Prioritize the protection and restoration of wetlands.
Removing the stressors and pressures on wetlands is the best practice for preventing further loss and degradation. When this is not feasible, wetland restoration must be considered as a potential response option.
1
13
21
1,513

7 May 2025
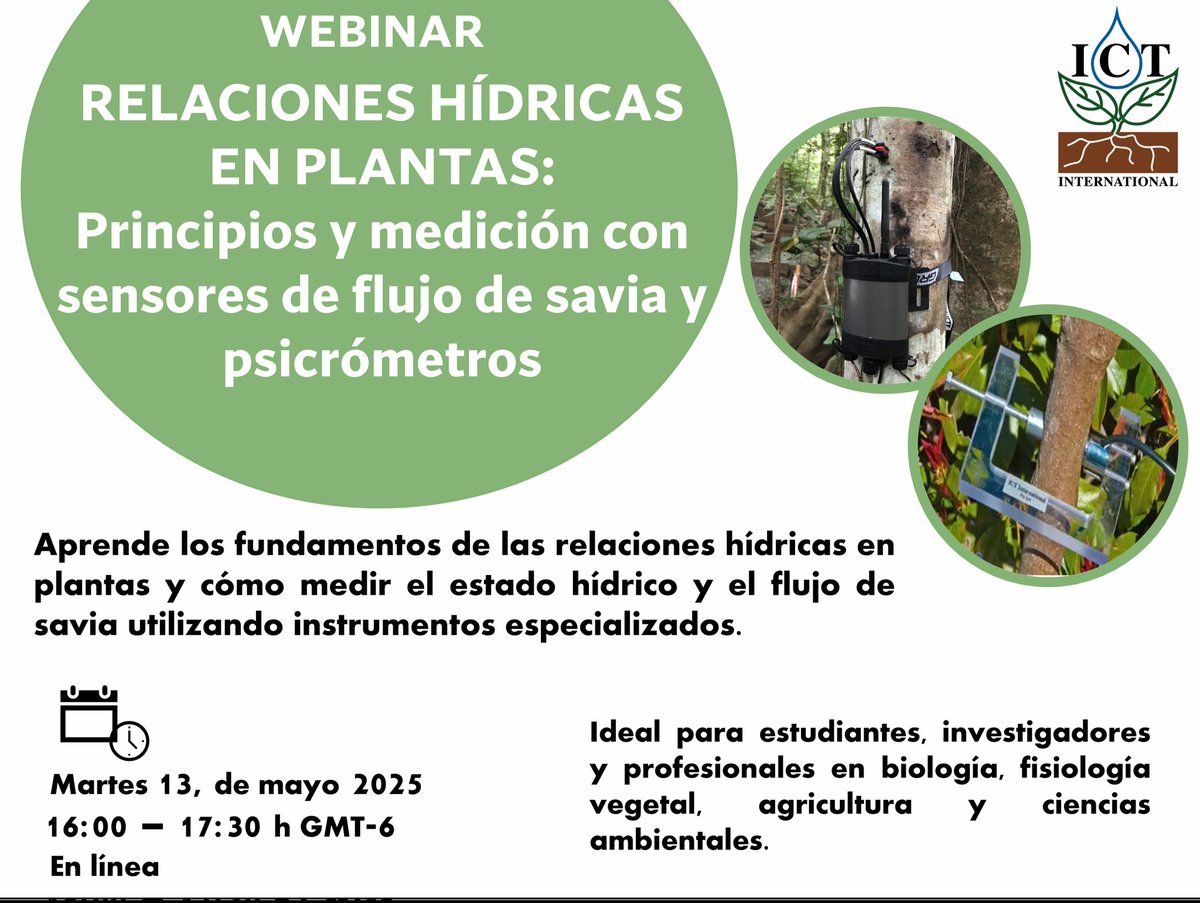
¿Cómo transportan agua las plantas?
Aprende a medir estado hídrico y flujo de savia con sensores de precisión en este webinar.
13 mayo | 16:00 h GMT-6
En línea
20
7 May 2025
How do plants manage water?
Learn to measure water status and sap flow with high-precision tools in this webinar!
May 13 | 4:00 PM GMT-6
Online
events.teams.microsoft.com/e…
16
Gabriela Aguilera retweeted

11 Dec 2024
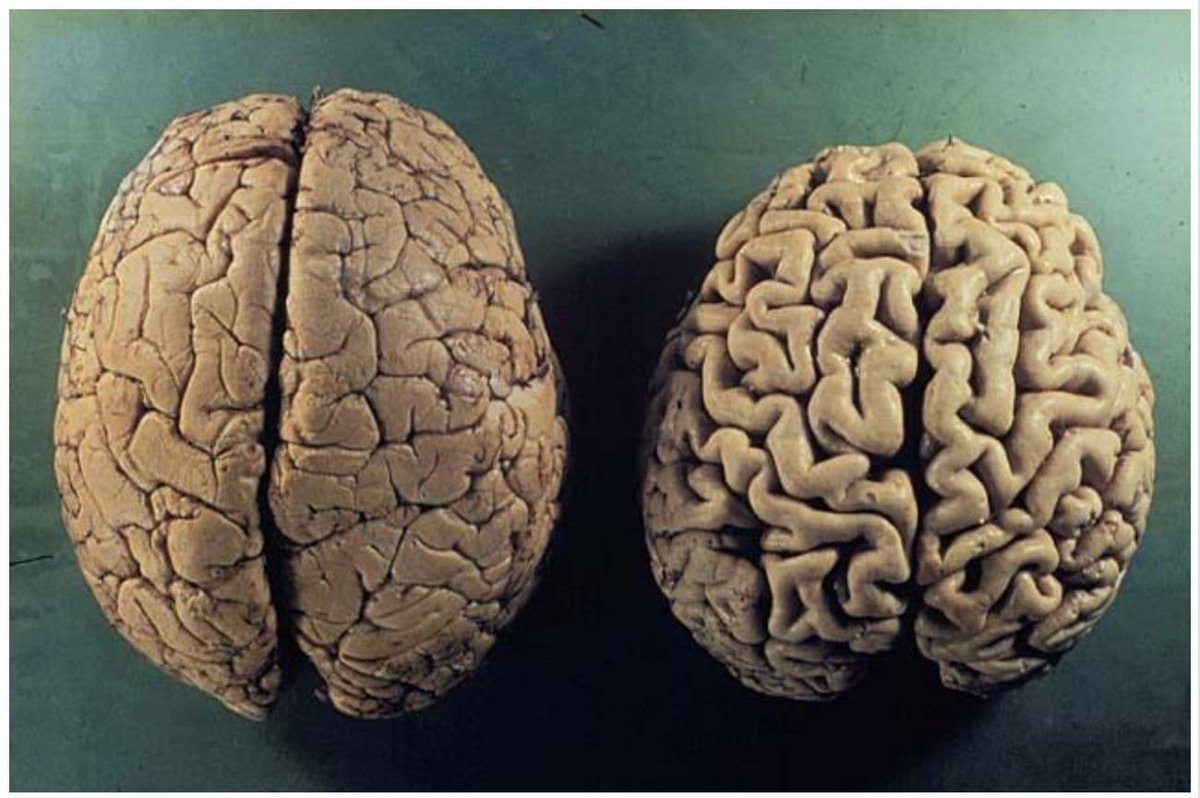
Todos quieren cuidar su cuerpo...
Pero nadie cuida su cerebro.
La mayoría de las personas simplemente lo ignoran hasta que algo sale mal.
Por eso, aquí está todo lo que necesitas saber para sanar y proteger tu cerebro: 🧵
33
817
2,822
553,505
Gabriela Aguilera retweeted

17 Oct 2024
«Sea el alimento tu medicina, y la medicina tu alimento».
-Hipócrates
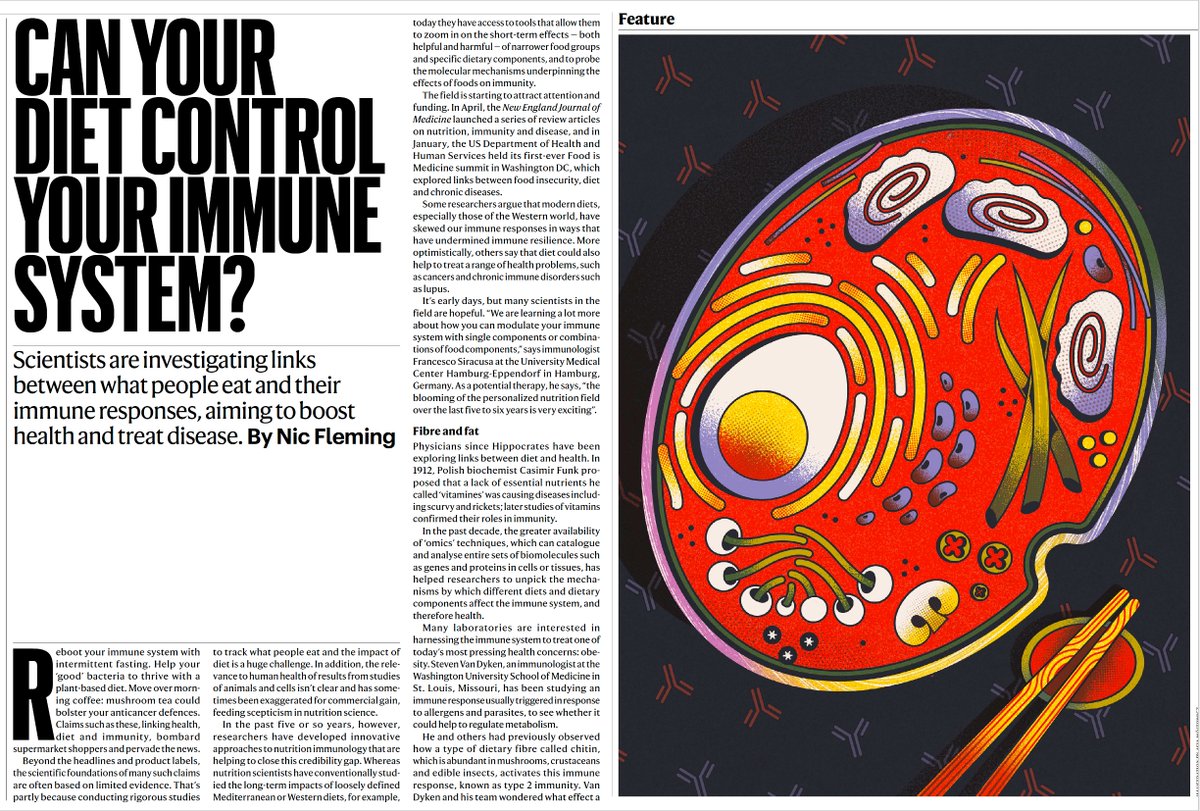
16 Oct 2024

The influence of diet on our immune system function is getting increasingly recognized, a feature today @Nature
nature.com/articles/d41586-0… @NicFlem open-access
2
22
84
3,702
Gabriela Aguilera retweeted
16 Oct 2024
⚕️🚶Si quieres hacer algo sencillo con gran impacto en tu salud, camina 2 minutos después de cada comida.

10
364
1,245
69,814
Gabriela Aguilera retweeted

24 Sep 2024

67
658
6,593
424,923
Gabriela Aguilera retweeted

25 Sep 2024
5
13
491
Gabriela Aguilera retweeted

27 Jun 2024
Amazing to meet an important scientist on #mangrove & #peatlands carbon dynamics during the #IUFRO2024 ...
Thanks!

1
9
371
Gabriela Aguilera retweeted

Four ITTO Fellows visited the ITTO booth AT IUFRO World Congress 2024 and expressed their gratitude for ITTO support in pursuing their research. Fellows from Malaysia & Mexico will be presenting the outcomes of their research at the 2024 IUFRO World Congress on Tuesday, 25th June


1
5
209
Gabriela Aguilera retweeted

14 Mar 2024
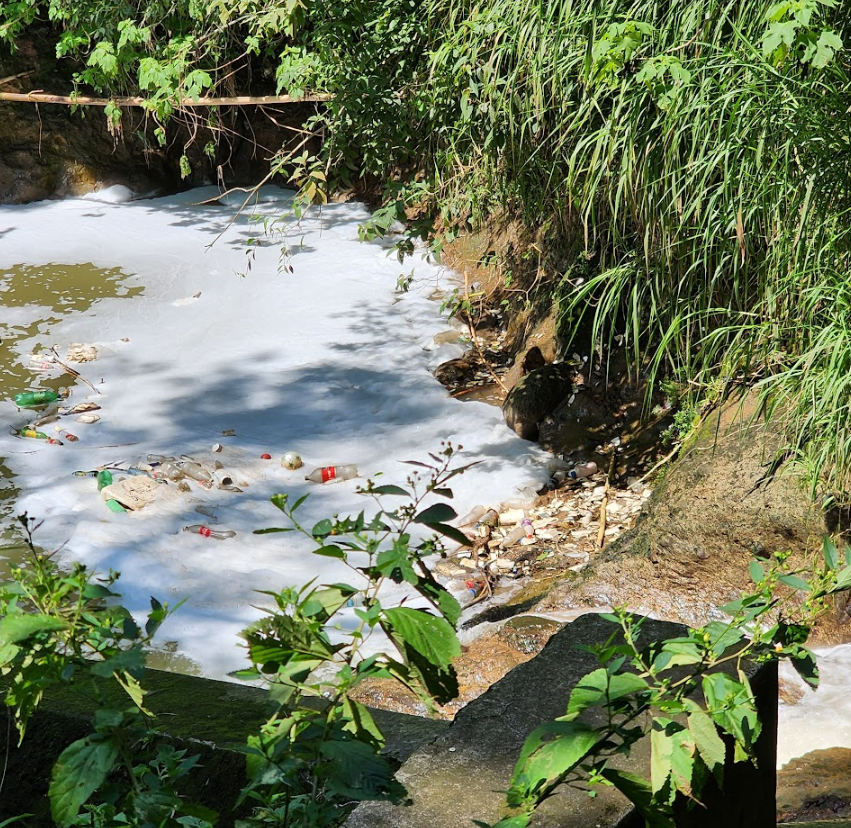
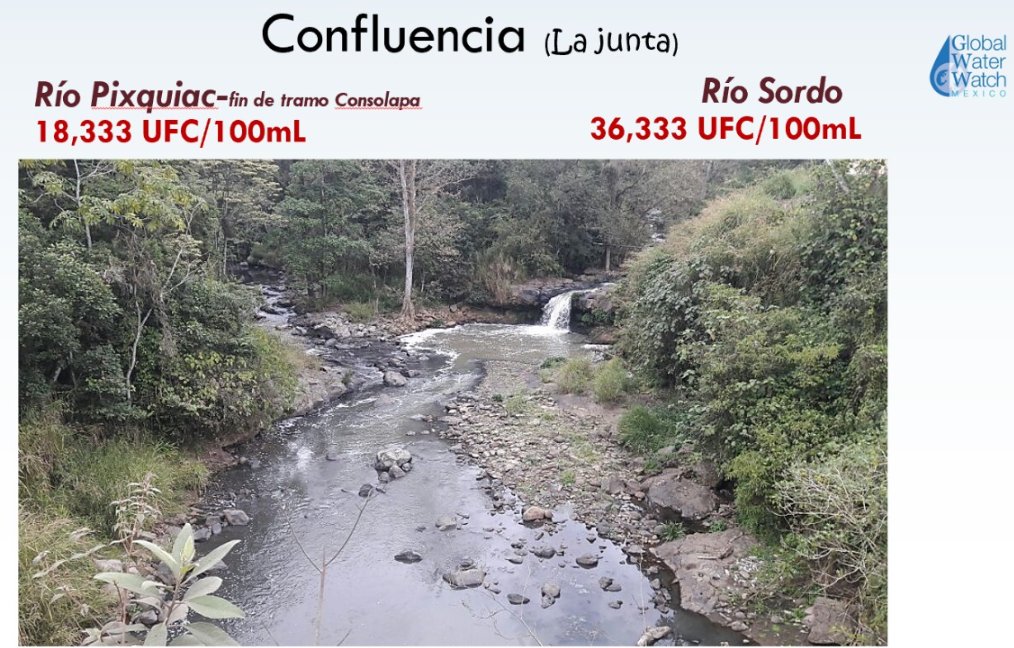
Hoy 14 de marzo, Día Internacional de Acción por los Ríos.... la #CrisisDeAguaEnMéxico se aguidiza por la contaminación de nuestros ríos #WaterForAll y #rioslibres de contaminación!! Sin agua no hay presente ni futuro.

1
3
10
276
Gabriela Aguilera retweeted

15 Feb 2024
Why do plants keep losing water during drought, as revealed in our recent study with @SteniBocker @SISeneviratne @PierreGentine ?
Learn how a global network of water potentials could unlock the answer in our @botanyone post below.
@PSInet_RCN @Novick_Lab
botany.one/2023/11/harmonizi…
4
19
1,040
Gabriela Aguilera retweeted

27 Dec 2023
A growing body of research shows that old-growth redwoods store more carbon above ground than any other forest on Earth.
But the redwoods have been decimated by logging.
We must restore old-growth redwood forests, John Reid argues in a new op-ed.
e360.yale.edu/features/redwo…
7
173
362
14,981
Gabriela Aguilera retweeted

11 Dec 2023
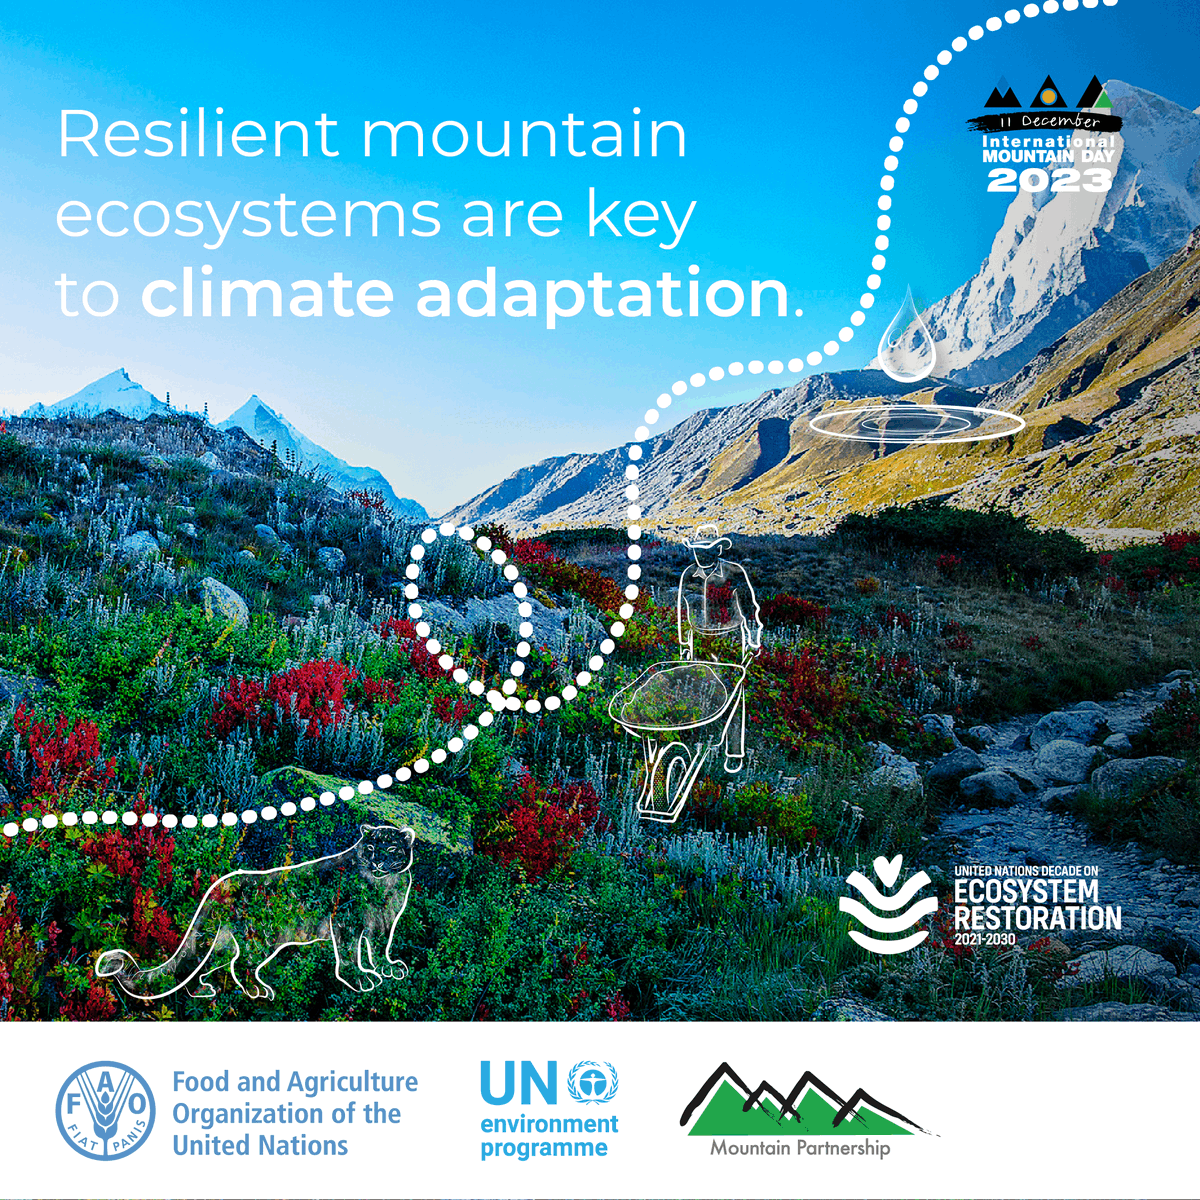
Billions of people depend on mountain ecosystems for water, food and income.
Yet, 84% of mountain species are at risk of extinction.
More on UNEP #GenerationRestoration efforts on Monday’s International Mountains Day: decadeonrestoration.org/type….
11
155
269
14,397
Gabriela Aguilera retweeted

10 Dec 2023
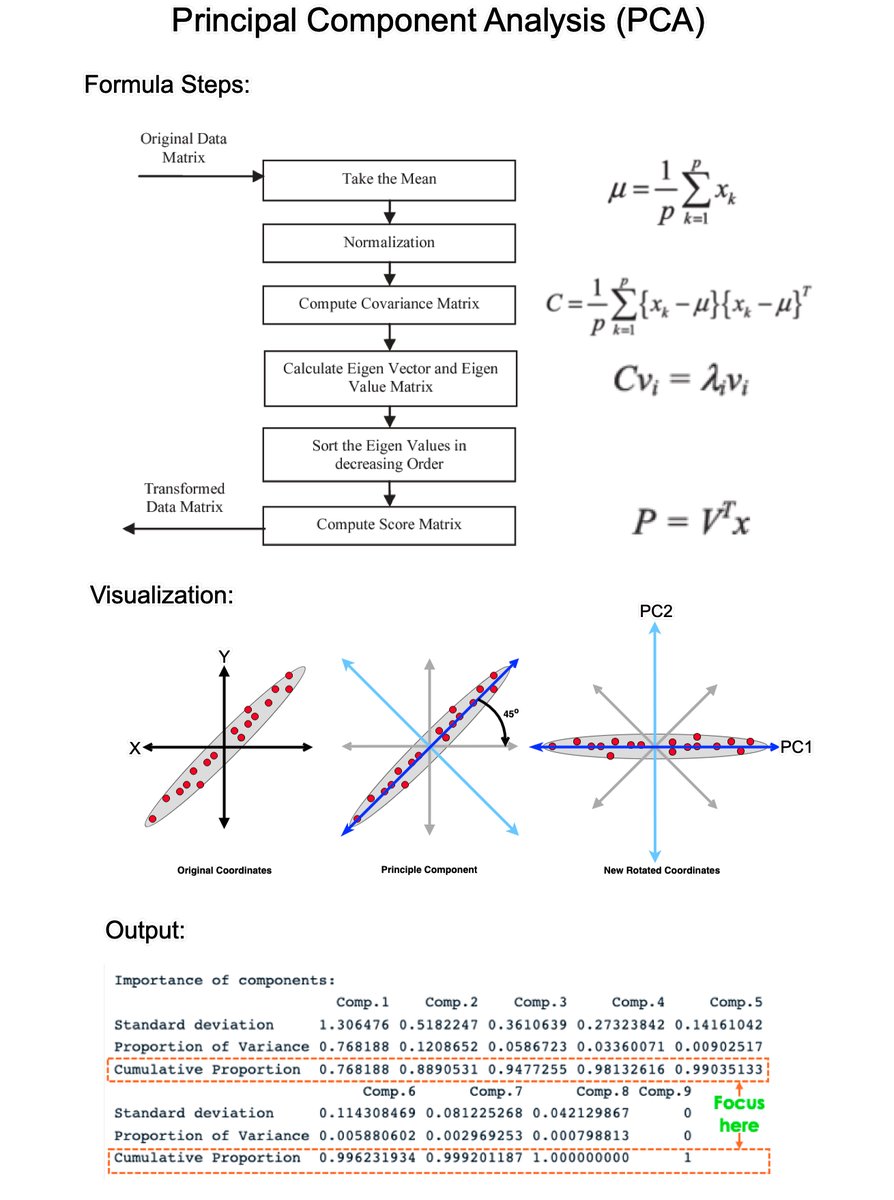
Principal Component Analysis (PCA) is the gold standard in dimensionality reduction with uses in business. In 5 minutes, I'll teach you what took me 5 weeks. Let's go!
1. What is PCA?: PCA is a statistical technique used in data analysis, mainly for dimensionality reduction. It's beneficial when dealing with large datasets with many variables, and it helps simplify the data's complexity while retaining as much variability as possible.
2. How PCA Works: PCA has 5 steps; Standardization, Covariance Matrix Computation, Eigen Vector Calculation, Choosing Principal Components, and Transforming the data.
3. Standardization: The first step in PCA is to standardize the data. Since the scale of the data influences PCA, standardizing the data (giving it mean of 0 and variance of 1) ensures that the analysis is not biased towards variables with greater magnitude.
4. Covariance Matrix Computation: PCA looks at the variance and the covariance of the data. Variance is a measure of the variability of a single feature, and covariance is a measure of how much two features change together. The covariance matrix is a table where each element represents the covariance between two features.
5. Eigenvalue and Eigenvector Calculation: From the covariance matrix, eigenvalues and eigenvectors are calculated. Eigenvectors are the directions of the axes where there is the most variance (i.e., the principal components), and eigenvalues are coefficients attached to eigenvectors that give the amount of variance carried in each Principal Component.
6. Choosing Principal Components: The eigenvectors are sorted by their eigenvalues in descending order. This gives the components in order of significance. Here, you decide how many principal components to keep. This is often based on the cumulative explained variance ratio, which is the amount of variance explained by each of the selected components.
7. Transforming Data: Finally, the original data is projected onto the principal components (eigenvectors) to transform the data into a new space. This results in a new dataset where the variables are uncorrelated and where the first few variables retain most of the variability of the original data.
8. Evaluation: Each PCA component accounts for a certain amount of the total variance in a dataset. The cumulative proportion of variance explained is just the cumulative sum of each PCA's variance explained. Often this is plotted on a Scree plot with Top N PCA components.
====
Ready to learn Data Science for Business?
I put together a free on-demand workshop that covers the 10 skills that helped me make the transition to Data Scientist: learn.business-science.io/fr…
And if you'd like to speed it up, I have a live workshop next week where I'll share how to use ChatGPT for Data Science: learn.business-science.io/re…
If you like this post, please reshare ♻️ it so others can get value.
34
768
3,345
401,188
Gabriela Aguilera retweeted

10 Dec 2023
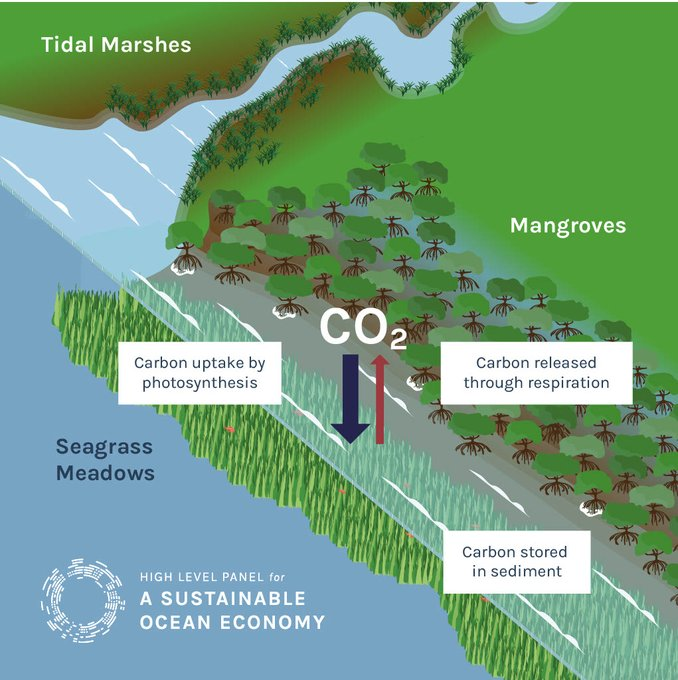
Mangroves, salt marshes & seagrass meadows aren't just beautiful ecosystems, they are our powerful allies against climate change. 🌏
They sequester carbon
Boost biodiversity 🐟
Protect our coasts 🌅 and
Support local economies.
Every effort counts.
Via @oceanpanel
11
164
336
11,023