
Analyze, graph and present your scientific work with Prism. Purpose built for scientists, not statisticians.
Joined November 2009
- Tweets 1,126
- Following 8
- Followers 1,861
- Likes 464
211 Photos and videos
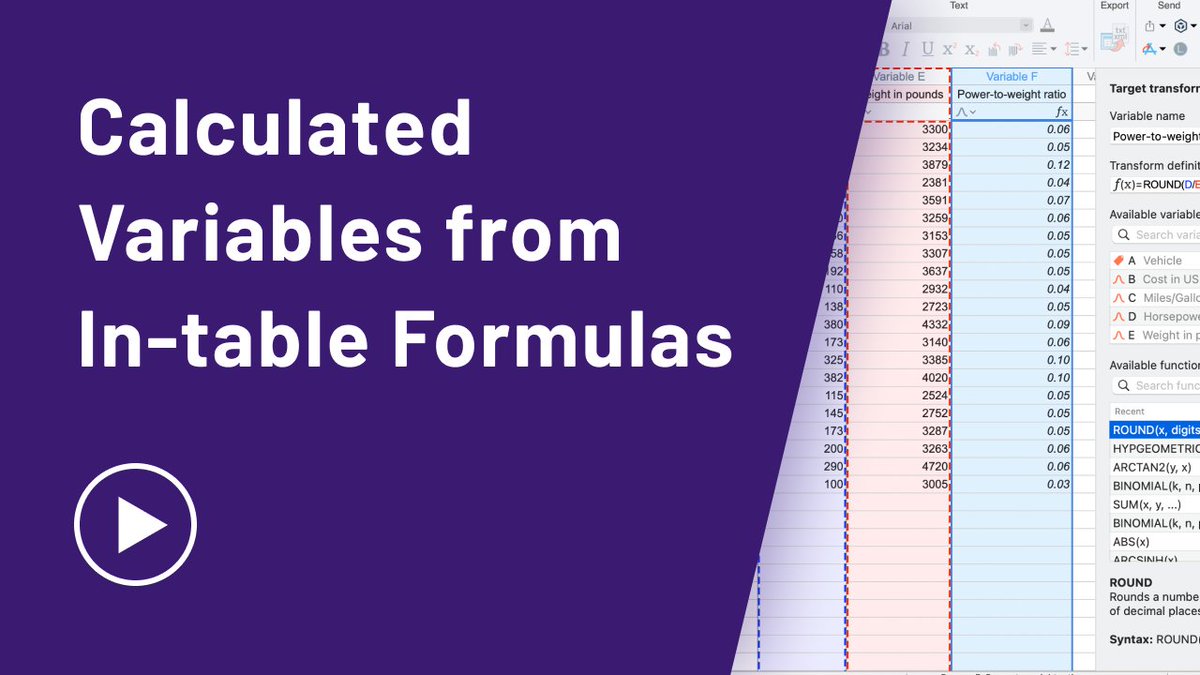


Build ratios, log transforms, unit conversions, and more without moving your data into external spreadsheets with Prism's Calculated Variables from In-table Formulas.
Watch the video to learn more: hubs.ly/Q04fR9fg0
#Prism11 #DataAnalysis
2
107

Apr 28
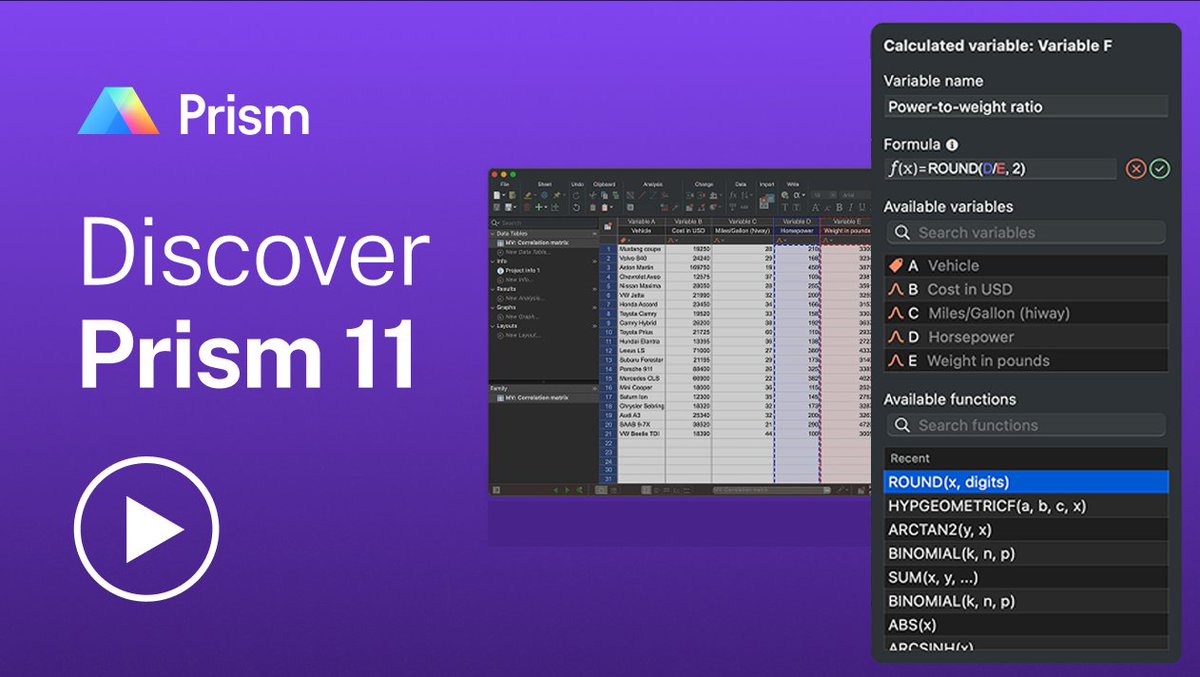
Stop switching between spreadsheets. With Prism's new in-table formulas, create calculated variables directly in your Multiple Variables table using spreadsheet-style formulas.
Learn how it works: hubs.ly/Q04dL00_0
#Prism11 #GraphPadPrism #DataAnalysis
1
121
Apr 21
Are you still restructuring tables and running manual calculations? Prism 11 can help you fix that with in-table formulas, multifactor ANOVA, effect size reporting, and much more!
Explore all the new features here: hubs.ly/Q04cTsQ20
#Prism11 #AnalyticsTools #DataAnalysis
1
108
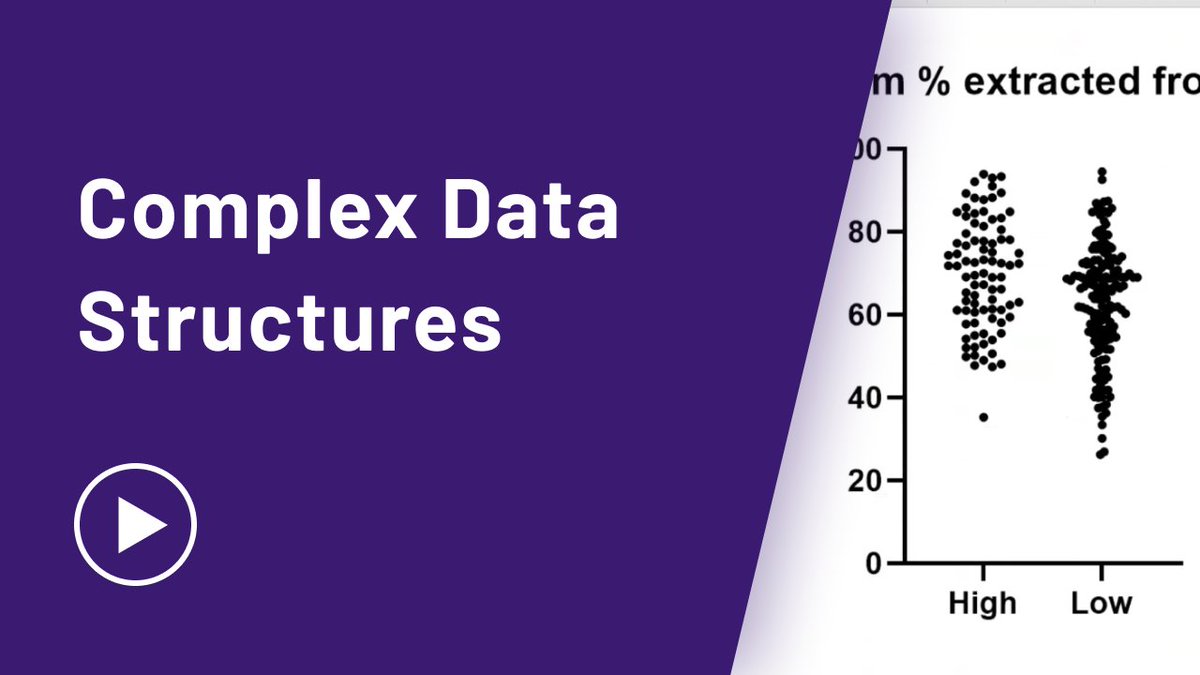
Working with count data?
Use Poisson regression in Prism to model outcomes, interpret coefficients, check predictors, handle multicollinearity, and evaluate model fit.
hubs.ly/Q045S4k30
#PoissonRegression #DataVisualization #DataAnalysis #PrismTips
113
Mar 25
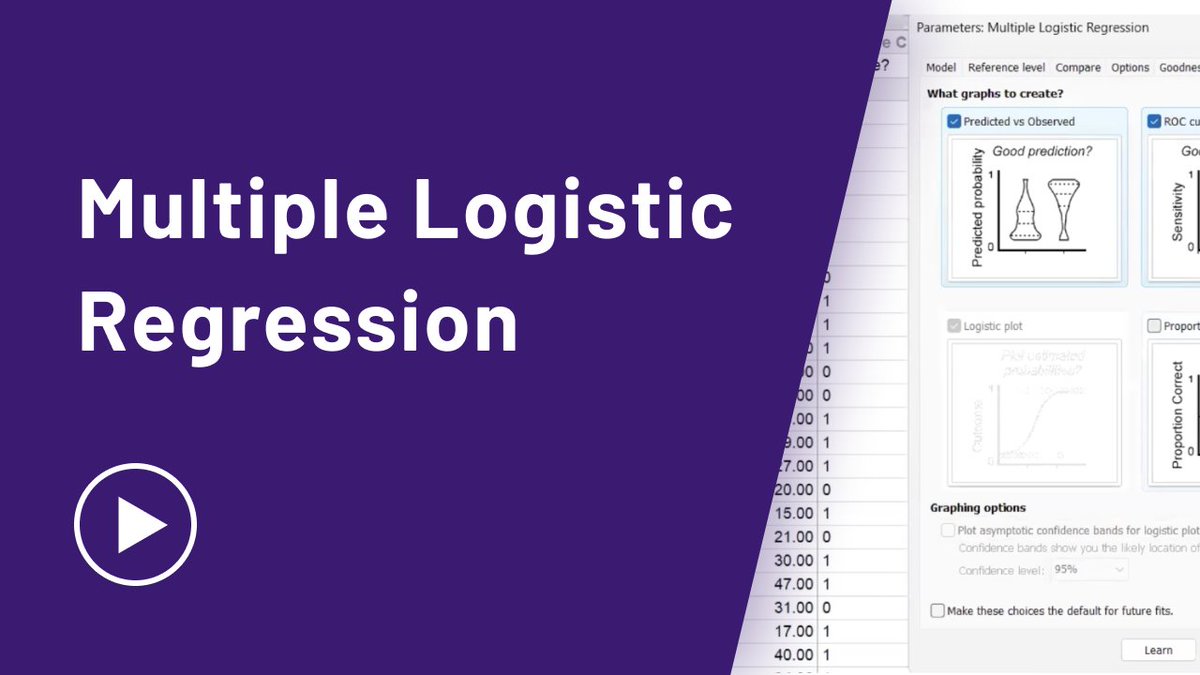
Explore multiple logistic regression in Prism. Predict outcomes, interpret odds ratios, ROC curves, model fit, and row-level prediction accuracy.
hubs.ly/Q045S1gs0
#MultipleLogisticRegression #DataVisualization #DataAnalysis #PrismTips
1
80
Mar 18
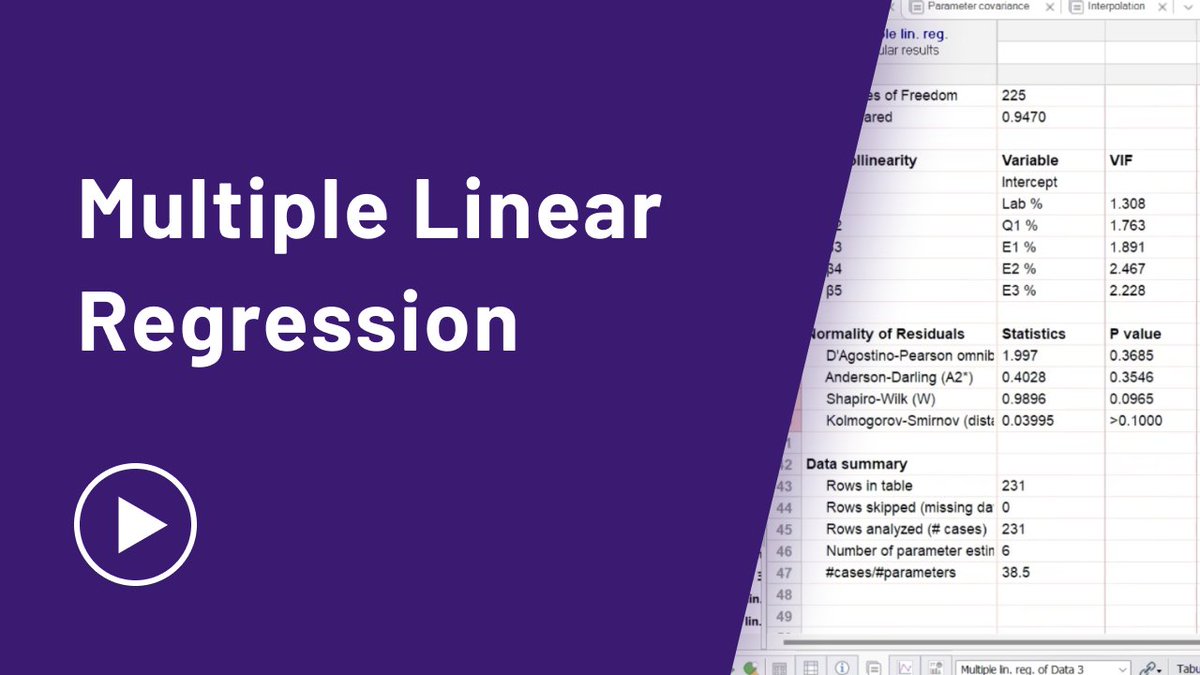
From predicting outcomes to checking residuals, multiple linear regression in Prism simplifies the analysis of complex data. Learn the essentials in this quick video!
hubs.ly/Q045S0MC0
#MultipleLinearRegression #DataVisualization #DataAnalysis #PrismTips
1
104
Mar 11
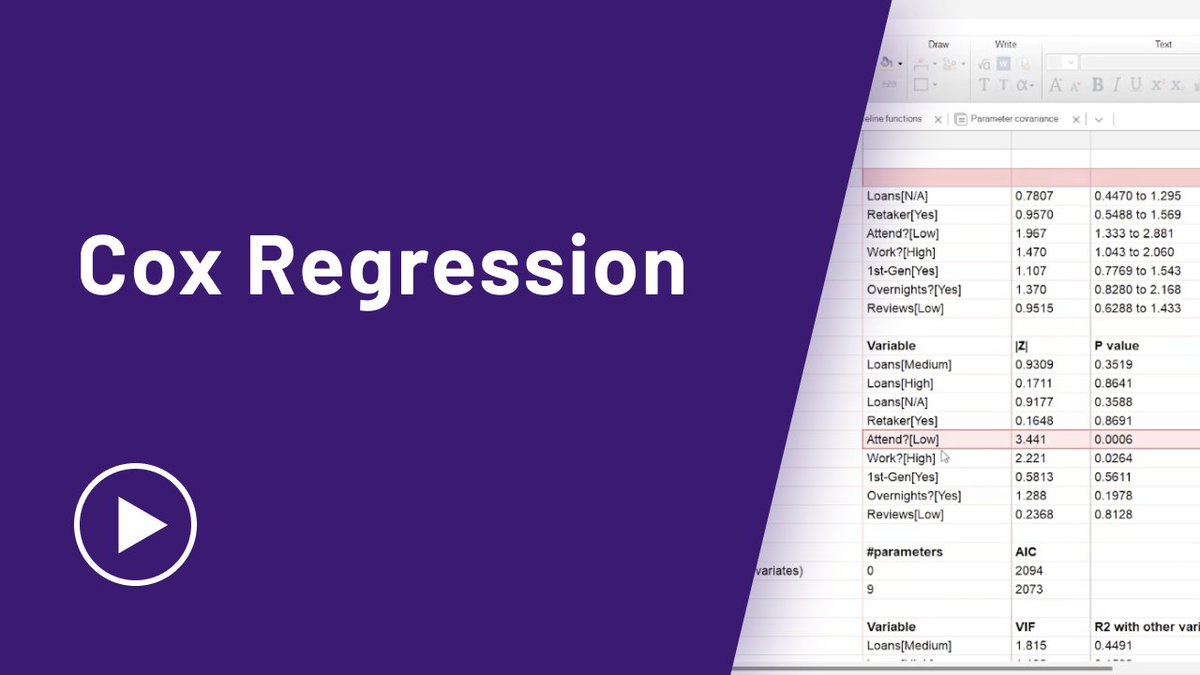
What is Cox regression and why is it key in survival analysis?
Learn how Cox proportional hazards models in Prism help analyze time-to-event data and risk factors in clinical studies.
hubs.ly/Q045RByC0
#CoxRegression #DataVisualization #DataAnalysis #PrismTips
133
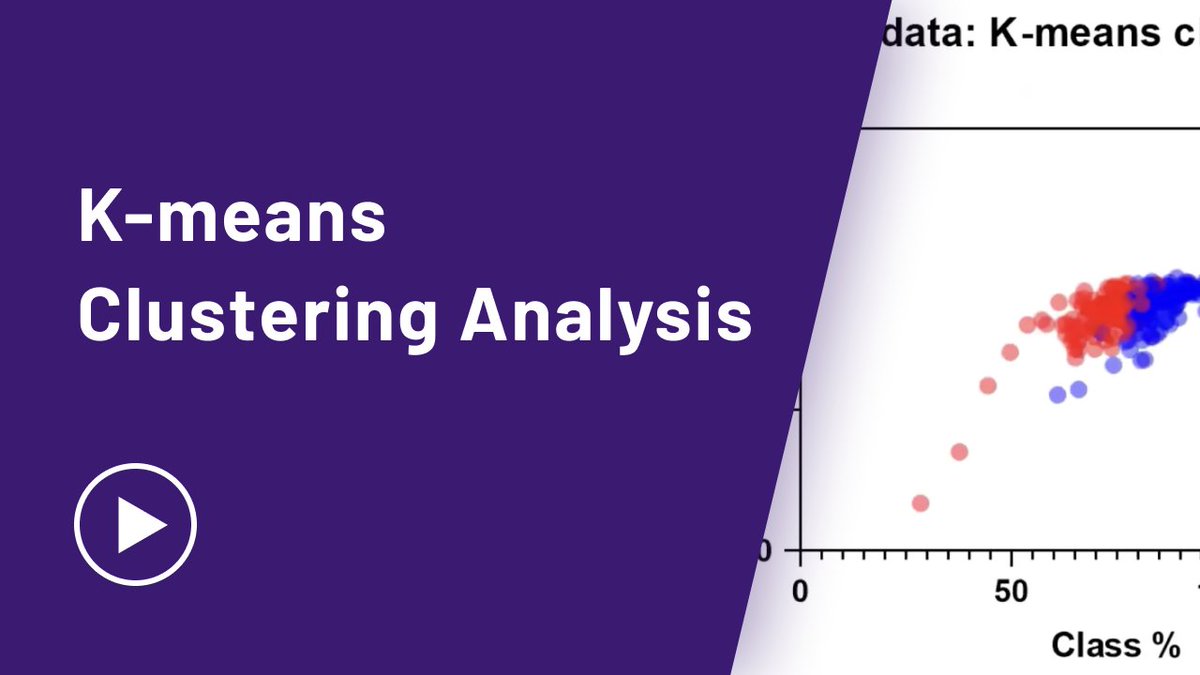
Watch this video to learn how to use K‑Means Clustering in Prism to find meaningful groups in your data and visualize clusters.
hubs.ly/Q045Kd5F0
#KMeansClustering #DataVisualization #DataAnalysis #PrismTips
1
117
Feb 25
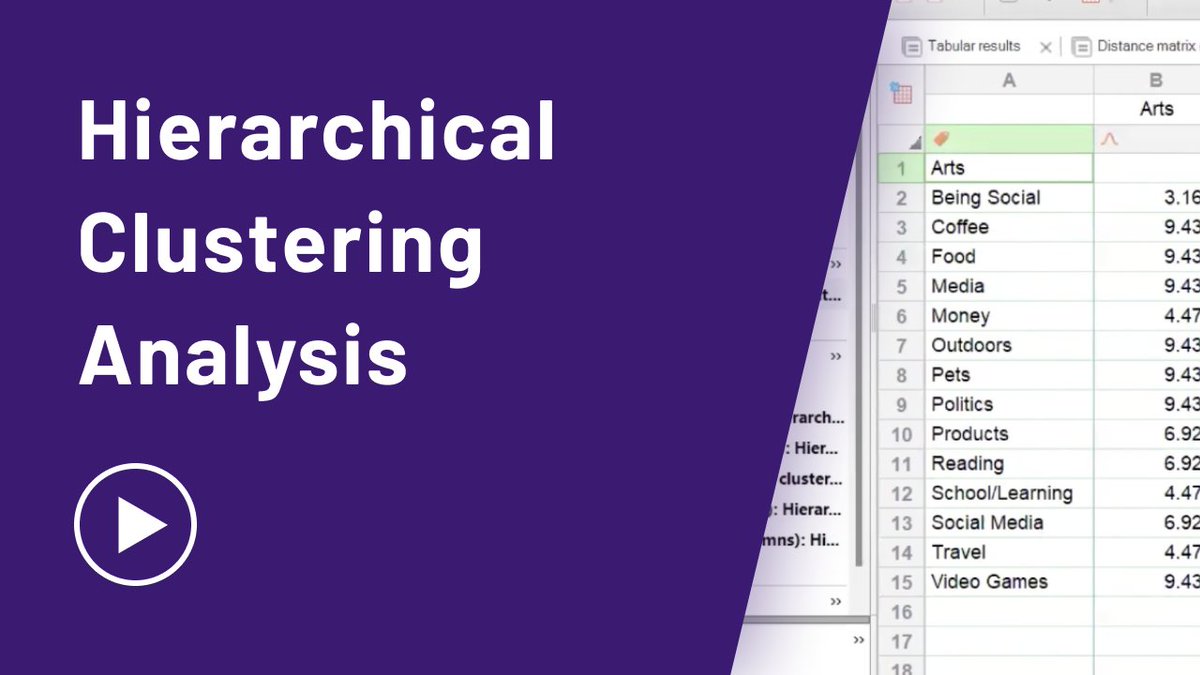
Watch this video to see how Hierarchical Clustering groups similar data points and builds visual dendrograms in Prism.
hubs.ly/Q0427qHf0
#HierarchicalClustering #DataVisualization #DataAnalysis #PrismTips
1
108
Feb 18
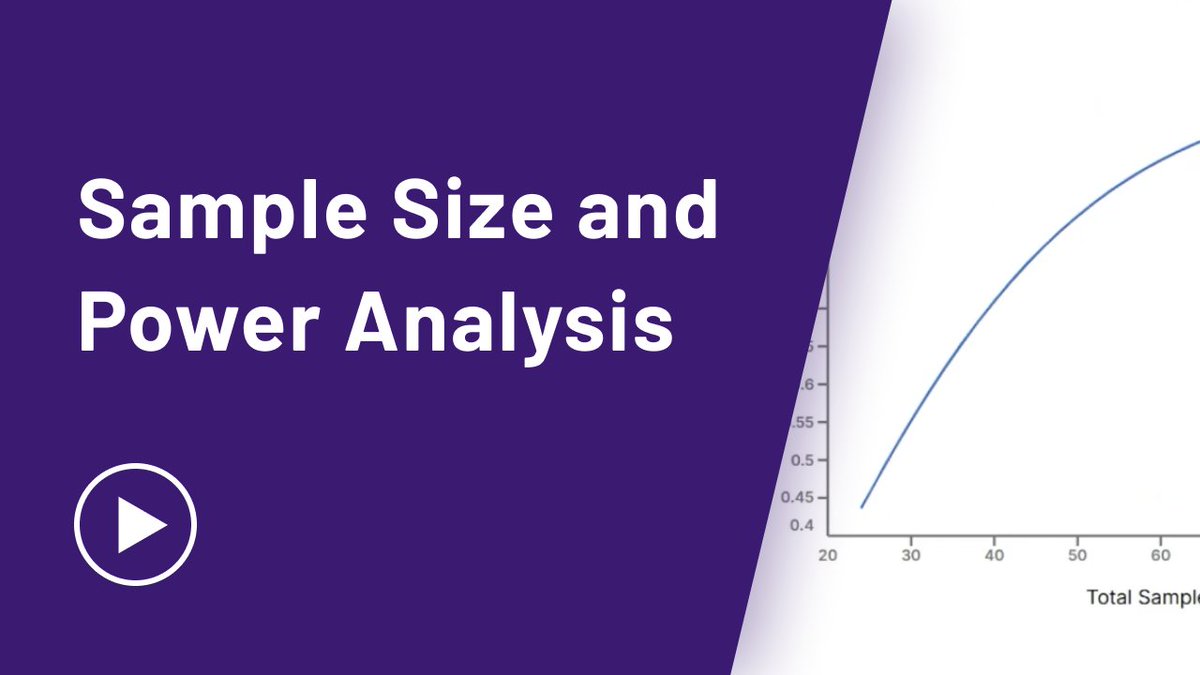
Watch this video to learn how to run power and sample size analyses in Prism, with practical steps and a clear, easy-to-follow walkthrough.
hubs.ly/Q0427mmb0
#PowerAnalysis #SampleSize #DataAnalysis #PrismTips
1
103
Feb 11
Struggling with messy multi-variable tables?
Watch this video to see how Prism's Extract & Rearrange tool simplifies complex data preparation.
hubs.ly/Q04277d-0
#DataAnalysis #PrismTips #DataTools
1
75
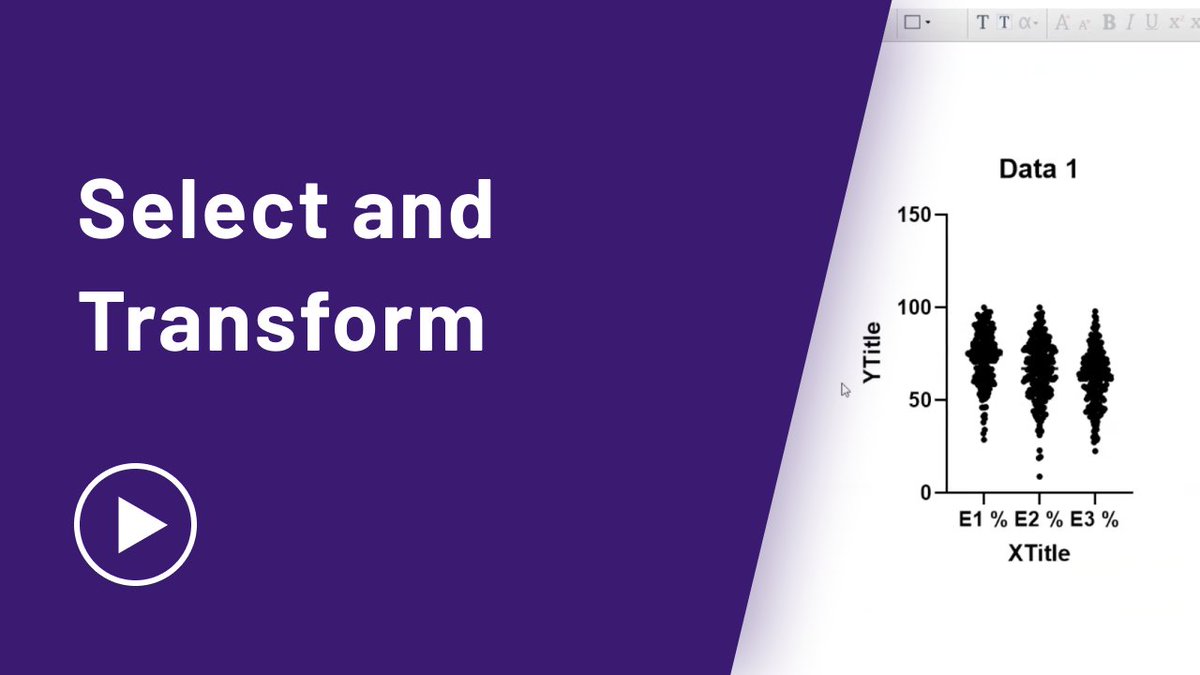
Watch this video for a quick walkthrough of Select & Transform and how it can help you simply data cleanup before analysis hubs.ly/Q041-KZ90
#PrismTips #SelectAndTransform #DataAnalysis
5
160
GraphPad Software retweeted

2 Apr 2025
🚀Exciting news: Dotmatics has signed an agreement to be acquired by @Siemens.
Together, we’ll connect scientific design, discovery & manufacturing — helping life sciences teams accelerate innovation and impact.
dotmatics.com/news/dotmatics…

5
8
683
8 Oct 2024
Chi-square and Fisher's exact test both assess differences between proportions.
Before diving into these tests, consider these key questions & learn the distinctions between them.
Watch now: hubs.ly/Q02Qzjmj0
#Statistics #DataAnalysis #ChiSquare #FishersExactTest
1
1
747
3 Oct 2024
From forecasting outcomes to understanding associations, correlation, and regression offer unique advantages for data-driven decision-making.
For more insights into regression & correlation watch now hubs.ly/Q02QzgZy0
#Regression #Correlation #DataAnalysis
1
526
1 Oct 2024
While regression and correlation serve different purposes, both unveil relationships between variables, aiding data-driven decisions. Explore their applications in data analysis.
Watch now: hubs.ly/Q02QzkzF0
#Regression #Correlation #DataAnalysis #Statistics
412
26 Sep 2024
Explore the key differences between regression and correlation analysis. We break down purposes and interpret nuances of these fundamental concepts.
Watch this video for more insights: hubs.ly/Q02Qzp6_0
#Statistics #DataAnalysis #Regression #Correlation
345
24 Sep 2024
Parametric methods gain power by relying on population distribution assumptions, while nonparametric methods can be used to analyze data from experiments that don't match these assumptions.
Learn more hubs.ly/Q02Qzf1G0
#Statistics #DataAnalysis #Parametric #Nonparametric
220
20 Sep 2024
In an ideal world, statistical decisions would be straightforward and automated. But in the real world, choosing the right method is complex. Understanding your experiment and data types is crucial.
Learn more hubs.ly/Q02Qzgf50
#Statistics #DataAnalysis
1
3
272
4 Sep 2024
Struggling with paired vs. unpaired t-tests?
Discover when to use each test effectively. Learn how to handle subject variation and independent samples.
Learn more here: hubs.ly/Q02LpvR30
#Statistics #HypothesisTesting #TTests #ResearchAnalysis
1
201