
Penny/SmallCap/OTC trader - My posts are my opinion and not advice to buy or sell. Do your own DD
Joined July 2020
- Tweets 4,794
- Following 747
- Followers 543
- Likes 11,747
739 Photos and videos


Pinned Tweet

7 Oct 2022
You know a true bottom when you can be sitting with a large bid for months and it won't completely fill .. just tiny partials here and there... try to find that spot. If the SS is stable, DD is solid.. no negative catalyst stick with those.. size low.. retail gets bored quickly
1
1
12
WorkinGreen retweeted

18 Jan 2025
#OTCSET isn't about any one ticker, it's about a secular pattern which has normally been rare in the OTC and tends to correlate with (relative) bullish fundamentals and/or positioning. $MVCO $MRES $GRLT $PWDY $SPZI $RITE $DUTV $CYBL to name some of my faves, but there's a long list of potential suspects - most of which are currently trading at suppressed levels, low liquidity and largely under the radar.
1
3
18
4,790
WorkinGreen retweeted

Jun 10
OTC Top 20 Most Shorted: 06-10-2026
Tickers Listed by Short Volume
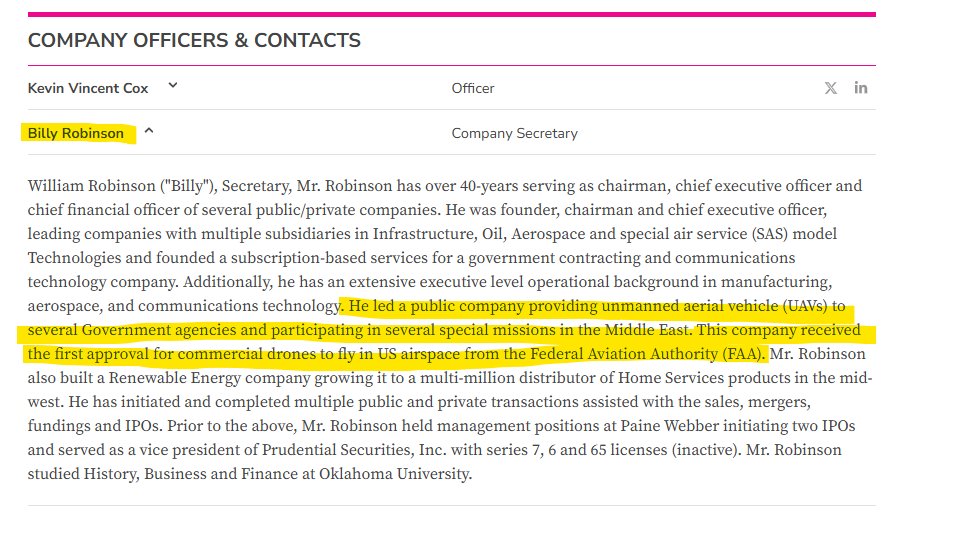
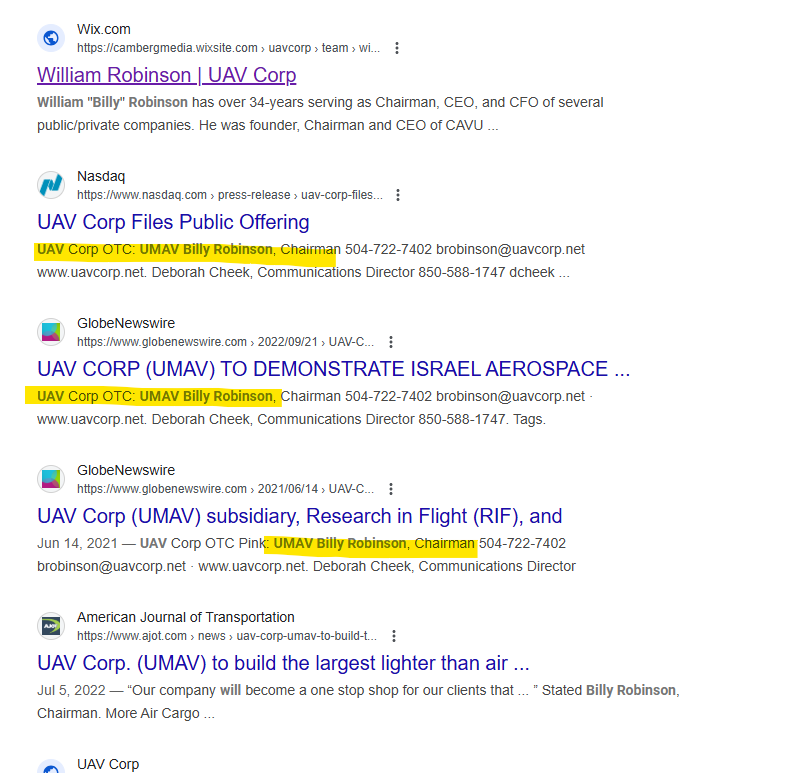
$CBGL | PSRU | UMAV | EDGM | VHAI | BFCH | AURI | GTCH | BIEI | CBDW | PRDL | CAVR | KEGS | HCMC | WTII | INND | NBND | KYNC | LTNC | ECOX
Bears were active in the OTC market today.
Your engagement helps! Please like, comment, share & follow.

1
4
9
407
Jun 10
Jun 10

Trump says that the government will seek equity stakes in top AI companies, per CNBC
1
4
431
WorkinGreen retweeted

Jun 10
Trump says that the government will seek equity stakes in top AI companies, per CNBC
171
56
810
167,535
WorkinGreen retweeted

Jun 9
#OTC Money has flowed into every sector of the market, only the legendary OTC is missing... Get ready! 🚨
2
4
32
1,032
WorkinGreen retweeted
May 7
#OTC is completely cheap!! Remember it's cyclical, the volume will return 💵😉
8
3
19
752

WorkinGreen retweeted

📊 Biggest mistake OTC traders make?
Buying AFTER a 300% move because of FOMO.
The money is usually made:
➡️ BEFORE attention comes.
1
1
2
58
WorkinGreen retweeted

Jun 3
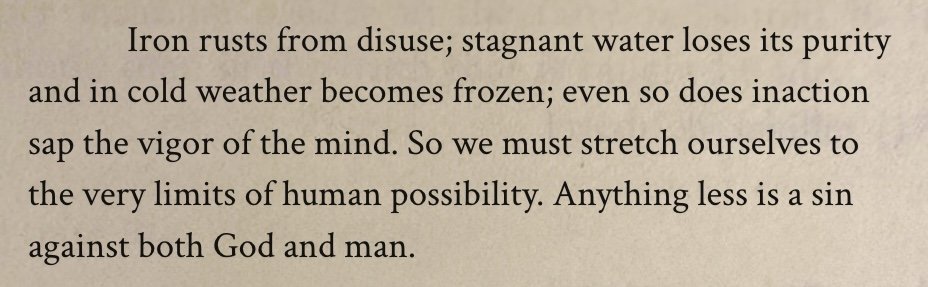
Leonardo da Vinci's greatest paragraph
88
5,947
33,471
647,299
Jun 4
BREAKING: The SEC has officially eliminated the $25,000 minimum equity requirement for day trading.
1
37
WorkinGreen retweeted

CEOs are quietly realizing the AI replacement plan has a problem.
Two problems, actually.
One: the token costs for running AI agents are now exceeding what they were paying the employees they fired.
Two: when the tokens run out, the AI stops. Just stops. No continuity. No workaround. Just a spinning wheel where your workforce used to be.
You fired humans to save money and bought a subscription that bills you into a corner.
The employees you let go knew what to do when things broke.
The AI just invoices you for the outage.
And then there’s the permission problem nobody wants to talk about.
To do its job, the AI agent needs access. Full access. Your systems, your patents, your contracts, your future plans. Everything you spent years building, handed over to a process that has no loyalty, no discretion, and no skin in the game.
You didn’t hire a replacement.
You gave a stranger with no soul the keys to everything you own.
Enjoy.
1,396
13,726
53,493
3,301,928


WorkinGreen retweeted

14 Apr 2025
$OTC WATCH !!!! After 4 year downtrend lots of 000 stocks have been setup for massive runs. Look at charts and accumulation levels in last 4 years. Experienced traders with bank are moving in. Many of these are identical to reach 007 levels before the March to pennyland
9
9
83
4,326

27 Feb 2025
@DOGE @elonmusk @DataRepublican
It seems we may have discovered a new money laundering operation in the state of MA. It is called “Mass Save”… they have suddenly raised our utility bills by 2-3 times. It seems nefarious. Can you please look into this?
cbsnews.com/boston/news/mass…
1
1
133
27 Feb 2025
Stealing money from poor utility rate payers and forcing them to pay for your wasteful pet EV/wind agenda through the backdoor is sick. Forcing these exorbitant delivery fees on poor residents is disgusting and immoral.
mass.gov/news/new-mass-save-…
@MassGovernor @NewBedfordGuide
1
41
WorkinGreen retweeted

6 Feb 2025
Forcing taxpayers to fund a charity isn't chartible. The giving isn't voluntary. It's compelled via force of law. All of these organizations getting USAID grants and otherwise need shut down. Don't tell me sob stories. I've seen the salaries and perks. Shut them down!
150
1,905
9,889
128,179
WorkinGreen retweeted

4 Feb 2025
Dear OTC,
When news and updates come, they come.
Your tweets towards the CEO asking, doesnt change a damn thing. For the love god, STFU.
Kindly,
Hulk
8
2
56
3,461
WorkinGreen retweeted

5 Feb 2025
BREAKING REPORT:⚠️ Effective immediately, U.S. Postal Service will NO LONGER be accepting packages from China and Hong Kong...
DEVELOPING...
629
3,116
15,029
742,829
WorkinGreen retweeted
24 Jan 2025
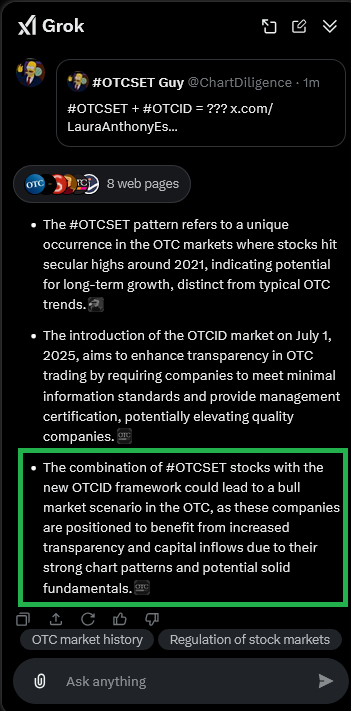
The OTC Special Event Theory or the #OTCSET for short is the recognition of longer term strength/trends in a great number of OTC stocks - the likes of which I don't believe has ever happened before.
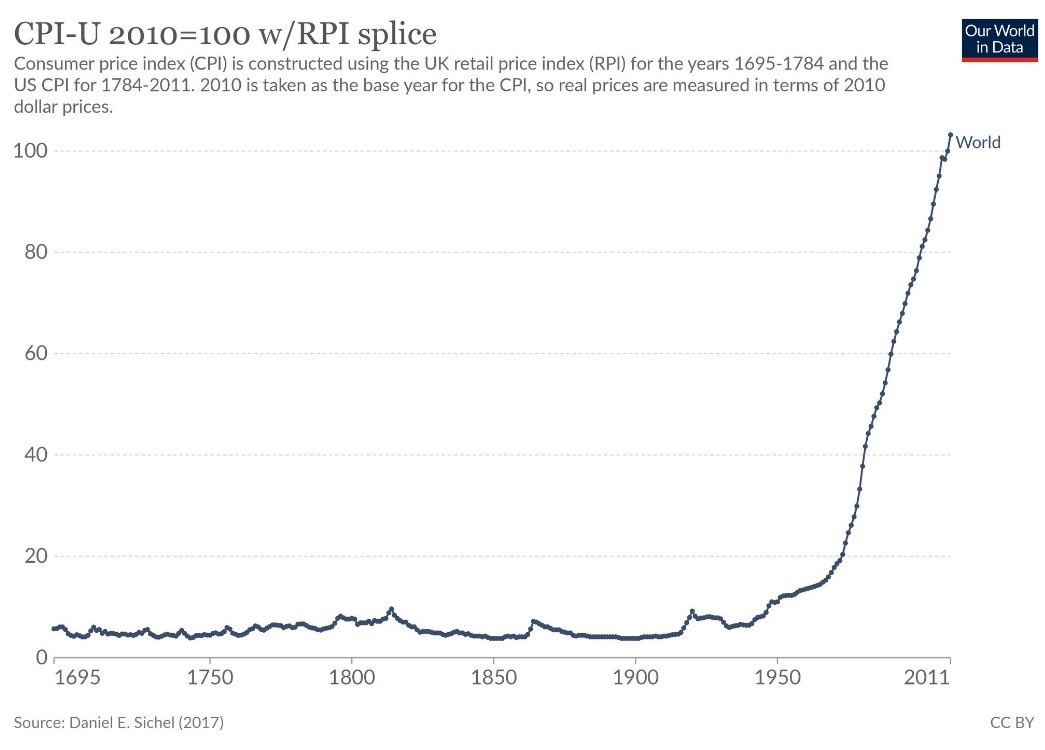
It's an objective fact that around 2020/21 more OTC tickers (many being long dormant shells) made long term (at least 5 to 10 year) higher highs than ever before in the OTC's history. Since then many of those have gone on to make long term higher lows. This is an objective fact but the implications of this is where there's room for debate.
The VAST majority of traders believe that the 2020/21 OTC bull was a one off event and it only happened because of the pandemic and the stimmy checks. My point is that OTC runners have historically almost always been huge rallies on charts that were stuck in long term perpetual downtrends. Ever look at a long term chart of your penny stock and look at the death spiral over the years? Thanks to reverse splits and dilution you'll see charts that say the stock traded in the thousands or 10s of thousands because of splits and dilution. Historically there is no floor on an OTC chart, at least not one that lasts very long. The longer you zoom out of an OTC runner, the more you will see that it's just a small blip in the big picture. I know this because I've literally done just this for nearly two decades!
2020/21 blew me away because it wasn't just new 52 week highs or even 2 or 3 year highs, it was 5 - 10 year highs, if not longer, and they were all over the place. Like I said, it's an undeniable fact that the OTC had more long term higher highs during 2020/21 than ever before. It's also a fact that there have been more long term higher lows than ever before. OTC traders don't appreciate what this actually means because historically it just hasn't happened nor has it even been relevant to making money in the OTC. All we know as OTC traders is stocks that are stuck in long term downtrends that become so oversold that finally the dirt cheap float is accumulated, then it's pumped - often very hard - only to go on to a lower high and then the dilutions and reverse split takes it right through the floor. This has virtually always been the case and the exception to this, ie the OTC charts that actually managed to produce long term higher highs and higher lows, were the rare breed that actually managed to uplist to better exchanges. You don't need a SET pattern to make 10x or even 100x in the OTC, but if those moves just produce a lower high and then a lower low, there's no secular strength to build off of - hence why OTCs are generally just seen as pump and dumps that you need to get in and out of ASAP.
My theory revolves around the fact that these long term bullish patterns didn't happen purely by chance and if there was no substance to my claim then all of the tickers which made long term higher highs in 2020/21 would have sold off and then broken below the floor/low of the pre 2020/21 explosion. To put it another way, if the huge breakouts (again 5 - 10 year highs if not more) were all just entirely empty pump and dumps, then the historical OTC pattern of new secular lower lows and then lower highs would have kicked back in. In fact I'm perfectly OK calling those moves in 2021 pump and dumps, even the ones that made long term higher highs, but if the dump doesn't make a new lower low then there just might be a much bigger pump coming. THAT is the essence of the SET patterns.
Why am I so high on the SET pattern? It's not that I don't think other OTCs will run in a bull market again, but the ones with the standard long term lower lows and lower highs will all have headwinds like they always do. They may run 10x or 100x, but if the long term trend is still lower highs and lower lows then the bears still have control over the long term winds. However if we see OTCs that are currently in position to confirm continuation breakouts to new 10 year highs, those by definition should have all sorts of long term tailwinds that the bearish secular patterns won't have. And like I've said countless times, the tickers that have this pattern I believe have the pattern for underlying reasons. I believe the chart strength or lack of bearish long term momentum simply doesn't happen by accident. Charts are reflections of everything going on behind the scene and reflects the neverending battle of supply vs demand. Price trends matter quite a bit, especially the longer the time frame as you step back.
Please take this last paragraph to heart because I don't want to mislead people. #OTCSET patterns are not automatic buys. They're not tickers I think are going to necessarily make you a ton of money right away. You should always use discernment and do your due diligence. My point of emphasis is that if I'm correct, over time we will see tailwinds behind these bullish setups and an unprecedented number of bullish long term OTCs, something I can say I have never seen in my almost 19 years of trading the OTC full time. The odds of an OTC actually making it through all of the hurdles and obstacles to actually succeed long term are very low, but my theory suggests that these setups will have some of the best chances for sustained success, especially as the OTC environment improves. Or were it to improve. Take all of this with a grain of salt and don't just automatically assume #OTCSET = buy right now. It means I like the chart quite a bit and think there's possibly a lot of potential there. You do with that information what you will.
1
5
14
864
WorkinGreen retweeted

8 Dec 2024
🚨JOE LONSDALE: "People don't realize just how broken Government bureaucracy is. Think of the worst company you know in silicon valley that went bankrupt 30 years ago and imagine someone just kept pumping money into that company. It's more retarded than anything you've seen in a long time.
America used to have hard tests to get into positions where you could make decisions. Then in 70s we said tests were racist and we can't fire people; so the last 40 years things got dumber and then in the last 10 years we added in virtue signaling. So now things have gotten beyond broken.
You have to take a chainsaw and cut a lot of broken stuff and then you have to make sure it doesn't get stupid again. We must bring back tests, we must bring back accountability."
@JTLonsdale
648
3,794
16,391
23,901,467