
Dad, husband, Gym-rat * Helping apps make more money @RevenueCat * very into mobile * social gaming alumni * he/him * #chaoticgood
Joined June 2018
- Tweets 5,216
- Following 1,349
- Followers 4,885
- Likes 11,103
713 Photos and videos


Pinned Tweet
If you're vibecoding a B2C app, I’m probably more invested in your success than 99.99% of people out there
(@RevenueCat only makes money when you make money)
But time for a little reality check
102
70
1,378
314,864


Jun 11
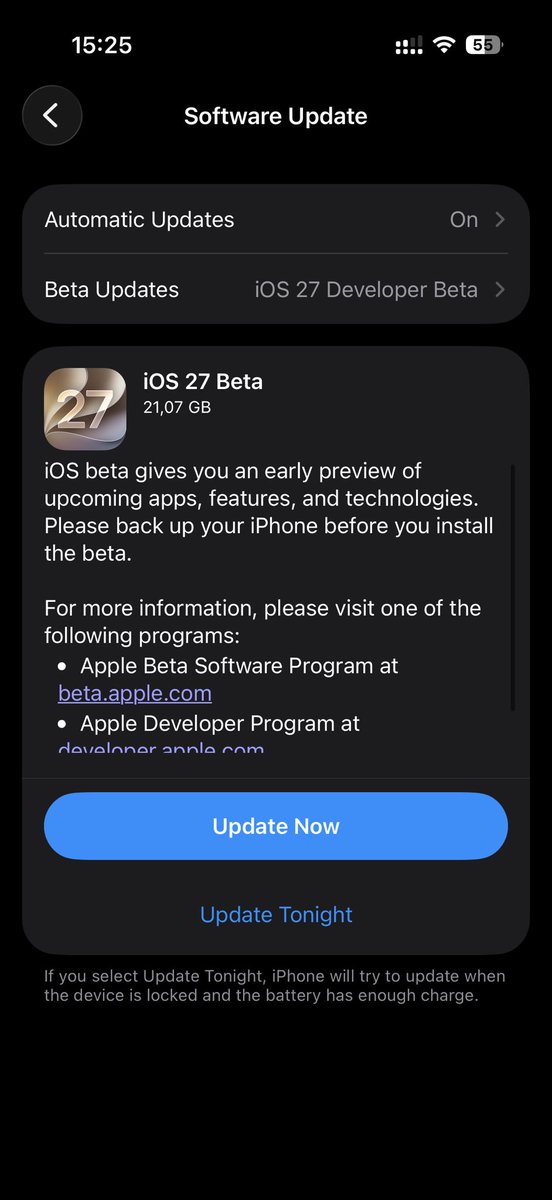
Building something new for iOS27? Do I have the hackathon for you…
4
6
45
9,601
Jun 11
Super tempted to try this out in an app:
Jun 11

What if you let users pick their own price?
In this hands-on tutorial, @plahteenlahti shows you how to build a "name your price" paywall for your app. One slider, five tiers, all unlocking the same lifetime entitlement. Drag to whatever feels right 👇
4
1
35
10,698
Hendrik Haandrikman 🐈 retweeted

Jun 10
To @RevenueCat users, remember to change your Refund requests handling preference! It lowered our refund rate by 50%🙏🏼

9
5
146
16,693
Jun 10

Dark Rico activated... but don't listen to this, RC is going to patch this
3
1
9
3,199
Ain’t no party like a


2
1
23
1,721
I’ve been to a lot of hotel gyms. This might be the craziest thing I’ve ever seen in one
3
14
1,656
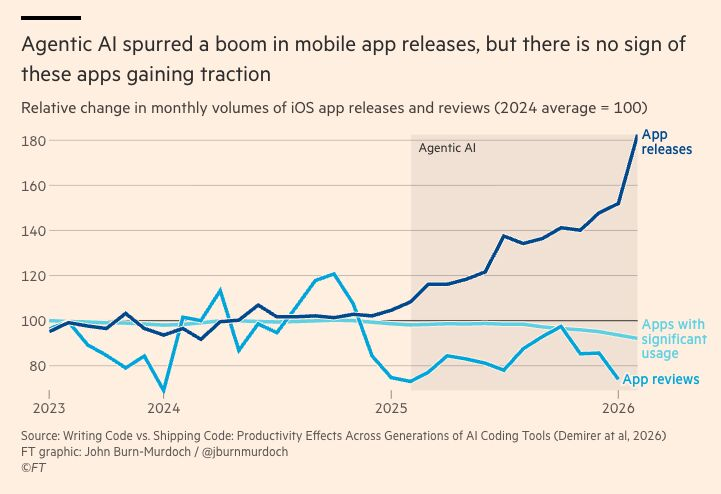
You’ve probably seen this chart. It doesn't say what people think (or claim) it says
It uses review volume as a proxy for “engagement,” while Apple has been cracking down on aggressive/early review prompts
Unless review volume for large apps stayed flat, this isn’t measuring usage. It’s just putting two unrelated trend lines next to each other
Download estimates from @appfigures or @SensorTower would’ve been a much cleaner check
Maybe one for @arielmichaeli to dig into?
1
1
13
1,915
Without an explainer on what those lines mean, this chart isn’t particularly helpful
Both of the lines other then “app releases” are based off of reviews:
The absolute number of app reviews is down (which seems more likely to be a consequence of Apple’s increasing restrictions on how and when you can prompt users for a review)
“Apps with significant usage” is defined as apps that have at least 10 reviews in their first x months, which is based on reviews which already aren’t a good proxy for engagement


3
2
15
4,580
It’s the moooost wonderful tiiiiime of the yeeeeeear
Jun 5
#Shipaton 2026 planning is in full swing, and we want YOU 🫵 to help us bring the world's largest mobile hackathon to your community or campus
Developer meetups, indie hacker groups, and student organizers can apply now to host a Shipaton IRL Event at shipaton.com/events
1
11
1,306
He-Man has a message for all you new app developers out there
1
1
13
1,462
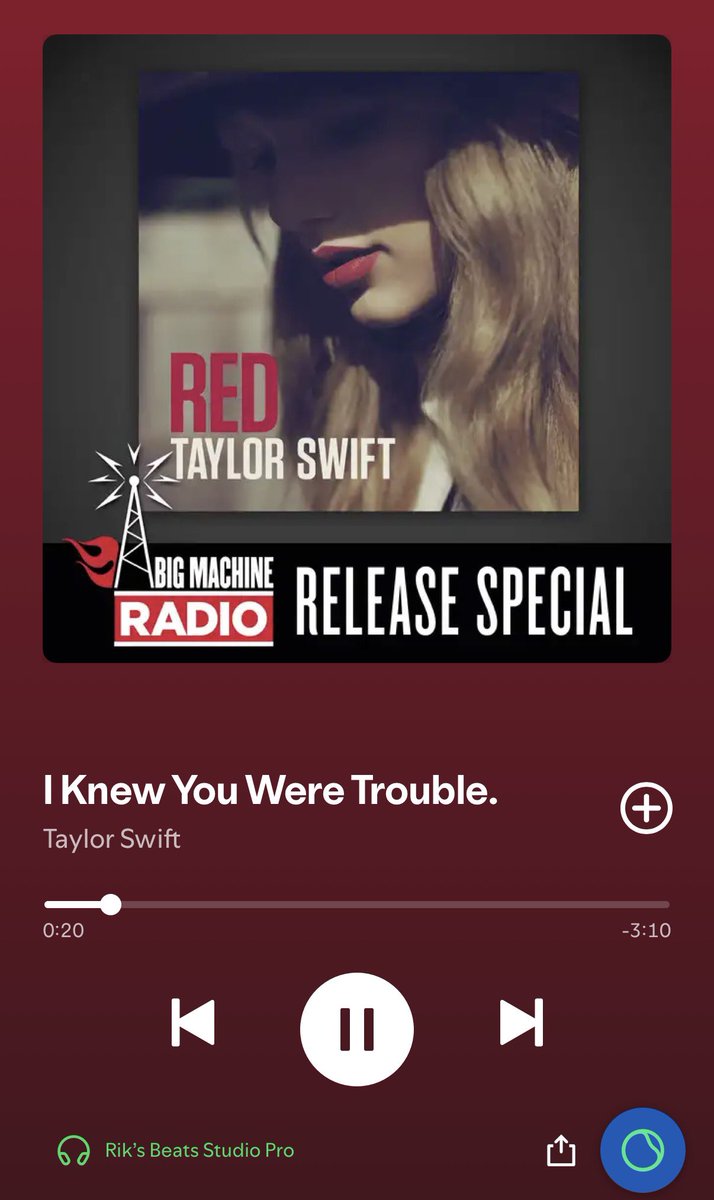
.@Spotify AI DJ: “These next ones are your karaoke favorites. The songs you belt out when you let loose”
You know me too well, Spotify 😂
1
1
852
Hendrik Haandrikman 🐈 retweeted

Jun 5
Working on a course on how to sell your app with @RevenueCat. The course will be free.
What topics should we cover?
7
1
32
3,746
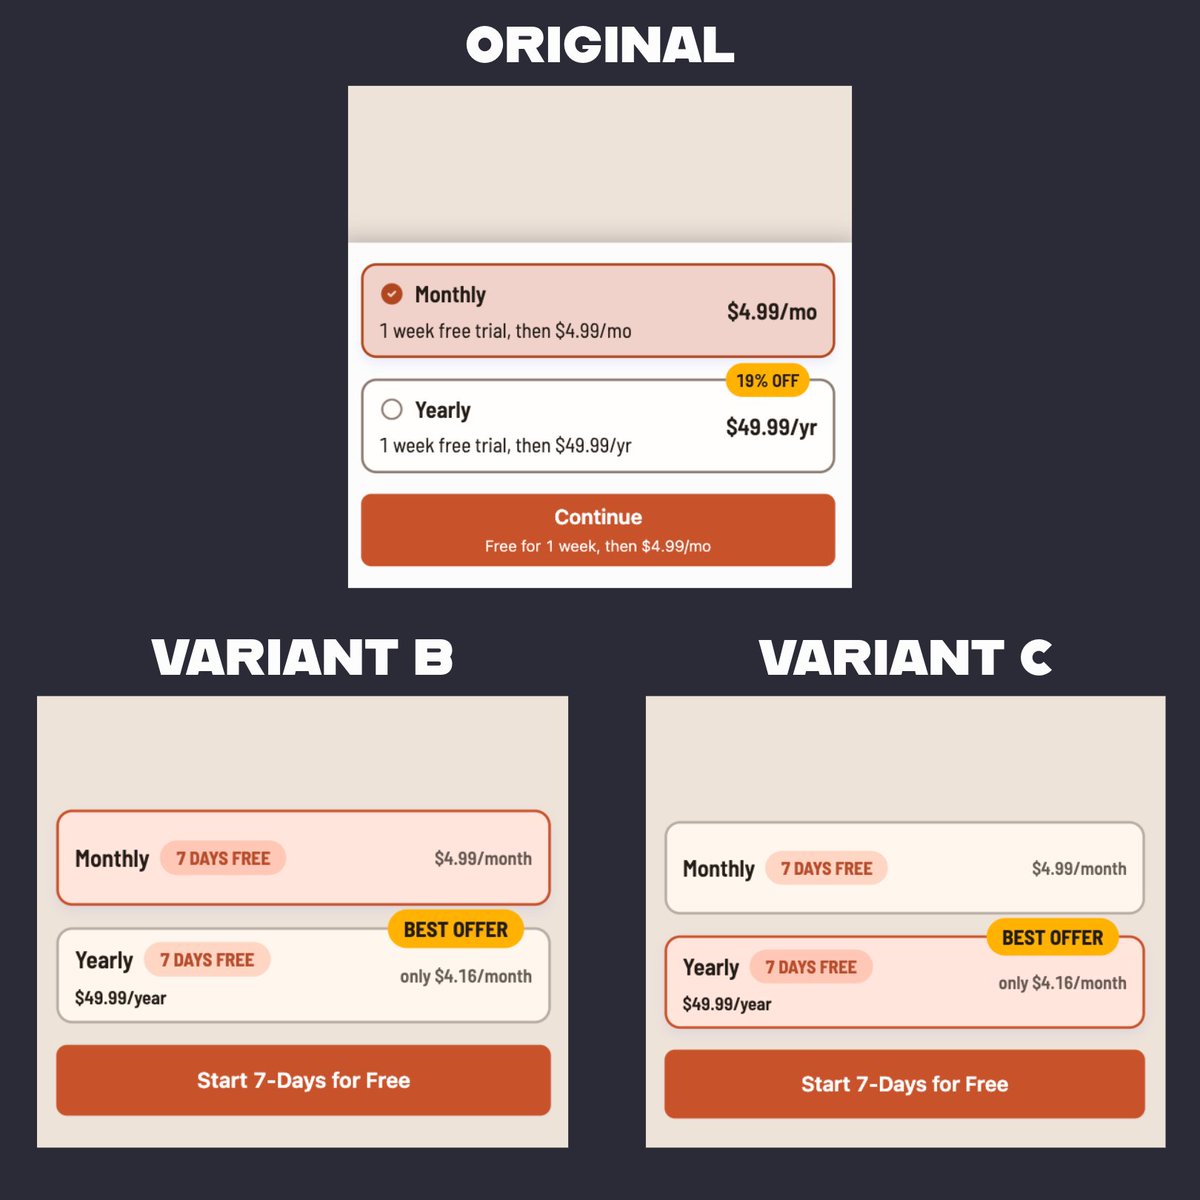
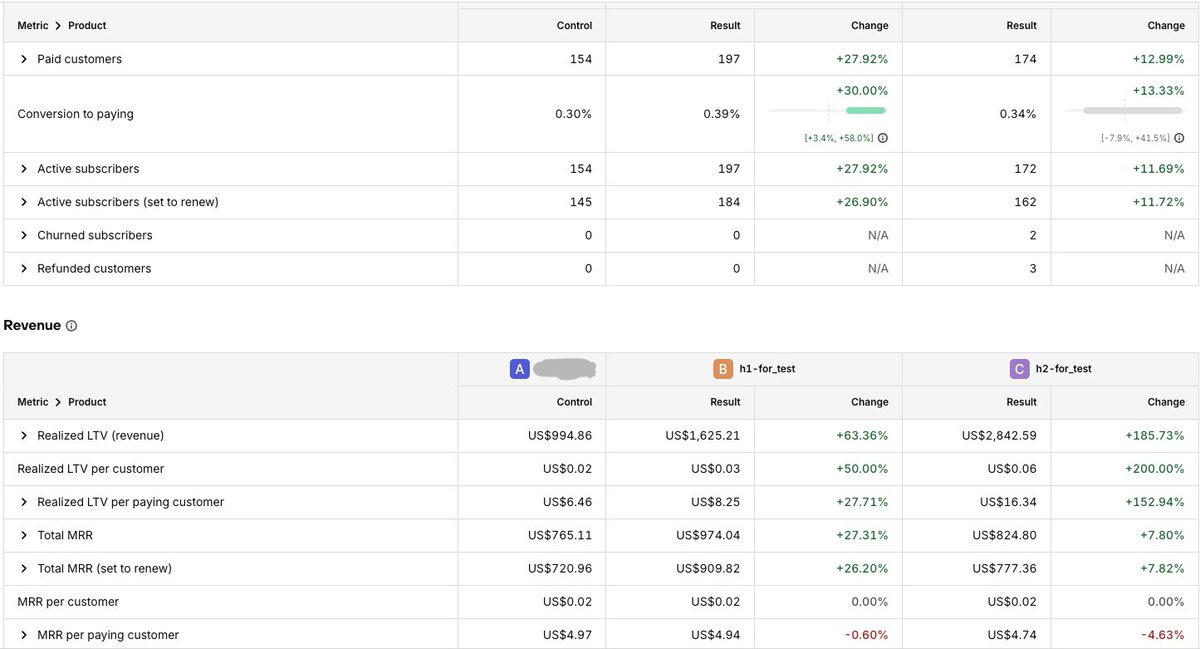
1. Better highlighted the trial
2. Included cost / month for the annual plan
3. Updated the CTA,
and in variant C:
4. Pre-selected the annual plan

This is your regular reminder to set up experiments in @RevenueCat
This was an app's very first experiment. Which version would you pick as the winner? And can you guess what the experiment was?
3
16
4,746
This is your regular reminder to set up experiments in @RevenueCat
This was an app's very first experiment. Which version would you pick as the winner? And can you guess what the experiment was?
7
19
10,977
LAST CALL to join @RevenueCat's app founder Mansionparty during hashtag#WWDC next Tuesday
If you're a scaled ($100k / month ) app founder or app growth leader, DM me for one of the 5 last spots. If you're not quite at that scale (yet), keep an eye out for our next Houseparty, coming soon!
Schedule:
1:00 – 5:00: Drop in and co-working
5:00 – 6:00: Food & Drinks
6:00 – 7:00: Lightning Talks
7:00 – 9:00: Networking
Over $1B in annual revenue already confirmed to attend 🤯


13
13
84
10,778
May 29
If you use @RevenueCat to run experiments, HIT THIS BUTTON
RICO is built on the insights derived of $10B in revenue, and - for this experiment (that looks like it's won by B) - picked C as the winner with 80% confidence, and explained why (in detail)
It's shockingly good
3
1
36
3,172