
Macro/data-driven crypto investor. Founder BlockPhi
Joined November 2022
- Tweets 3,134
- Following 383
- Followers 1,734
- Likes 4,774
864 Photos and videos


Pinned Tweet

1 Nov 2024
Checkout my latest in-depth interview with Michael Howell, Managing Director of @crossbordercap
In this interview, Michael explains:
- Key Drivers of the Global Liquidity Cycle
- Bitcoin’s Correlation with Global Liquidity
- Bitcoin Valuation Model: P/M Ratio
Links below ↓
37
21
177
44,173
Jun 11
Agree with the caveat.
Not all liquidity has the same transmission.
Bitcoin responds most when flows come through channels that are actually likely to reach crypto markets.
Jun 11

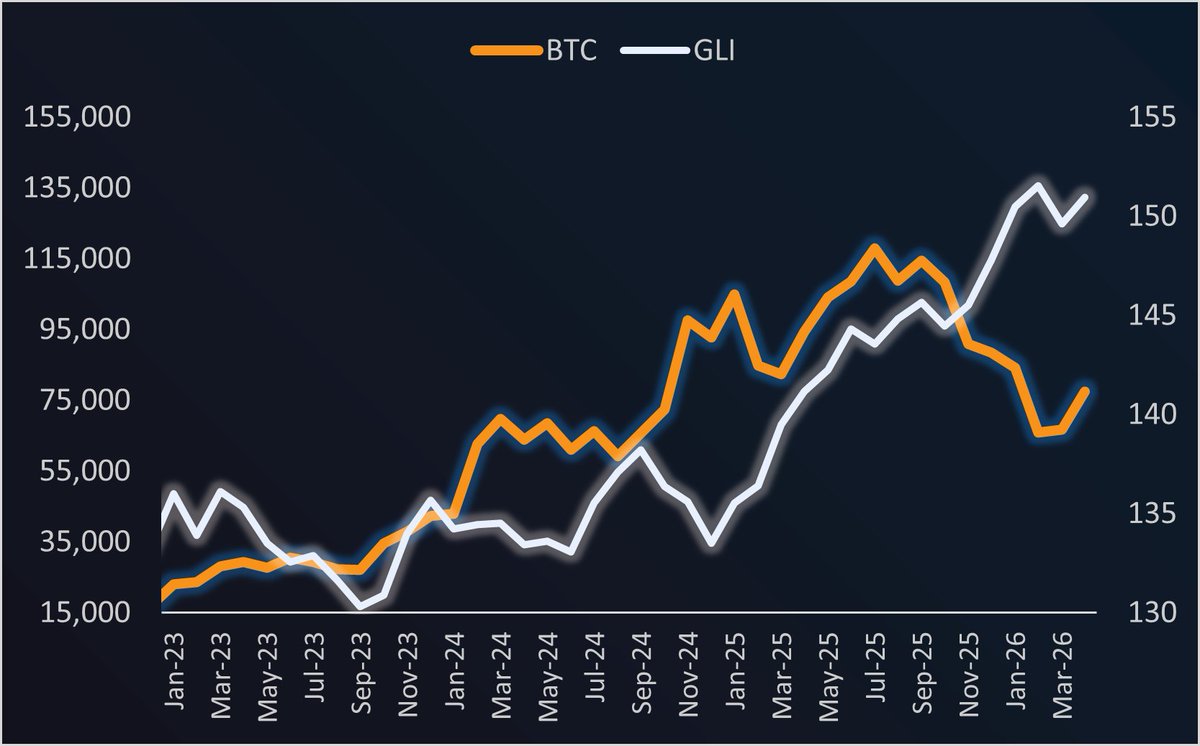
Every crypto account celebrating GLI for $BTC is wrong.
I’ve spent a decade in institutional crypto and stocks.
13 central banks are expanding right now.
The three that actually move capital into Bitcoin are not.
The Fed.
The ECB.
The Bank of Japan.
Combined they sit at multi-year lows.
-1.23 in my model.
Bearish.
Bitcoin CANNOT rally in these conditions.
GLI is being propped up by smaller economies with almost zero transmission into crypto markets.
What changes this?
When the Fed joins the expansion.
That won’t happen until the Iran war ends.
That’s the only liquidity signal that matters.
Not your GLI x BTC chart.
Not another Raoul Pal video.
1
117
Jack Green retweeted

Jun 5
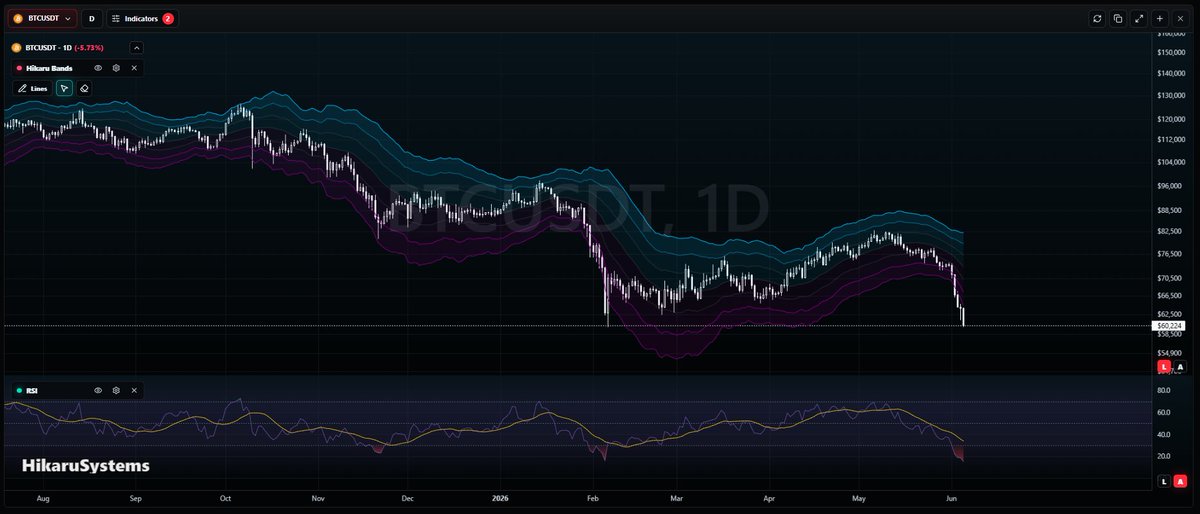
bitcoin:native off the volatility bands🚨
If price were to fall back to Hikaru Bands' average, it would be a 15% recovery.
Per RSI, it's currently at 2020 COVID crash levels.
Global Liquidity-wise, no big surprises! (by @JackGreenCrypto)
DYOR!

1
4
9
370
Jack Green retweeted
May 24
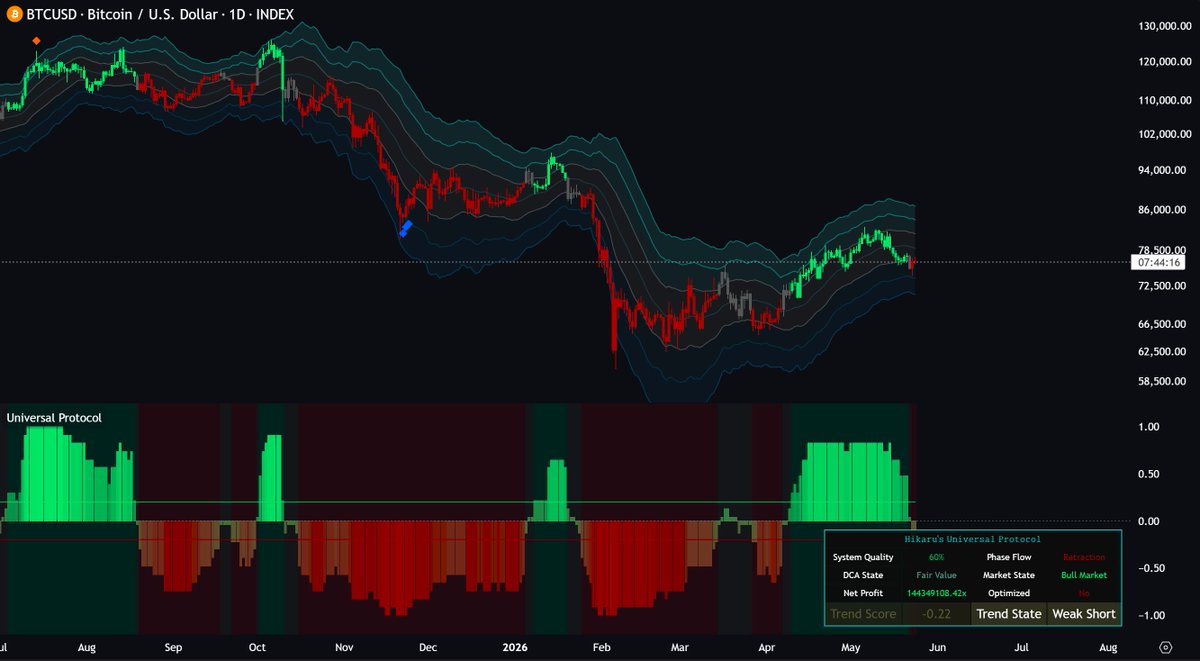
While your classic trend indicators have gone Risk-Off for bitcoin:native there are many altcoins doing their own thing,
A sign of encouragment for wider a Risk-On enviroment is the Global Liquidity RoC by @JackGreenCrypto
A great time to sharpen your systems and approach.
DYOR!
3
17
511

GM!
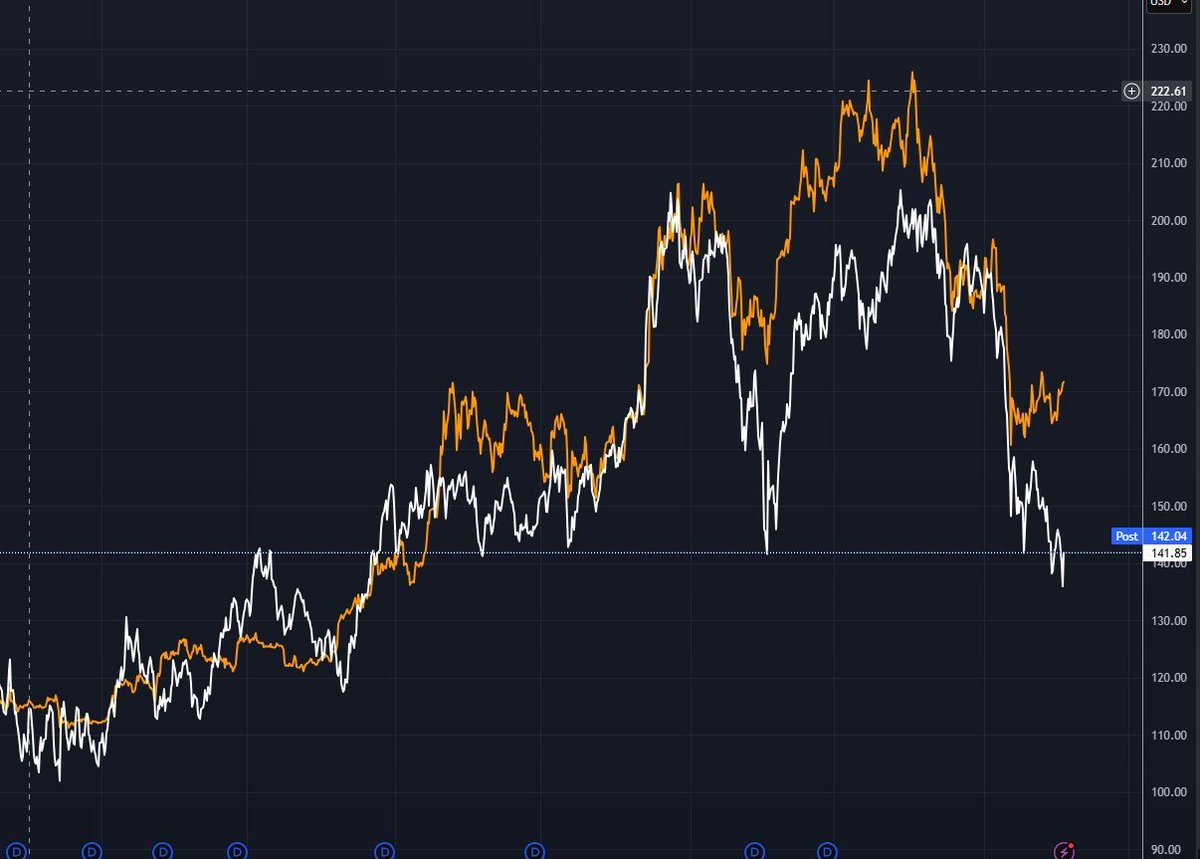
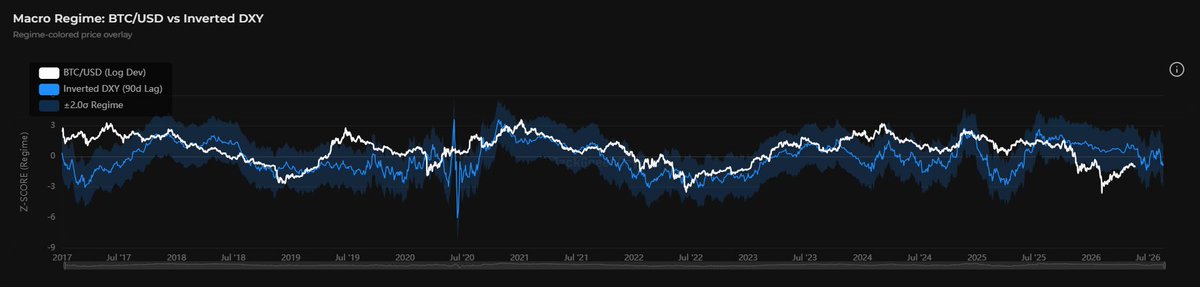
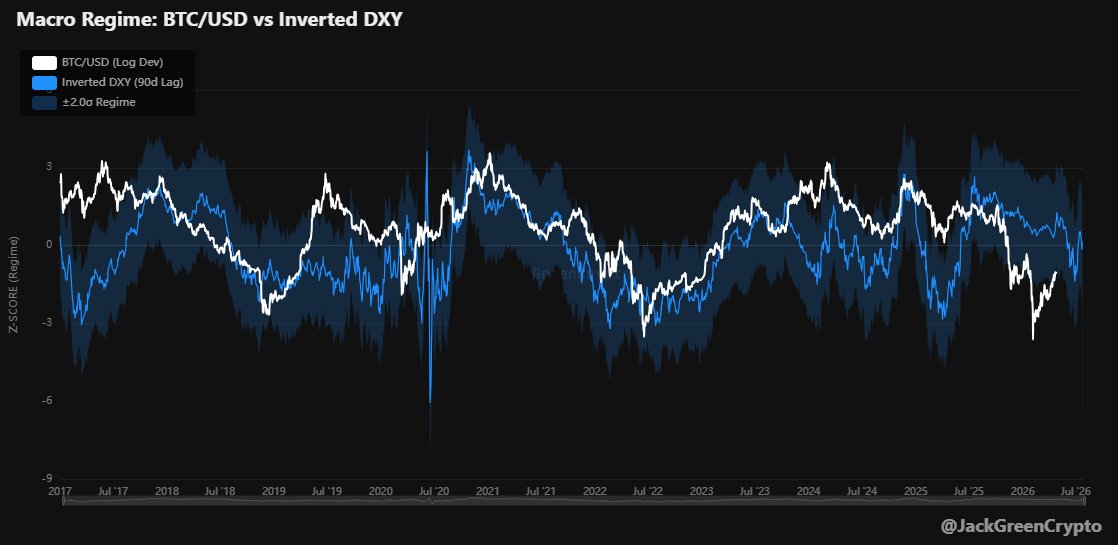
The 90-day-lagged inverted DXY indicator acts as a leading proxy. Dollar moves take time to reach risk assets. In a nutshell, what the dollar did three months ago is lined up against where $BTC trades now. BTC sitting below that line means it has underperformed what the earlier dollar setup would normally point to.
The gap between price and the midline is a representation of where BTC sits relative to the inverted dollar action. In this case, BTC looks to be priced close to -2 standard deviations away from where it should be. The chart here suggests a bearish outlook with a small possibility of price consolidating towards its implied "fair value"; even then, downward pressure still wins.
Three probable outcomes:
- Mean reversion: if the lead-lag holds, BTC is behind and closes the gap by moving up or consolidating (refers back to what I mentioned above).
- Regime break: correlation to this metric breaks and BTC breaches above it. Same way it happened with the famous M2 charts last year when the correlation flipped negative.
- Correlation remains: BTC maintains its relationship with the inverted dollar and nukes for the next month or so.
What decides it? Direction. A narrowing gap supports mean reversion. A widening one means the correlation is breaking down, and that's the riskier setup. The lag is the whole point. Without it you're plotting two correlated lines and calling it confirmation. The 90 days is what turns the second line from "these move together" into "this one moves first." It's also worth stress-testing, since that lag drifts with the macro regime.
@JackGreenCrypto's metric.
1
1
6
433
Jack Green retweeted

May 21
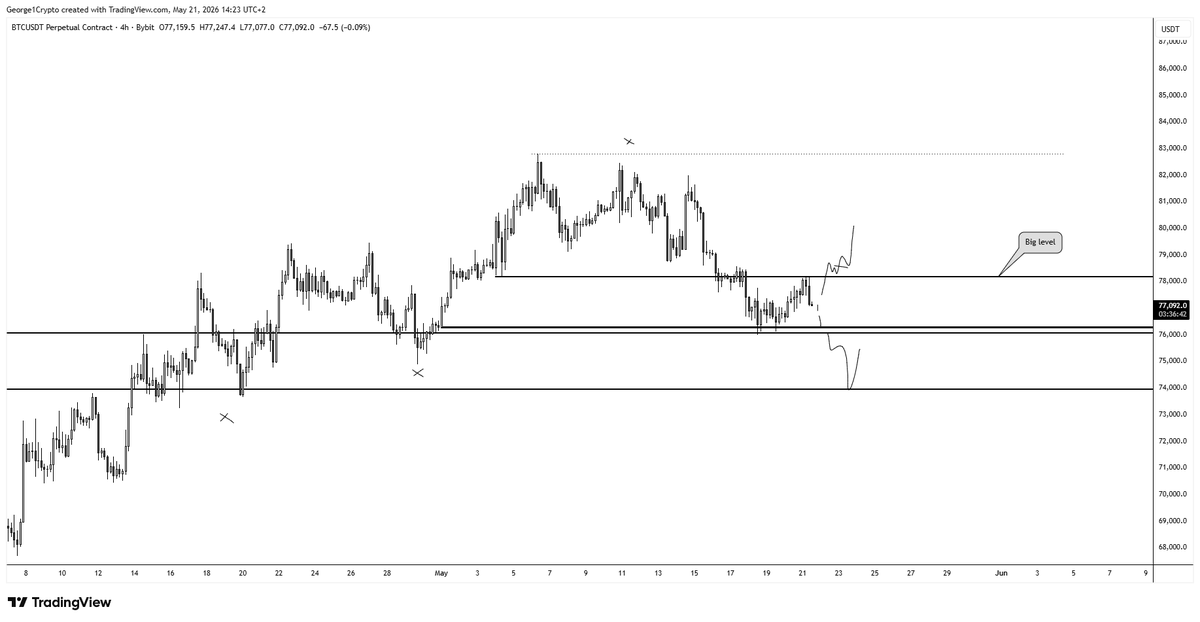
#btc Here's me explaining my chart hope you find value cheers
May 21

#btc Looking a bit shaky here. Big weekly level got rejected and tbh, I want to see that reclaimed here asap. Do so before the daily close and we should be good for higher but if we don't and the day closes red, I think there's a bigger chance we go for some lows next.
8
7
150
19,714
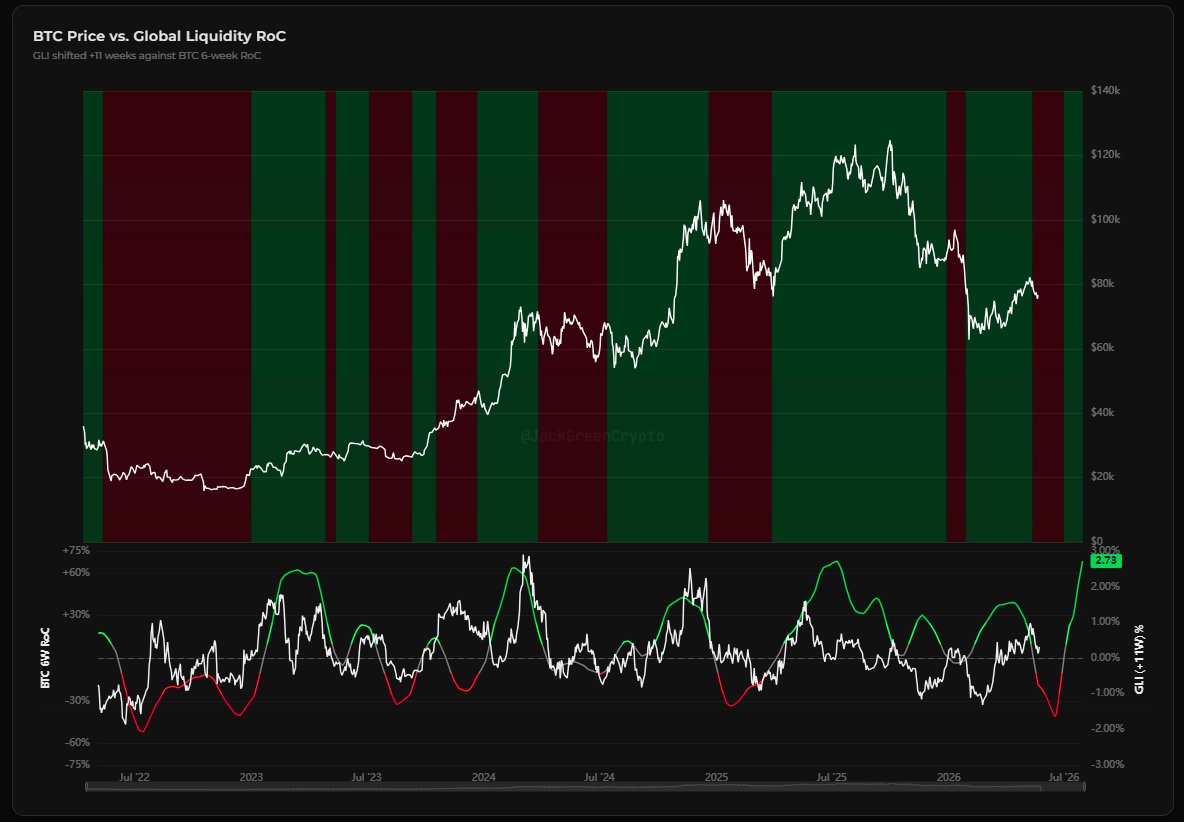
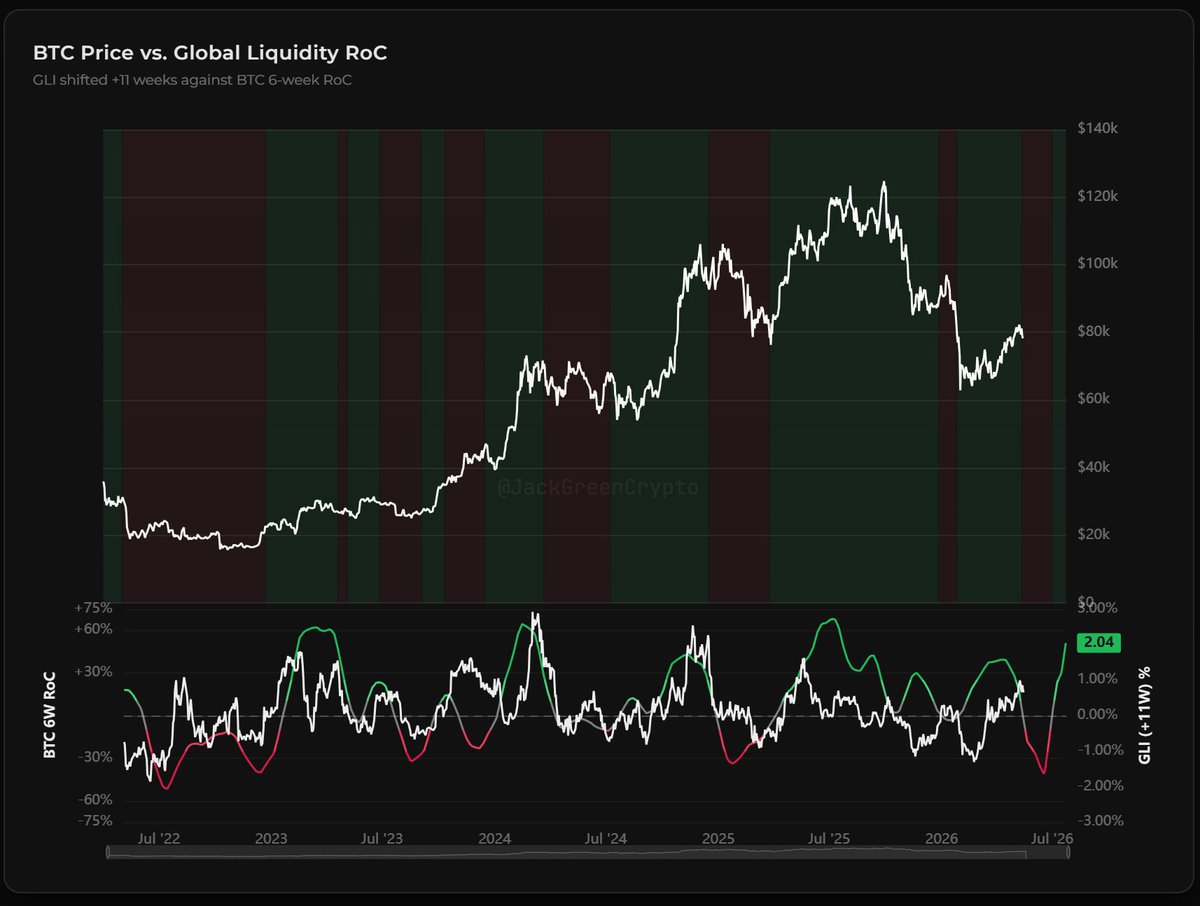
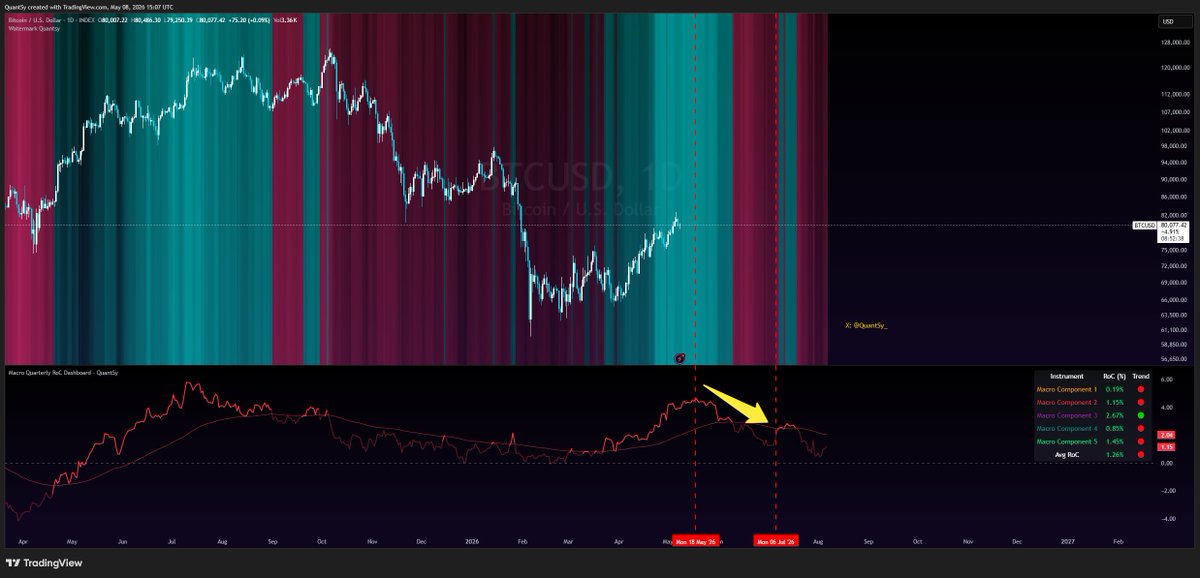
Two different macro tools are aligned with a current risk-off regime for $BTC.
The 3M and 12M annualized RoC in Global Liquidity is signaling that the current market state is not in favour of growth (pink and green plot).
The GLI ( 11W) & BTC 6W Changes from @JackGreenCrypto not only agrees with the above report but also suggests a high probability chance of seeing a risk-on regime only until around early July, 2026.


2
15
540
Jack Green retweeted
May 16
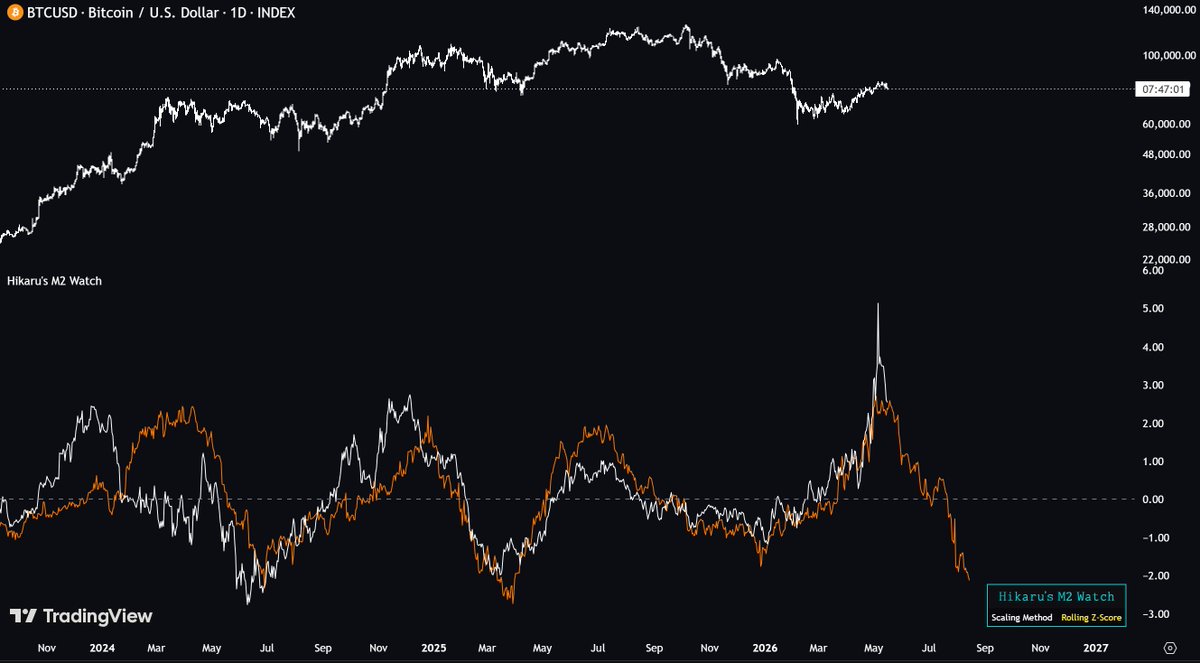
Beware the Global Liquidity path ahead of us!
1. Hikaru's M2 Watch
2. bitcoin:native Price vs. Global Liquidity RoC (by @JackGreenCrypto)
Could your systems survive a possible drawdown?
DYOR
1
15
627
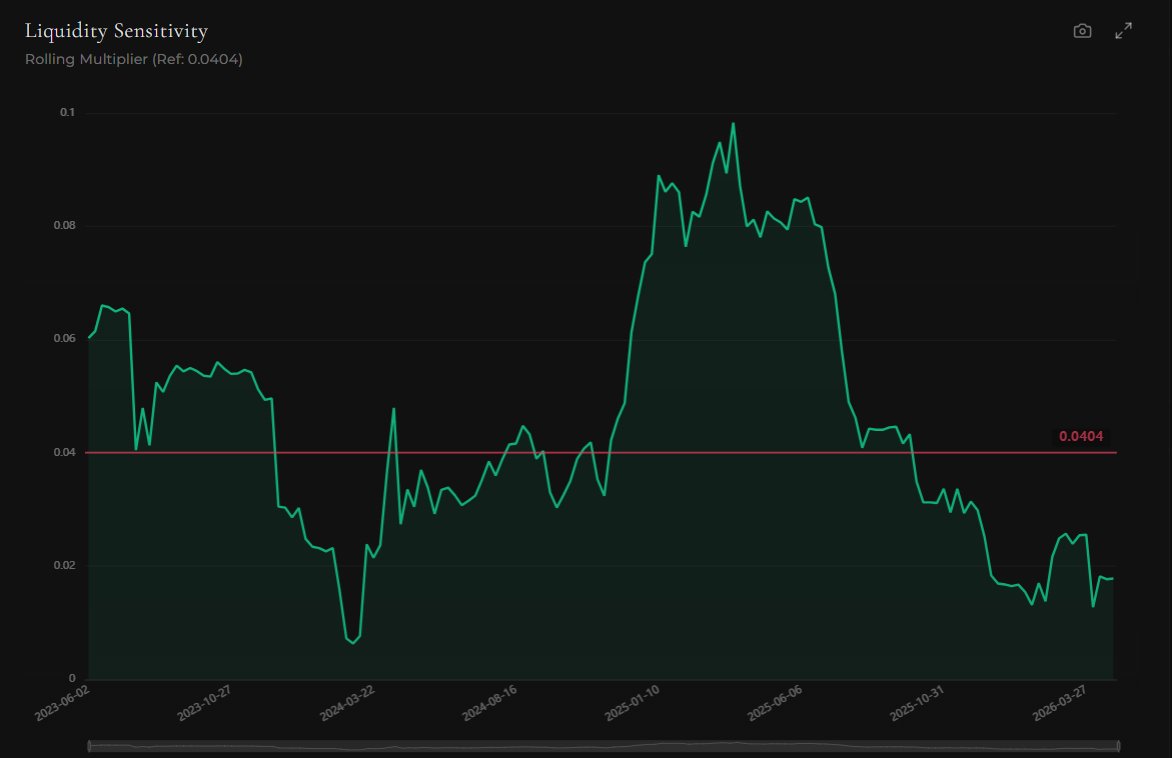
Bitcoin's sensitivity to global liquidity is not a constant. It's a regime that can be measured.
The rolling β coefficient, built out by @JackGreenCrypto measures how strongly BTC responds to a unit change in global liquidity over a trailing 52-week window. Full-sample reference: 0.0404.
When β sits above the reference line, Bitcoin is in a hyper-sensitive period where liquidity changes carry outsized weight. When β compresses below, the macro link breaks down, typically during idiosyncratic shocks like exchange failures or regulatory events.
Current read: β sitting near 0.018, well below the full-sample reference. Bitcoin is in a macro-decoupled regime.
Periods where β climbs well above 0.04 have preceded the strongest expansion phases. Sustained compression below the reference often coincides with macro-disconnected drawdowns where idiosyncratic flows dominate price action.
Liquidity is not always the driver. Knowing when it is matters more than knowing the level itself.
1
1
9
689
Jack Green retweeted
May 14
GM everyone, I joined BlockPhi (@JackGreenCrypto)
I hope you join us soon when the website is live, lots of great macro analysis soon.
In the meanwhile DYOR!

1
1
18
509
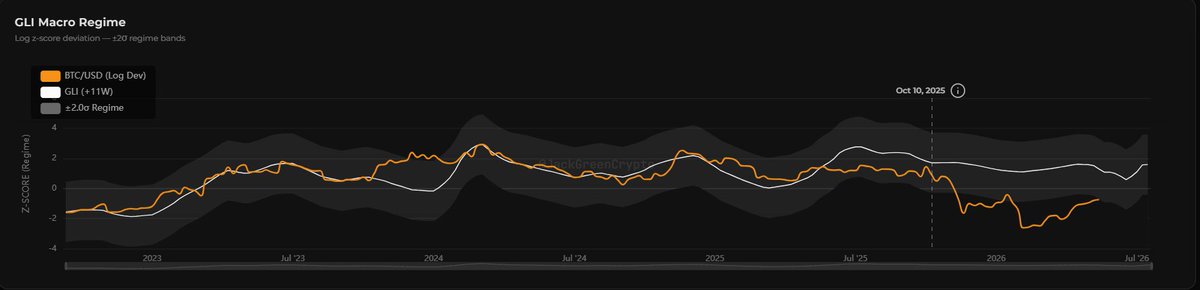
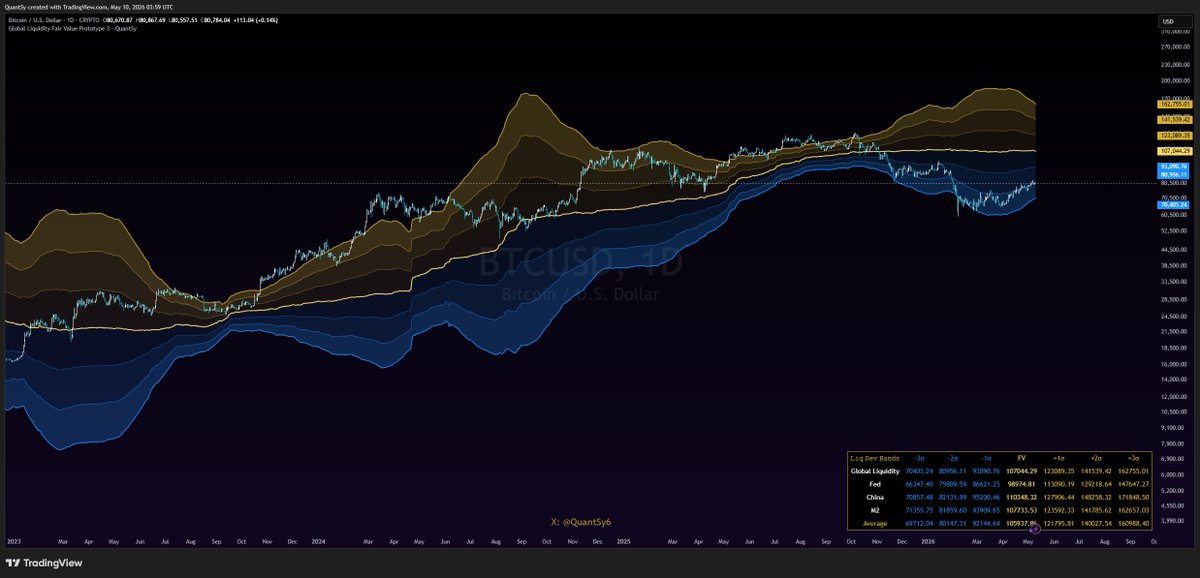
$BTC at ~$80.7K is trading below Global Liquidity Fair Value of ~$107K, placing it nearly 25% beneath where liquidity prices it.
Confluence layer: the GLI Macro Regime model from @JackGreenCrypto has BTC's log-deviation pressing the lower -2σ band since October 2025, while global liquidity itself remains elevated in regime terms. Liquidity never rolled over with price.
The dislocation is real, but so is the setup. Liquidity has held its ground, and price is beginning the walk back toward it.
1
1
16
797
Jack Green retweeted

May 10
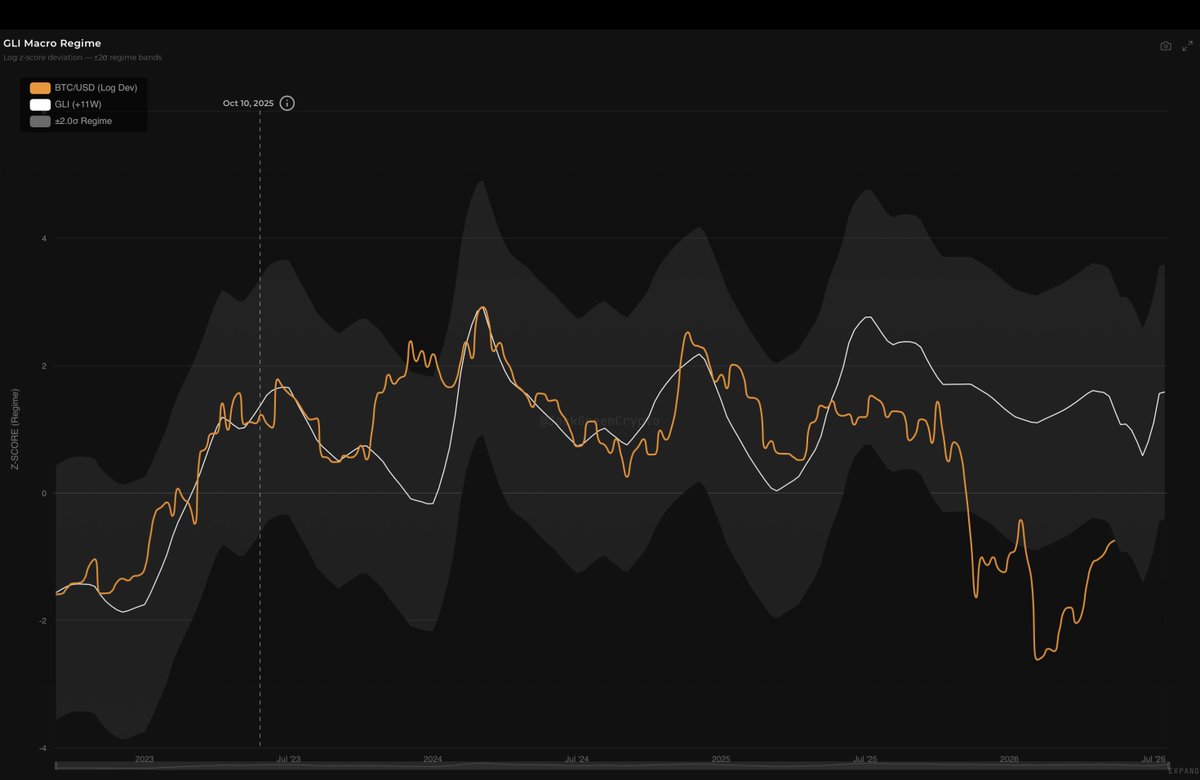
Looking at the GLI Macro Regime chart from @JackGreenCrypto
The GLI Macro Regime chart reveals a massive structural divergence that is currently resolving in favor of the bulls.
Strategic Outlook: Bitcoin is currently in an undervalued phase, rapidly climbing to "catch up" with the leading liquidity signal. This confirms that the recent lows were a significant macro deviation, heavily reinforcing our current RISK-ON thesis
4
12
1,087
Two independent regime signals now aligned:
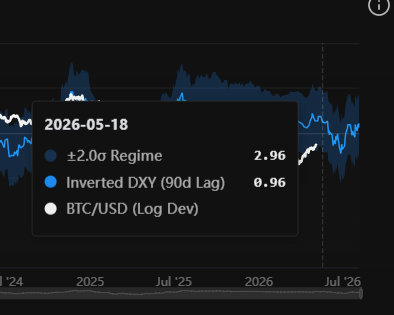
→BTC/USD vs Inverted DXY from @JackGreenCrypto : risk-off regime flagged from around May 18th to June 28th, 2026 before expecting some bullish pressure in the markets according to the 90 day lag posted.
→ Macro Quarterly RoC Dashboard: Global Liquidity RoC expected to turn negative after peaking on May 18th, 2026, then flipps to a risk-off regime on June 10th according to a similar 90 day lag.
What this means is that we can expect some down pressure in second half of May before the risk-off threshold is breached.
Negative RoC was the early tell. The threshold breach was the confirmation. Both clocks now pointing the same direction.

1
12
442
Jack Green retweeted
May 7
Tactical Liquidity Shift: Entering the Negative Regime
Looking ahead to May 19, 2026, our liquidity models indicate a transition into a negative state, with the Global Liquidity Index (GLI) projected at -0.44%.
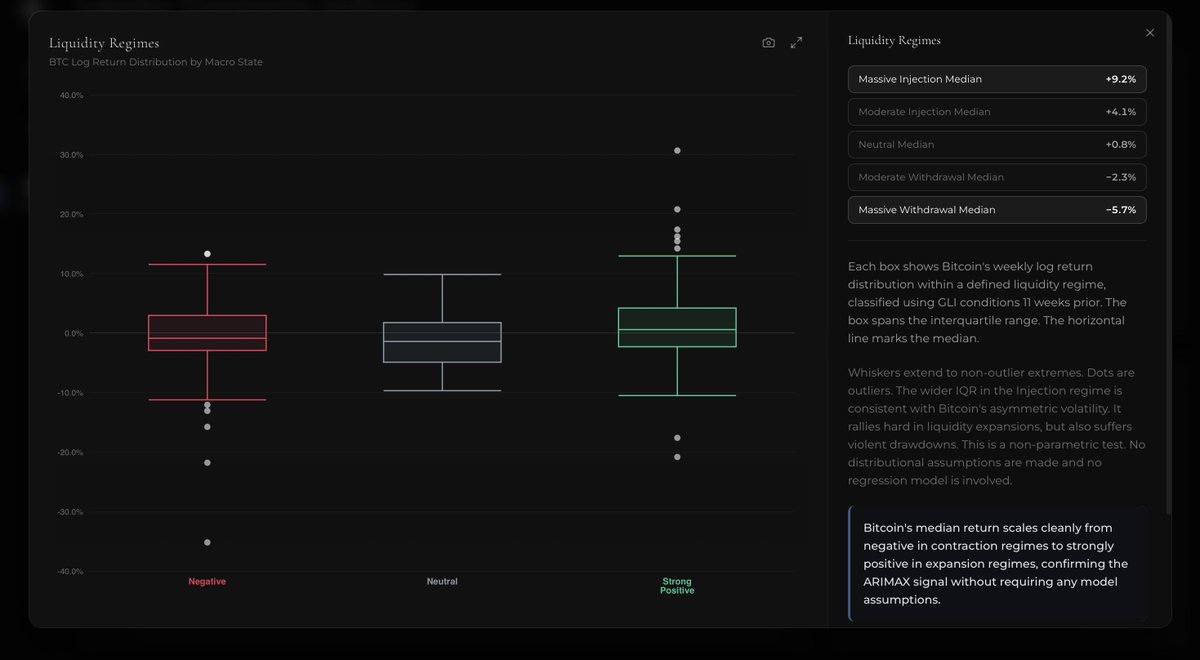
Using the liquidity regime chart from @BlockPhiCapital to define this macro state, here is what a negative liquidity regime implies for Bitcoin's performance:
Negative Median Returns: Historically, when liquidity enters a withdrawal phase, Bitcoin's median returns scale negatively.
Moderate vs. Massive Withdrawal: Data shows a Moderate Withdrawal results in a median return of -2.3%, while a Massive Withdrawal sees that drop to -5.7%.
Asymmetric Volatility: While Bitcoin rallies hard during liquidity injections, the "Negative" box plot confirms it is prone to sharp drawdowns during contraction regimes.
Distribution Shift: The horizontal median line in the red "Negative" box sits below the 0.0% axis, indicating a statistically higher probability of downward price action compared to neutral or positive regimes.
The Takeaway: As we approach May 19, the shift from a "Strong Positive" to a "Negative" liquidity state suggests a tactical cooling-off period where the probability of a drawdown significantly outweighs the potential for expansion.

1
1
6
445
May 2
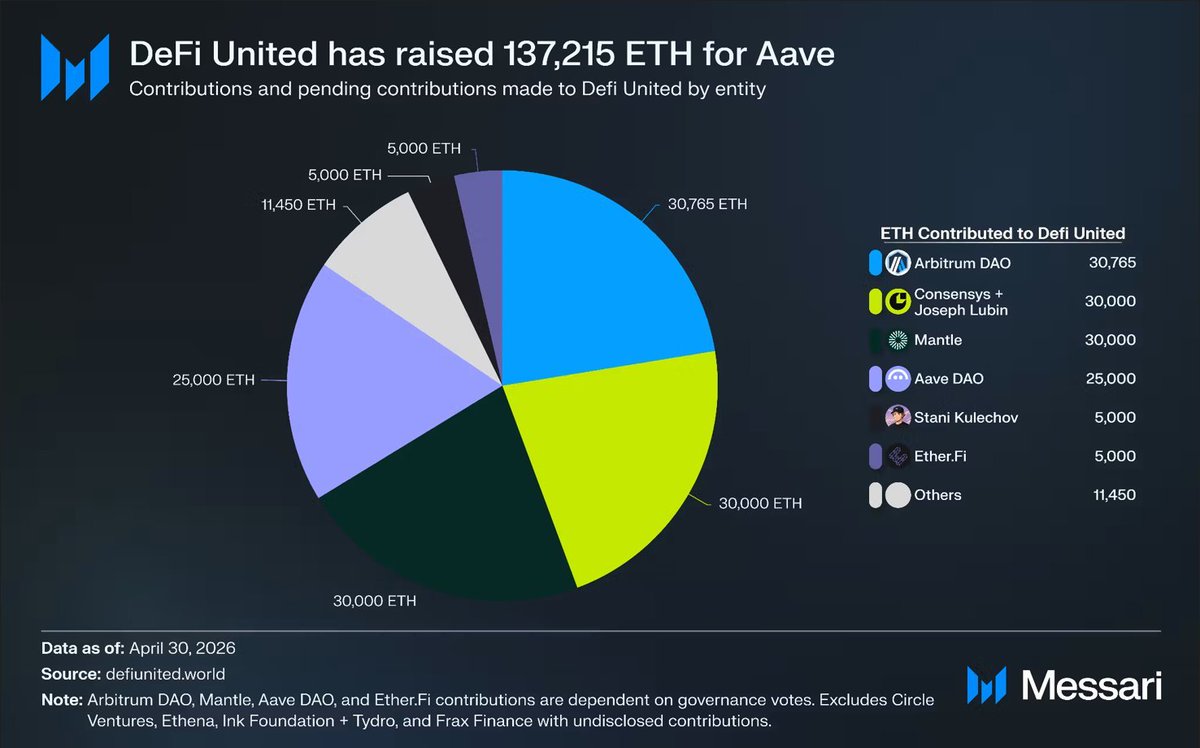
The Kelp DAO hack could have been DeFi's 2026 black swan. 116k unbacked rsETH dumped into Aave caused a massive liquidity crunch, but an onchain recapitalization prevented collapse.
The Defi United coalition secured 137,215 ETH to plug the ~$290M hole with Arbitrum, Consensys, and Mantle carrying most of the load.
No forced liquidations. Just DAOs and founders coordinating to cover the bad debt. Crucially, zero user funds were lost, the only ones taking a haircut were the attackers themselves.
3
4
312
May 1
What happens when the man setting global interest rates is an angel investor in DeFi?
Fed Chair nominee Kevin Warsh’s recent disclosure reveals equity in 30 crypto firms, from Solana and Optimism to Polymarket and dYdX.
His approach: strategic VC allocation into the infrastructure replacing legacy finance.
He literally calls Bitcoin a "policeman for policy" that flags central bank errors.
Though he must divest to take office, the baseline has changed. A blockchain literate Fed that opposes CBDCs is a massive macro catalyst for the crypto space.
2
287
Apr 30
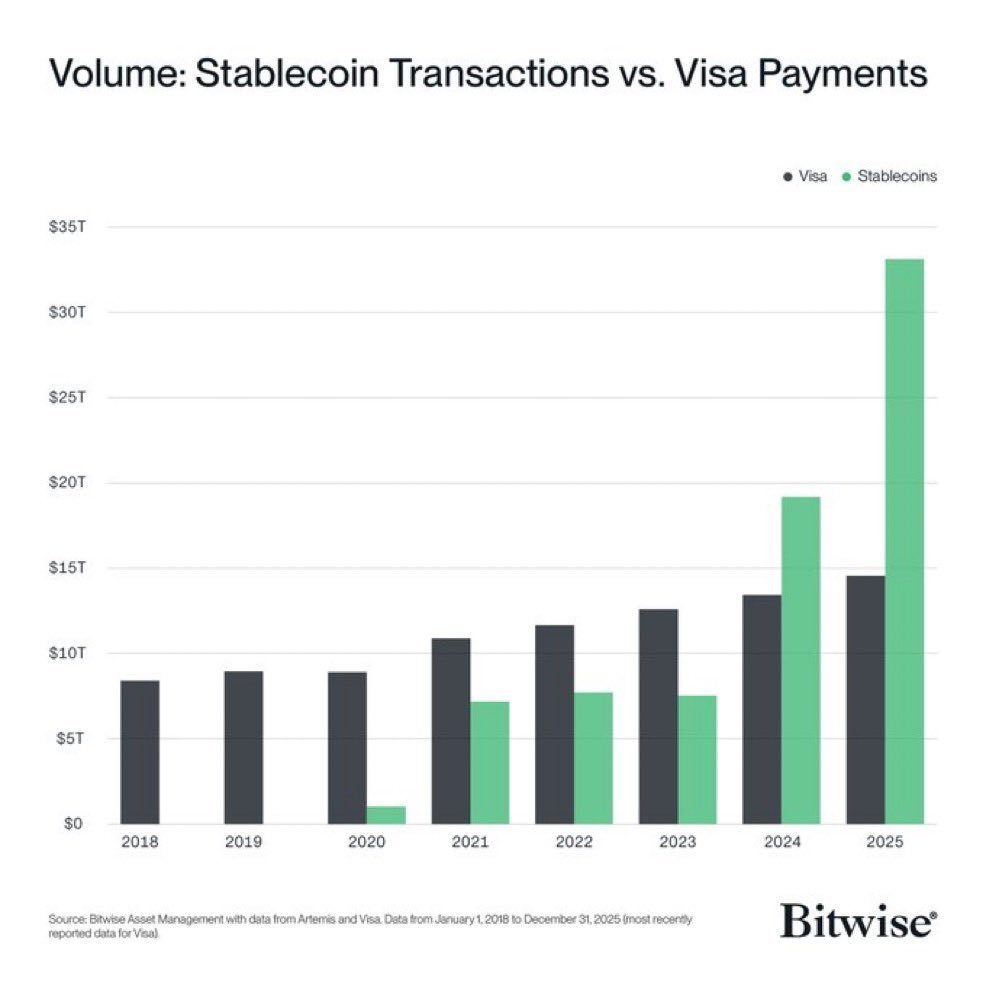
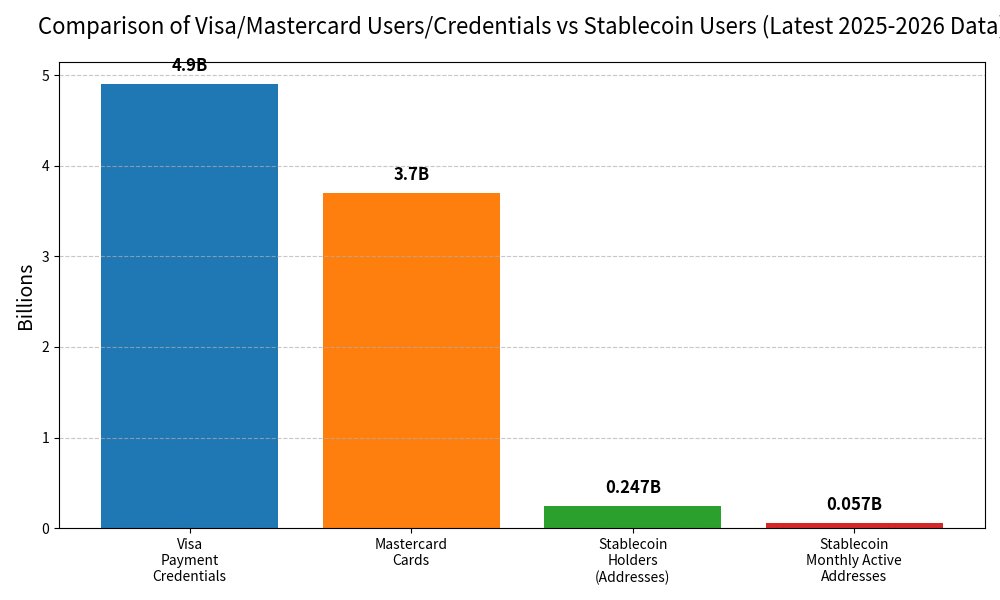
Don't be fooled by the trillion dollar stablecoin volume charts.
Stablecoin volume has indeed grown tremendously but the amount of users hasn't caught up yet. The average stable coin transaction is still over $5000.
Mastercard and visa are dominating the payment stack and their user count shows it, stablecoins have a lot more room to grow as there aren't that many users yet.
The trillions in volume are caused by arbitrage trading between exchanges, institutional settlements, and defi interactions.
User count is far more important than volume.
1
8
425
Apr 29
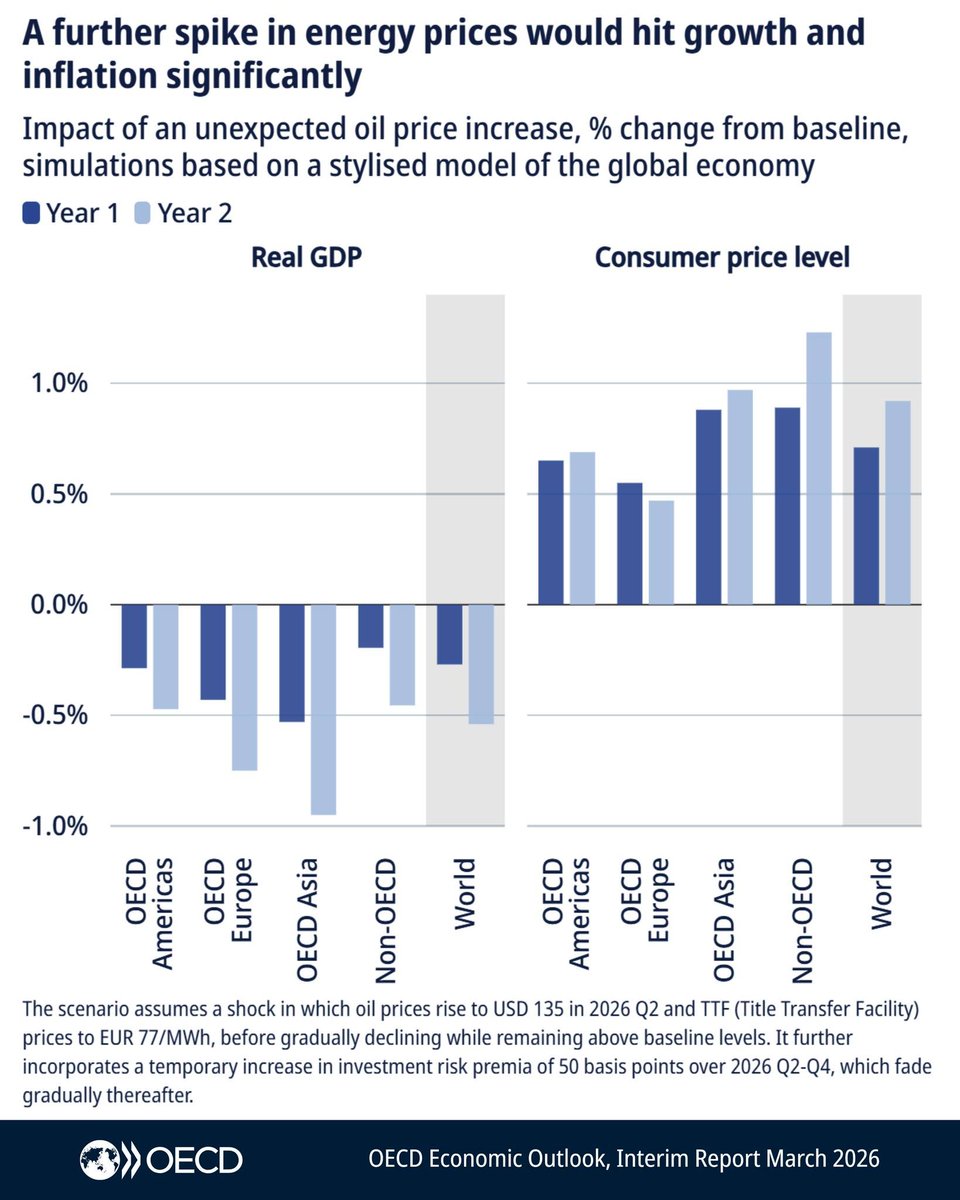
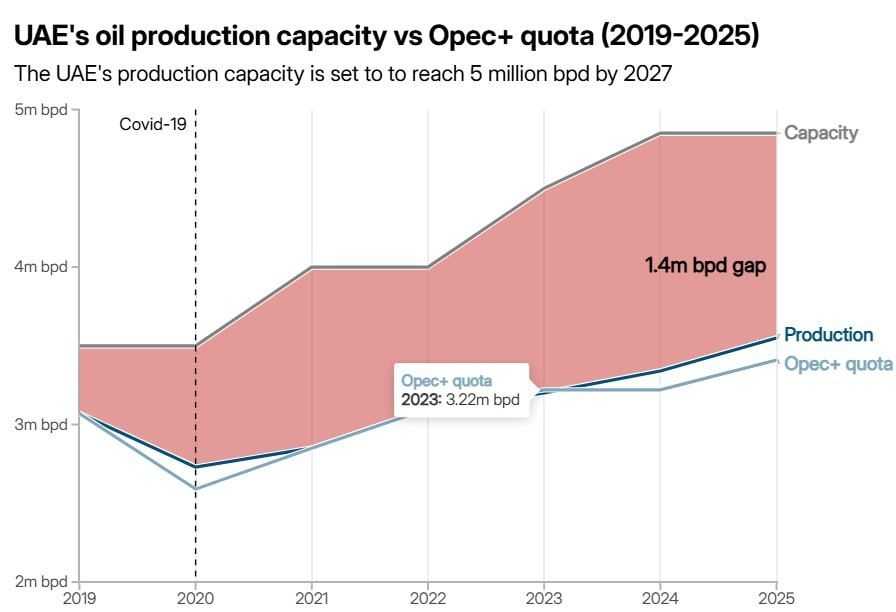
Oil dictates inflation. Inflation dictates the Fed. The Fed dictates liquidity. Liquidity dictates BTC.
And the UAE’s exit from OPEC just tilted that entire equation in favor of Bitcoin and risk assets.
Short-term, the market is brushing this off. The Strait is effectively closed, meaning UAE exports face bottlenecks regardless.
But the long-term environment has changed.
OPEC functions by suppressing supply to maintain pricing power. By leaving, the UAE is signaling a pivot toward maximizing market share.
When shipping routes eventually normalize, the UAE will have the freedom to increase output. More supply meeting the same demand creates structural downward pressure on oil prices.
Energy costs are the baseline for global CPI. Cheaper oil means softer inflation data over time.
Softer inflation removes the pressure on central banks to stay hawkish, giving them the data needed to cut rates. Ultimately, a more dovish Fed creates a much more favorable macro environment for risk-on assets like the S&P 500 and BTC.
6
229
Apr 28
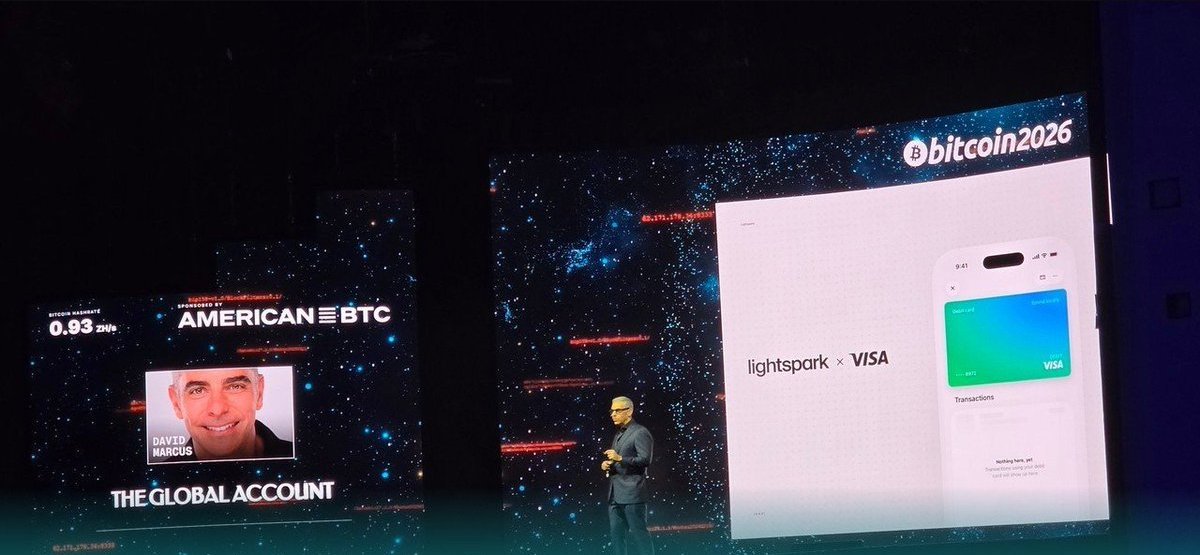
Visa just granted Lightspark Principal Member status. Last month, Mastercard dropped $1.8B to acquire stablecoin infrastructure firm BVNK.
Notice the pattern?
The biggest payment networks realize stablecoins are an existential threat to their cross border revenue. Instead of sitting by the sidelines, they are aggressively buying and integrating the infrastructure themselves.
Lightspark can now issue Visa debit cards linked directly to stablecoin balances, no traditional sponsor bank needed.
TradFi isn't fighting crypto anymore, they are growing it. If you're ignoring stablecoin adoption, you're missing the biggest macro shift in global payments.
3
236
Apr 27
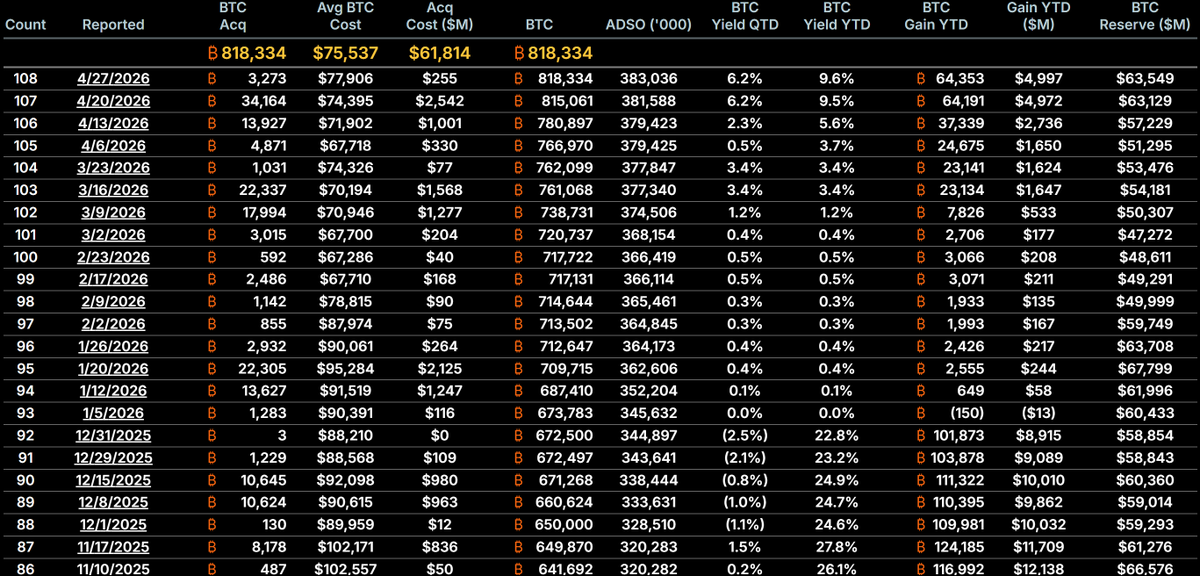
MSTR’s accumulation has gone parabolic.
They are absorbing massive multiples of the daily mined supply.
While sentiment and price is low, MSTR continues to accumulate.
Chart: @OnChainMind

3
189
Apr 26
Bitcoin has entered the Macro Regime band again.
More information about how this chart works can be found below.
22 Dec 2025

4
311