
Joined February 2012
- Tweets 2,367
- Following 1,408
- Followers 668
- Likes 1,170
157 Photos and videos


May 12
I’m a Java Backend Developer with 7 years of experience (@JavaDevTaha)
I’m actively looking to connect and grow with passionate people in:
• Backend / Fullstack / Frontend
• Cloud Engineering
• AI/ML & Data Science
• System Design & DSA
• Founders & Builders
• Blockchain & Web3
Let’s exchange ideas, share opportunities, collaborate, and level up together! DMs are open — drop a “👋” or tell me your focus area.
#Java #Backend #TechCommunity #Networking #AI #Cloud #Web3 #SystemDesign #DSA
30
36
1,655
May 11
Deadlocks happen when 2 transactions end up waiting on each other.
Example:
Transaction A
- locks Row 1
- tries to update Row 2
Transaction B
- locks Row 2
- tries to update Row 1
Now both transactions are stuck waiting forever.
To resolve this, the database kills one transaction.
That’s why users see random transaction failures.
Here’s how I’d investigate it:
1. Check database deadlock logs
Most databases provide detailed deadlock traces showing:
- involved queries
- locked rows
- transaction order
2. Identify conflicting queries
Usually update/delete operations accessing the same rows in different order.
3. Inspect transaction duration
Long-running transactions hold locks longer and increase deadlock probability.
4. Check indexing
Missing indexes can force larger scans and lock more rows than expected.
5. Review ORM-generated queries
Hibernate/JPA sometimes generates locking behavior developers don’t notice.
How to prevent deadlocks?
- access rows/tables in consistent order
- keep transactions short
- add proper indexes
- reduce unnecessary locking
- use optimistic locking where suitable
- retry failed transactions carefully
In one production issue:
A batch job and user API updated the same records in different order.
Under load:
deadlocks increased rapidly.
Fix:
- standardized update order
- shortened transaction scope
- improved indexing
Failures dropped close to zero.
Deadlocks are usually a transaction design problem, not a traffic problem.
May 11

Your database suddenly starts showing deadlocks in production.
Transactions begin failing randomly.
Users see:
“Please try again later.”
Traffic isn’t unusually high.
Servers look healthy.
What could cause this?
And how would you debug & prevent it?
1
2
5
823
May 11
Your database suddenly starts showing deadlocks in production.
Transactions begin failing randomly.
Users see:
“Please try again later.”
Traffic isn’t unusually high.
Servers look healthy.
What could cause this?
And how would you debug & prevent it?
3
975
May 11
Kafka consumer lag usually means:
Messages are being produced faster than they’re being consumed.
But if traffic hasn’t increased, the real issue is often somewhere else.
Here’s how I’d investigate it:
1. Check consumer processing time
Did a recent code change make message handling slower?
2. Inspect downstream dependencies
A slow DB/API call inside the consumer can throttle the entire pipeline.
3. Verify partition distribution
Too few partitions can limit parallelism.
Example:
- 1 partition
- 10 consumers
Only 1 consumer will actually work.
4. Check for retry storms
Failing messages being retried repeatedly can block progress.
5. Analyze consumer rebalancing
Frequent consumer group rebalances pause consumption temporarily.
6. Inspect batch sizes & poll configs
Poor tuning can reduce throughput drastically.
In one real-world scenario:
A downstream payment API became slow.
Each Kafka message processing time increased from:
50ms → 4s
Consumers couldn’t keep up.
Lag exploded.
Fix:
- async processing
- batch handling
- increased partitions
- retry queue with backoff
Lag dropped from millions → near real-time.
“Kafka is rarely the bottleneck.
The bottleneck is usually what your consumers are doing.”
May 11
Your Kafka consumers suddenly start lagging in production.
Messages keep piling up.
Processing delay grows from seconds → hours.
But:
Kafka brokers are healthy.
No server crash.
No traffic spike.
What would you investigate first?
1
4
180
May 11
Your Kafka consumers suddenly start lagging in production.
Messages keep piling up.
Processing delay grows from seconds → hours.
But:
Kafka brokers are healthy.
No server crash.
No traffic spike.
What would you investigate first?
1
276
May 10
This is called a cache stampede.
When Redis goes down:
Requests that were previously served from cache suddenly hit the database directly.
The DB receives a massive traffic spike it was never designed to handle.
Example:
Before Redis failure:
- 95% requests served from cache
- only 5% hit DB
After Redis failure:
- 100% requests hit DB instantly
Result:
connection pool exhaustion, slow queries, cascading failures.
How to survive this?
1. Graceful degradation
Some non-critical features should return partial/stale data instead of failing completely.
2. Local in-memory fallback cache
Short-lived backup cache can reduce DB pressure temporarily.
3. Rate limiting
Protect the database from sudden traffic floods.
4. Request coalescing
Prevent multiple threads from fetching the same missing data simultaneously.
5. Circuit breakers
Stop unhealthy downstream dependencies from collapsing the entire system.
6. Cache warming
Preload frequently accessed data after Redis recovery.
The goal isn’t:
“Prevent cache failures.”
The real goal is:
“Prevent cache failures from taking down the entire system.”
May 10
Your Redis cache suddenly goes down during peak traffic.
Within minutes:
Database CPU hits 100%
API latency jumps from 100ms → 12s
Some endpoints start failing
Why does this happen?
And how would you design the system to survive it?
2
349
May 10
Your Redis cache suddenly goes down during peak traffic.
Within minutes:
Database CPU hits 100%
API latency jumps from 100ms → 12s
Some endpoints start failing
Why does this happen?
And how would you design the system to survive it?
1
4
527
May 10
This often points to a thread or CPU-intensive operation running out of control.
Here’s how I’d investigate it:
1. Capture thread dumps
Look for:
- blocked threads
- deadlocks
- threads stuck in loops
- excessive GC activity
2. Check recent deployments
A small code change can trigger massive CPU usage in production scale.
3. Inspect logs for retry storms
Misconfigured retries can create infinite request loops between services.
4. Analyze database query plans
A missing index can force full table scans and spike CPU instantly.
5. Check serialization/deserialization
Large JSON payloads can become surprisingly CPU expensive.
6. Inspect async executors
Unbounded thread pools can overwhelm the server under load.
In one real-world case:
A retry mechanism without exponential backoff caused services to continuously call each other after a timeout.
Traffic stayed the same.
Internal requests exploded.
Fix:
- exponential backoff
- circuit breaker
- request timeout tuning
CPU dropped from 95% → 35%.
“Sometimes the real traffic spike comes from your own services.”
May 10
Your Spring Boot service works perfectly in staging.
But in production:
CPU suddenly spikes to 95%
Response times explode
Pods keep restarting
Traffic is almost unchanged.
No memory leak.
No DB outage.
What would you investigate first?
1
205
May 10
Your Spring Boot service works perfectly in staging.
But in production:
CPU suddenly spikes to 95%
Response times explode
Pods keep restarting
Traffic is almost unchanged.
No memory leak.
No DB outage.
What would you investigate first?
335
May 9
One week of being a full-time reply guy is officially over.I turned into a robot.
I had taken this week off from the office and here's what I did:
Spammed 100-130 replies every single day.And the algorithm said “bet”
→ 202.3K impressions ( 409%)
→ 4.1K engagements ( 475%)
→ 927 profile visits ( 543%)
Now I’m done being a reply NPC.
Time to actually post my own stuff.If you’ve been seeing me in your replies this week… tap follow. The real content starts now
#ReplyGuyEraOver

8
11
391
May 9
One of the most common causes:
Client retries no idempotency handling.
Example:
1. User clicks “Pay”
2. Payment succeeds internally
3. Response times out before reaching client
4. Client retries request
5. Same payment gets processed again
From the client’s perspective:
the first request “failed”.
From the server’s perspective:
both requests looked valid.
This is a classic distributed systems problem.
How to prevent it?
Use idempotency keys.
Each payment request gets a unique key.
If the same key is received again:
return previous response instead of processing payment again.
Additional protections:
- DB unique constraints
- Distributed locks (carefully)
- Message deduplication
- Exactly-once semantics where possible
- Retry policies with backoff
In payment systems:
“Retries are guaranteed.
Duplicates are optional.”
May 9
Your payment API processed the same payment twice.
Customer got charged 2 times.
Traffic was normal.
No server crash.
No DB outage.
What could have gone wrong?
And more importantly...
How would you prevent this in a distributed system?
1
3
156
May 9
Your payment API processed the same payment twice.
Customer got charged 2 times.
Traffic was normal.
No server crash.
No DB outage.
What could have gone wrong?
And more importantly...
How would you prevent this in a distributed system?
1
2
286
May 9
Here’s how I’d investigate it:
1. Check DB connection pool usage
(HikariCP exhaustion is very common)
2. Look for slow queries
Especially recently deployed features
3. Check for N 1 query issues
One request accidentally triggering hundreds of DB calls
4. Inspect external API latency
A slow downstream service can block threads
5. Take thread dumps
To identify blocked/waiting threads
6. Verify cache hit ratio
Low Redis hit rate can overload DB instantly
In one real case, the root cause was an N 1 query issue introduced after a feature release.
1 API call → 500 DB queries.
Fix:
- JOIN FETCH
- pagination
- Redis caching
Response time:
7s → 180ms
Most backend performance issues are database issues wearing a different costume.
May 9
Your Spring Boot API suddenly becomes slow in production.
Avg response time:
200ms → 7s
Traffic increase:
only 15%
CPU usage:
normal
Memory:
normal
What would you investigate first?
1
2
174
May 9
Your Spring Boot API suddenly becomes slow in production.
Avg response time:
200ms → 7s
Traffic increase:
only 15%
CPU usage:
normal
Memory:
normal
What would you investigate first?
2
304
May 9
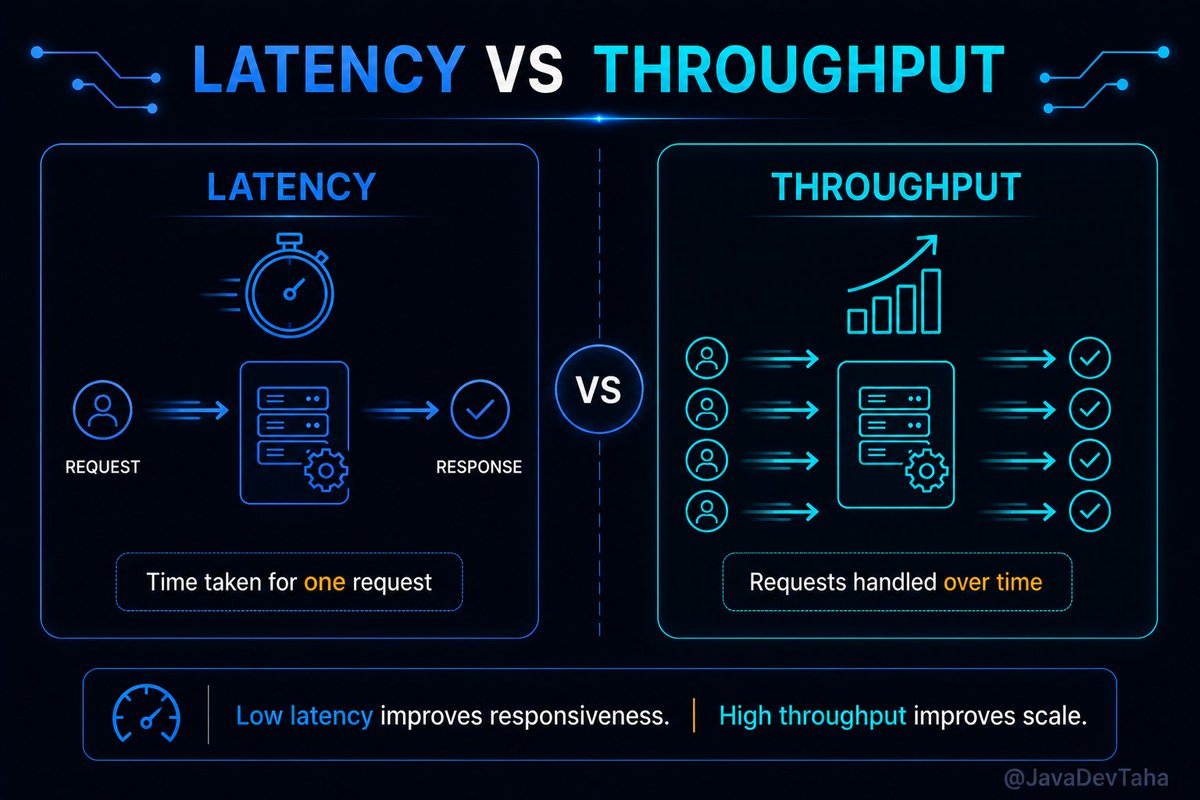
Performance in System Design: Latency vs Throughput
People often say a system is “fast.”
But fast in what sense?
Does it respond quickly to a single request?
Or can it handle millions of requests at the same time?
Those are two very different things.
This is where latency and throughput come in.
Latency is about time.
Throughput is about volume.
Latency asks:
“How long does one request take?”
Throughput asks:
“How much work can the system handle over time?”
Think about a restaurant.
If your food arrives in 5 minutes, that’s low latency.
If the restaurant can serve 5,000 customers a day, that’s high throughput.
Now here’s the catch:
Optimizing one can hurt the other.
A system tuned for extremely low latency might use expensive resources for every request.
That keeps responses fast… but limits how many requests the system can handle overall.
On the other hand, a system optimized for high throughput may batch requests together.
Great for scale.
But individual users might experience slightly slower responses.
That’s the trade-off.
Take Netflix.
When you press play, startup time matters a lot.
A delay of even a few seconds feels frustrating.
That’s a latency problem.
But when millions of users stream simultaneously across the world,
handling that scale becomes a throughput challenge.
Both matter.
But not equally in every system.
For a stock trading platform, latency is critical.
Milliseconds matter.
For large-scale analytics systems, throughput is usually more important.
The system needs to process massive amounts of data efficiently.
Good engineers don’t just ask, “is the system fast?”
They ask:
- Fast for whom?
- Fast under what load?
- Fast according to which metric?
Because performance without context is meaningless.
And one of the biggest mistakes in system design is optimizing the wrong thing.
A system can have excellent throughput…
and still feel slow to users.
Or it can feel incredibly responsive…
while collapsing under scale.
Real performance engineering is understanding the balance.
Tomorrow: Scalability — Vertical vs Horizontal Scaling
1
1
2
150
May 8
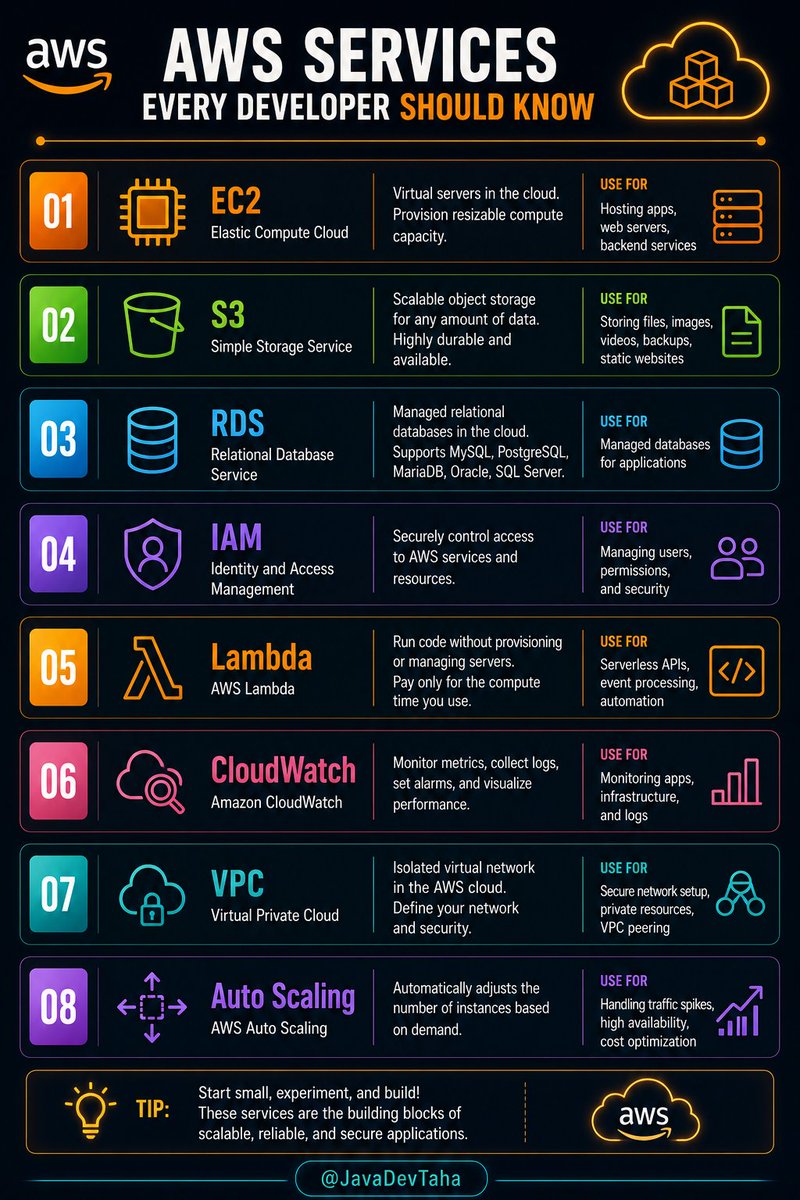
AWS Services Every Developer Should Know:
- EC2
- S3
- RDS
- IAM
- Lambda
- CloudWatch
- VPC
- Auto Scaling
3
1
5
253
May 8
I’m a Java Backend Developer with 7 years of experience (@JavaDevTaha)
I’m actively looking to connect and grow with passionate people in:
• Backend / Fullstack / Frontend
• Cloud Engineering
• AI/ML & Data Science
• System Design & DSA
• Founders & Builders
• Blockchain & Web3
Let’s exchange ideas, share opportunities, collaborate, and level up together! DMs are open — drop a “👋” or tell me your focus area.
#Java #Backend #TechCommunity #Networking #AI #Cloud #Web3 #SystemDesign #DSA
30
2
41
2,045
May 8
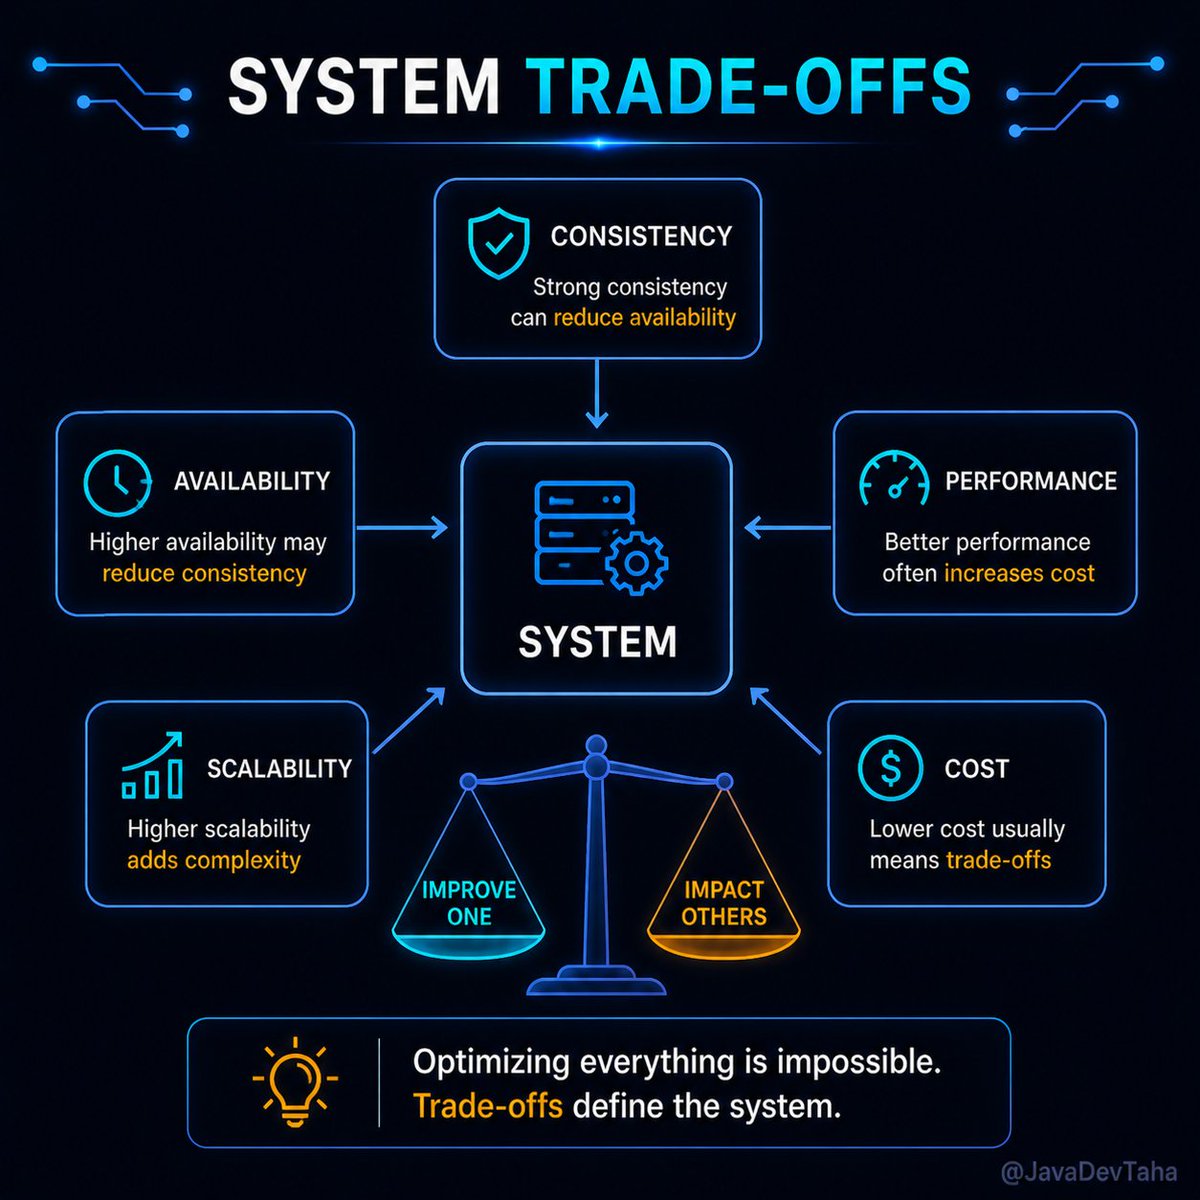
Trade-offs in System Design - You Can’t Have Everything
Everyone wants the same thing from a system.
- Fast.
- Scalable.
- Highly available.
- Strong consistency.
- Low cost.
The problem is… You can’t have all of it at the same time.
Every system design is a series of trade-offs.
You improve one thing, something else gives way.
Make a system highly consistent, and you may sacrifice availability.
Optimize for performance, and cost might increase.
Design for extreme scalability, and complexity goes up.
There’s always a price.
Think about it like this.
You’re building a ride service.
You want instant matching between riders and drivers.
That pushes you toward real-time systems.
But now you also want perfect accuracy in pricing and availability.
That slows things down.
You can’t optimize both fully at the same time.
You have to decide what matters more.
That decision is system design.
Even companies like Amazon make trade-offs constantly.
For example, showing slightly stale data (like “only 2 items left”)
It is often acceptable if it means the system remains fast and available.
Strict accuracy is sacrificed for a better user experience.
And most users never notice.
That’s the key.
Good trade-offs are invisible to users.
Bad trade-offs are not.
The mistake many engineers make is trying to optimize everything.
They aim for perfect performance, perfect consistency, perfect availability.
But that leads to over-engineering… or worse, fragile systems.
Experienced engineers do the opposite.
They decide early:
What matters most?
What can we relax?
Where can we compromise?
Because trade-offs aren’t a weakness in design.
They are the design.
If you don’t make them consciously,
They’ll be made for you—usually in production.
And by then, it’s much harder to fix.
Tomorrow: Performance in System Design — Latency vs Throughput
4
1
7
267
May 7
Kubernetes Concepts Every Developer Should Know:
- Pod
- Deployment
- Service
- ConfigMap
- Secret
- Ingress
- Namespace
- Horizontal Pod Autoscaler (HPA)

1
4
165