
台灣人. Graphics/cross-platform stuff @BBGVisualData & @bw. Previously @politico, @washingtonpost, @nytimes, @TexasTribune, @ucbsoj. Nope, never played in the NBA.
- Tweets 7,650
- Following 1,945
- Followers 3,339
- Likes 9,570


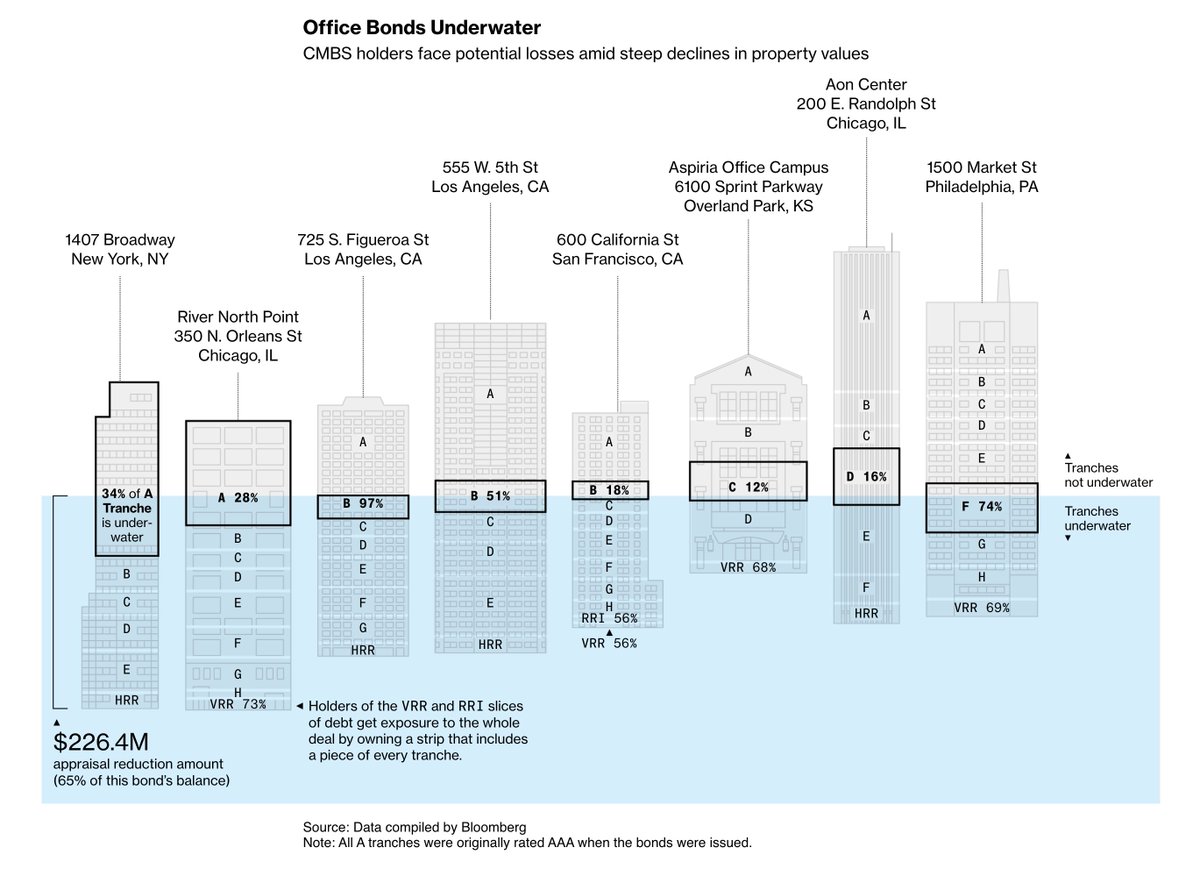
ALT A graphic that shows the commercial mortgage-backed securities tranches for eight buildings in major US cities that are either underwater or not underwater. The buildings start at various heights and a light turquoise background covers the tranches underwater, with the most underwater being 1407 Broadway in New York, that includes 34% of A tranches in underwater, and a note pointing to the underwater section saying “$226.4M appraisal reduction amount (65% of this bond’s balance)”. Other buildings include River North Point 350 N. Orleans Street in Chicago (A tranches 28% underwater) and 725 S. Figueroa Street (B tranches 97% underwater) and 555 W. 5th Street (B tranches 51% underwater), both in Los Angeles.

ALT A graphic showing the quantity, in time, of Dell servers equipped with Nvidia or AMD chips went from Malaysia, to an Indian pharmaceutical company, Shreya Life Sciences, then to Russia. The servers are each represented as small isometric cubed. The amount increases from 1 in January 2024 to 738 in July 2024 (half of its total 2024 orders). On the Russia side, consignees Main Chain Ltd. and I. S LLC get the cubes from Shreya Life Sciences. A note at the top says “More than 1,400 Dell PowerEdge XE9680, one of the most advanced servers, were imported into India by Dell International Services India Jan. — Aug. 2024”. A note in the middle says “Shreya Life Sciences, an Indian pharmaceutical company, then exported more than 1,100 servers to Russia during the same period”. In the end, a note on Russia’s side indicates “Shreya exported 385 servers to Russia in August — the biggest shipment the company has ever made”
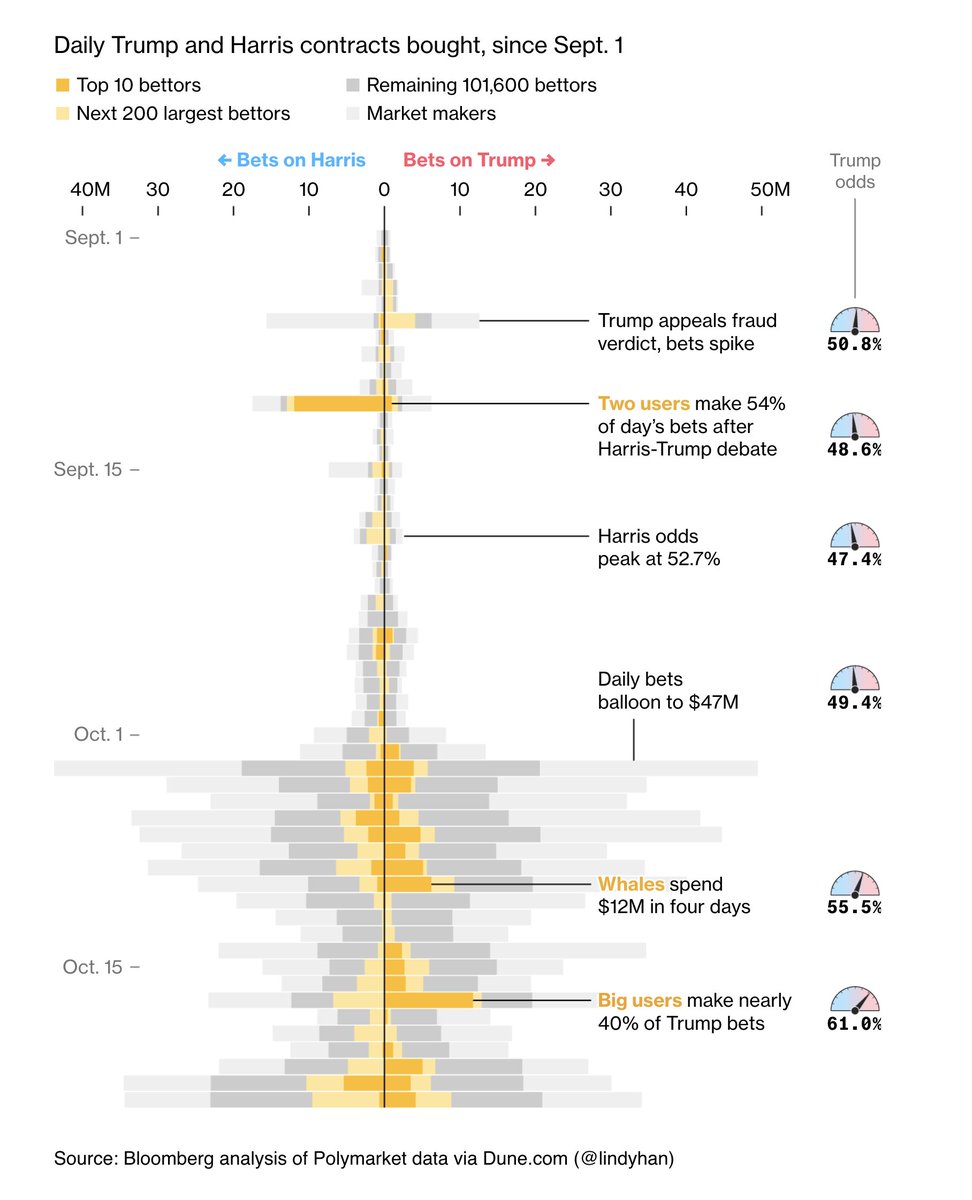
ALT Two bar charts side by side, arranged vertically, that visualize the contracts bought on Polymarket on the outcome of the election: left for Harris bets and right for Trump bets. The bets are color-coded by top 10 bettors since Sept. 1 in honey, next 200 largest in light yellow and gray for the remaining 101,600 bettors. Market makers that make small frequent bets are marked in light gray. The total of bets are fairly similar, with occasional peaks: two honey users make 54% of bets after Harris–Trump debate on Sept. 12. Bets surge on October 3 and after. The honey colored bars are larger on the Trump side, including exclusively on Trump’s side between October 14 and October 21, with a note saying that whales spend $12M in four days on October 10, and big users make nearly 40% of Trump bets on October 17. A needle visualization is shown on the right margin, noting Trump odds: 50.8% on September 6, down a bit to the end of the month (bottom at 47.4%), but significantly up in October.


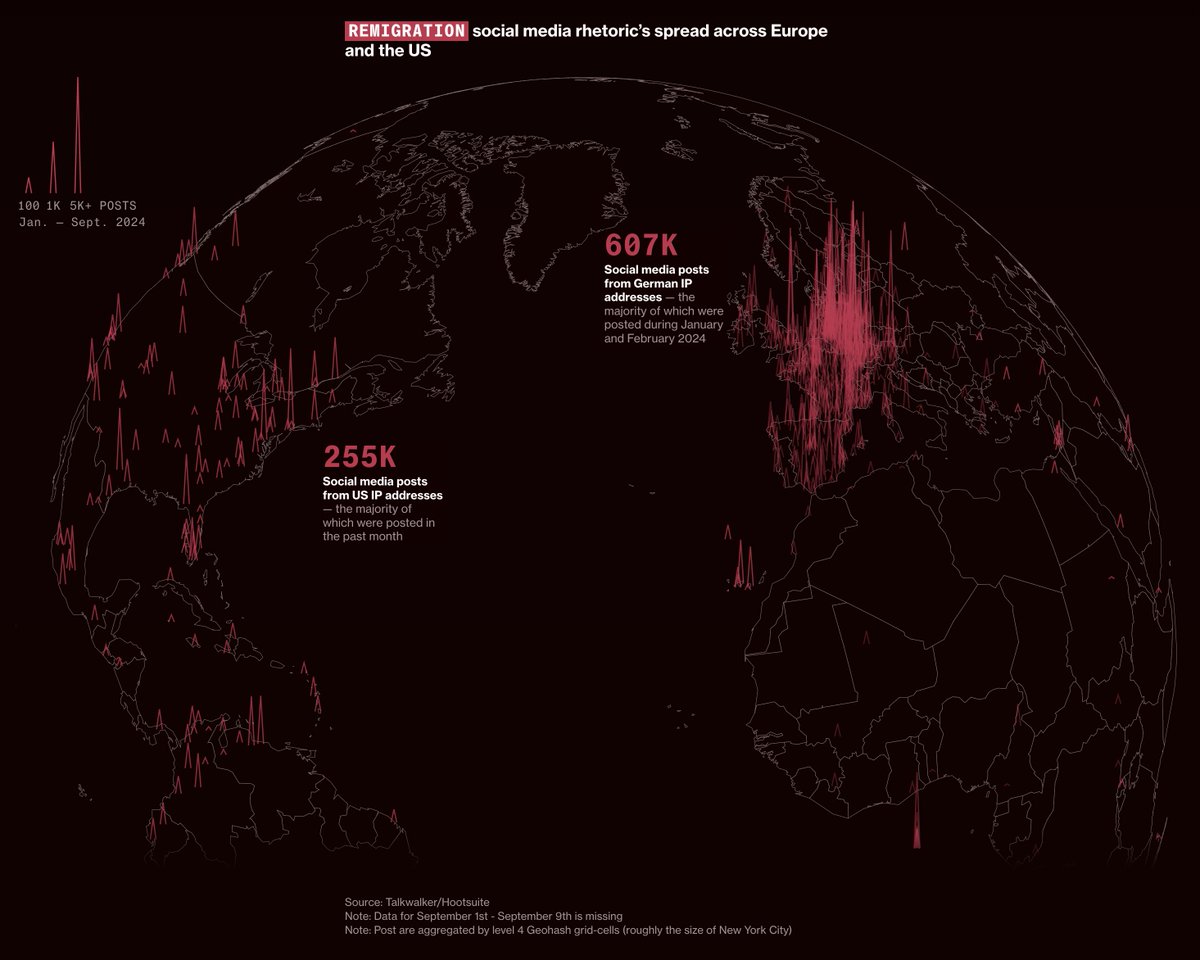
ALT An earth globe on a black background with country boundaries drawn with light pink outline, where small triangle shapes are drawn on major cities, representing the location and numbers of posts made there about remigration (as found by where their IP originated from). Most of the posts seem clustered around western Europe, especially from Germany. A note on Europe says: “607K Social media posts from German IP addresses — the majority of which were posted during January and February 2024”. Another note on the US says “255K Social media posts from US IP addresses — the majority of which were posted in the past month.”


ALT An annotated line chart that represents the odd lot volume as a percent of total volume since 2019 for GameStop (line in blue), AMC Entertainment (in yellow) and all US common stocks (in black). While the black line oscillates at or within 1-2 percentage points around 19%, the blue and yellow lines see a lot more variation: GameStop hovered around 40-50% in 2021-2022, while AMC was close to 0 in 2020 and after 2022.


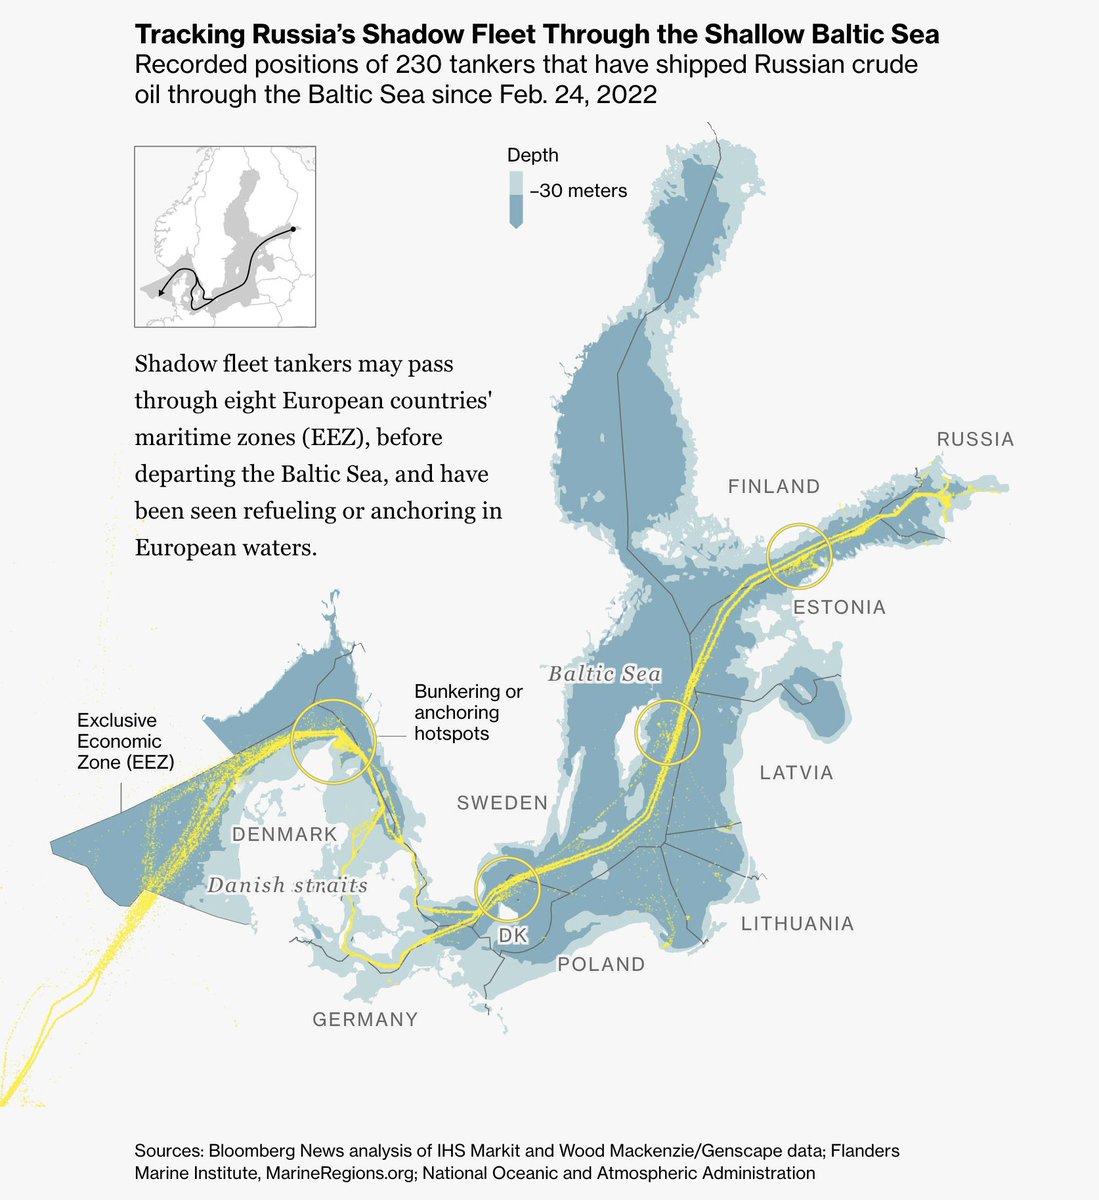


ALT Une carte montrant les positions GPS de 230 pétroliers appartenant à la flotte fantôme russe, depuis le 24 février 2022. Lors de leur passage dans la Mer Baltique, ces derniers traversent librement les eaux territoriales danoises, où la profondeur de la mer est parfois inférieure à 30 mètres, augmentant le risque d’accident.