
Technical Analyst & Investor | I combine log and linear chart analytics | This is not financial advice |
Joined March 2026
- Tweets 667
- Following 137
- Followers 246
- Likes 372
120 Photos and videos


Pinned Tweet

1
3
169
1
3
169

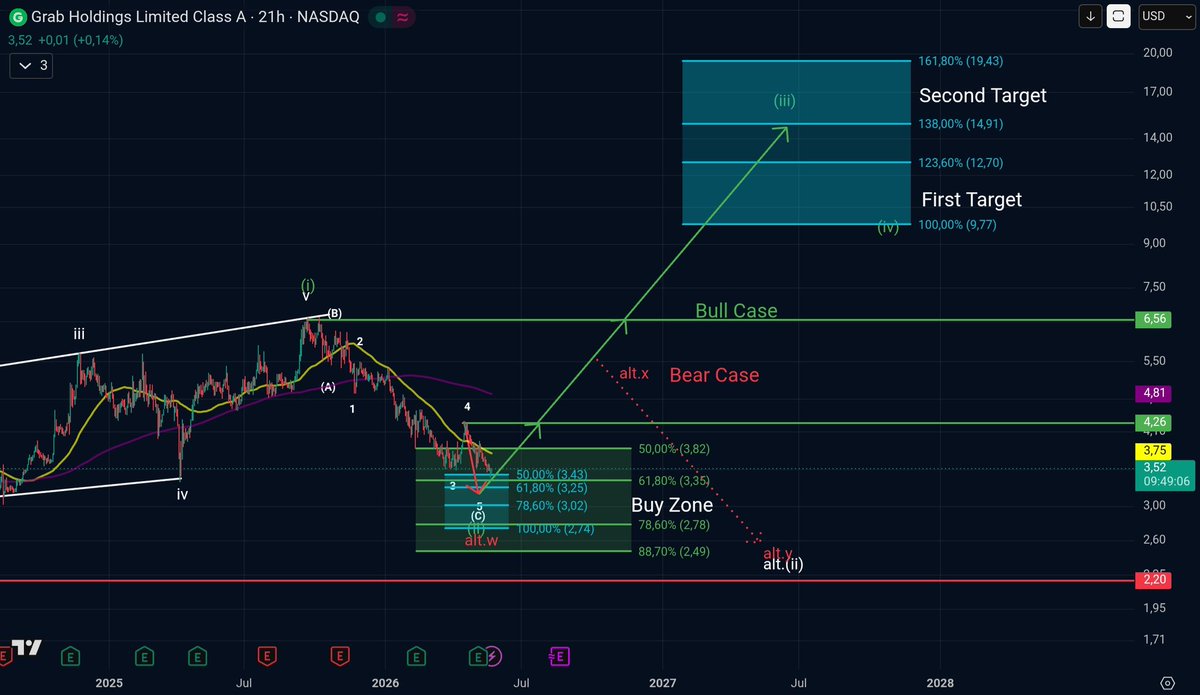
$GRAB — Update: The blue box is in play.
In my last update I outlined the route map:
Wave 5 of (C) likely completing inside $3.43–$2.74.
Price is now inside that zone.
This is where I start scaling in — not all at once.
📊 Levels I'm watching inside the box:
→ $3.23 (61.8% Fib)
→ $2.99 (78.6% Fib)
→ $2.74 (100% extension)
🟢 Bull case — route map if the low forms here:
→ $4.26 (first resistance)
→ $6.56 (Wave (i) high)
🎯 First target: $9.77
🎯 Second target: $19.43–$12.70
🔴 Alt count:
Only active if $4.26 breaks but $6.56 doesn't hold. Then a deeper w-x-y correction toward $2.49 stays on the table.
❌ Invalidation: sustained break below $2.20
Plan posted in advance. Plan executed. That's the difference.
Not financial advice. DYOR.
#GRAB #ElliottWave #LogLinear #Fibonacci #TechnicalAnalysis #Stocks
1
3
94
9/
That's the week. 📊
Which ticker should I take apart next with BOTH scales? Drop it below 👇
⚠️ Not financial advice. DYOR.
#ElliottWave #LogLinear #Fibonacci #TechnicalAnalysis #Stocks
2
27
LLCA - LogLinearChartsAnalysis retweeted
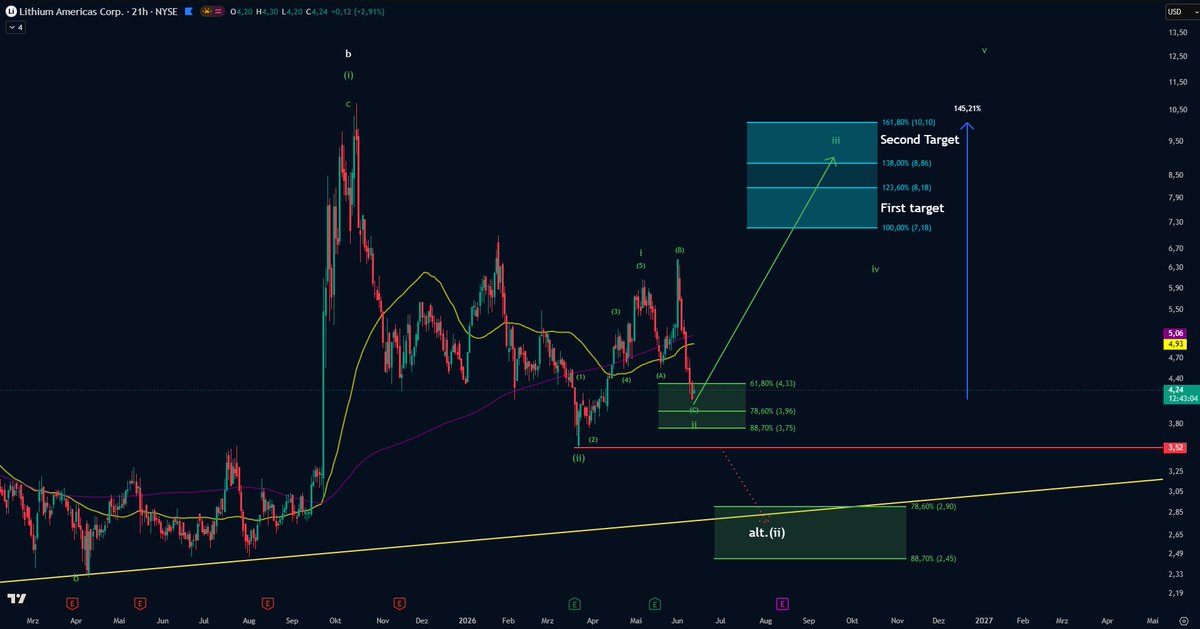
Nobody's talking about $LAC right now 👀
That's exactly why I am.
Wave ii just dropped into the golden pocket:
$4.33–$3.75
This is the zone where wave iii setups are born.
My route map:
→ 1/3 position now (~$4.24)
→ 2/3 on further weakness into $3.96–$3.75
Invalidation: $3.52
Clean and simple. Below that, alt.(ii) opens toward $2.90–$2.45.
Targets if the count holds:
→ $7.18
→ $10.10
Up to 145% from current levels.
Defined risk. Clear levels. No guessing.
Not financial advice. DYOR.
$LAC #ElliottWave #LogLinear #Fibonacci #TechnicalAnalysis #Stocks
1
1
11
689
LLCA - LogLinearChartsAnalysis retweeted
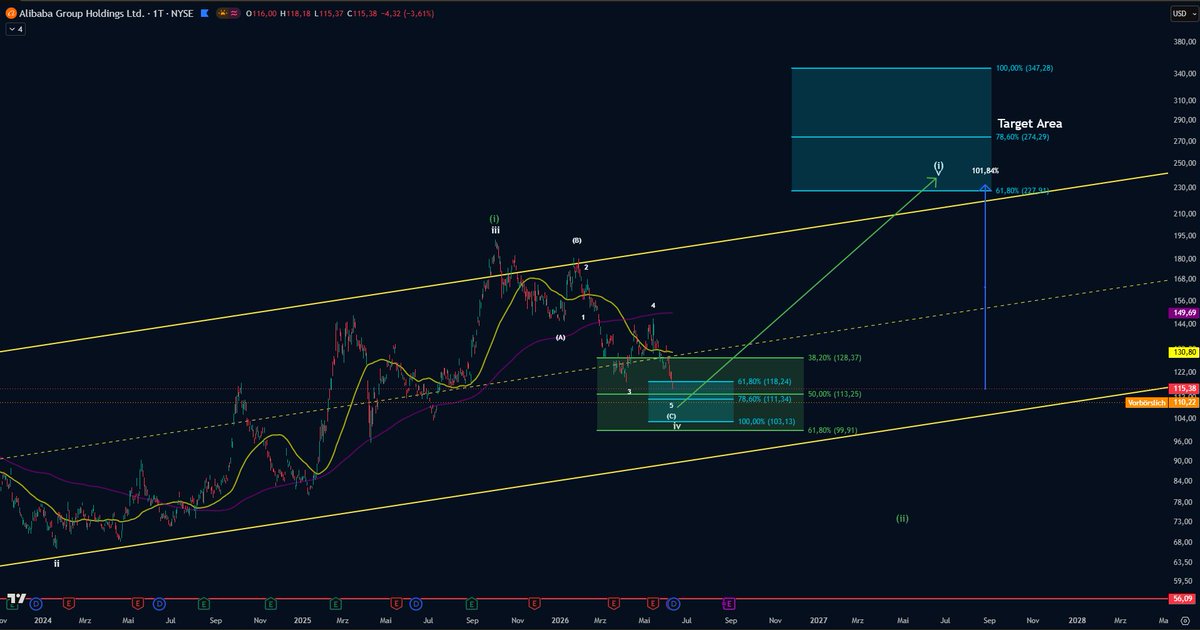
$BABA — Update
Wave iv correction is playing out into the fib zone.
Price currently sitting around $115 — right inside the buy area.
My route map:
→ Accumulation zone: ~$115 down to ~$100
→ Invalidation: below $89.90
Long-term target zone if the count holds:
$347 – $228 (100% / 61.8% projection)
As long as invalidation holds, the structure stays bullish.
Not financial advice. DYOR.
$BABA #Alibaba #ElliottWave #LogLinear #Fibonacci #TechnicalAnalysis
1
1
11
1,508
LLCA - LogLinearChartsAnalysis retweeted
$GRAB — Update: The blue box is in play.
In my last update I outlined the route map:
Wave 5 of (C) likely completing inside $3.43–$2.74.
Price is now inside that zone.
This is where I start scaling in — not all at once.
📊 Levels I'm watching inside the box:
→ $3.23 (61.8% Fib)
→ $2.99 (78.6% Fib)
→ $2.74 (100% extension)
🟢 Bull case — route map if the low forms here:
→ $4.26 (first resistance)
→ $6.56 (Wave (i) high)
🎯 First target: $9.77
🎯 Second target: $19.43–$12.70
🔴 Alt count:
Only active if $4.26 breaks but $6.56 doesn't hold. Then a deeper w-x-y correction toward $2.49 stays on the table.
❌ Invalidation: sustained break below $2.20
Plan posted in advance. Plan executed. That's the difference.
Not financial advice. DYOR.
#GRAB #ElliottWave #LogLinear #Fibonacci #TechnicalAnalysis #Stocks
$GRAB — Buy zone tagged. But I'm in no rush.
Price has tapped the upper end of the buy zone I've been tracking ($3.82–$2.49). This looks like a potential 5-wave (C) completing into the golden pocket — if the count holds.
But the 2W RSI isn't oversold yet. That keeps a deeper flush toward the lower zone very much on the table. So personally I'd rather scale in patiently here than chase a single entry.
Route map if the structure holds:
→ Reclaim $6.56 = bull case in play
→ First target: $12.70–$9.77
→ Second target: $19.43–$14.91
Invalidation: below $2.20.
Not financial advice. DYOR.
$GRAB #ElliottWave #LogLinear #Fibonacci #TechnicalAnalysis #Stocks
1
10
1,393
LLCA - LogLinearChartsAnalysis retweeted
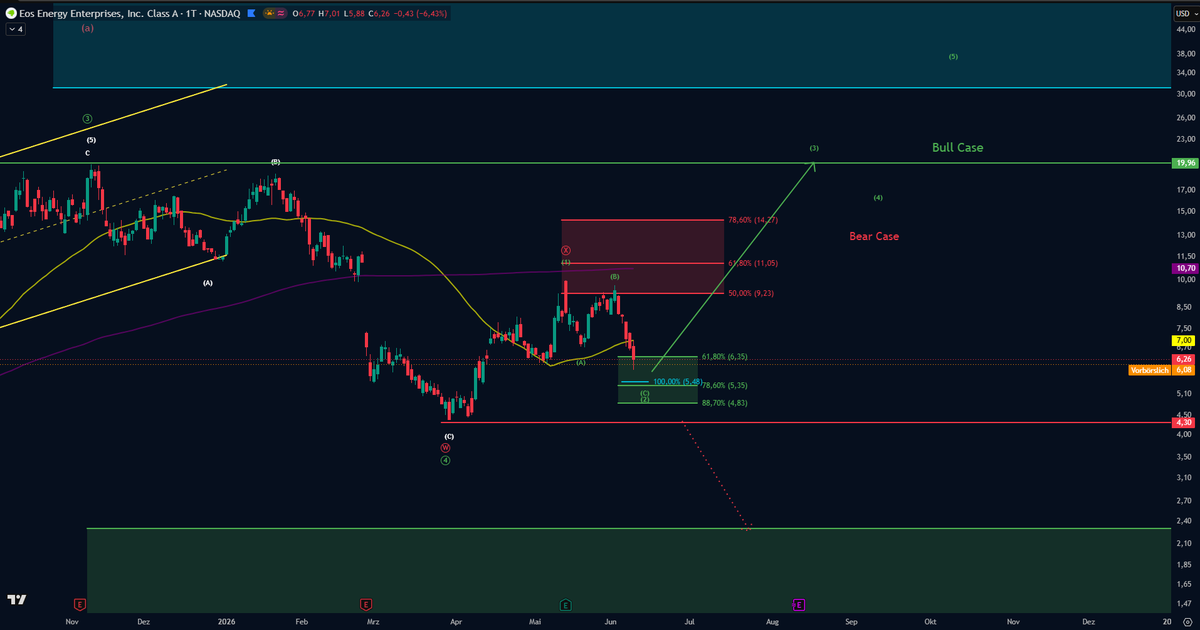
⚡ $EOSE — Update
Price tagged the support zone.
So far: everything according to plan.
What I'm watching now:
→ Daily RSI approaching 30
→ Support zone $6.35–$4.83 (61.8%–88.7% Fib)
Route map:
📍 If the zone holds → potential reversal setup
🎯 First target: $19.96
🎯 Above that, more room opens up
Invalidation: $4.30
Below that level, the structure breaks and new lows become possible.
Simple setup.Clear levels. Now we wait.
⚠️ Not financial advice. DYOR.
$EOSE #ElliottWave #LogLinear #Fibonacci #TechnicalAnalysis #Stocks
$EOSE ⚡
$EOSE looks like it's in a possible C-wave pullback.
Buy zone sits between $6.35 and $4.83.
The whole setup hangs on $4.30.
Hold that level → I stay bullish mid-term.
Lose it → new lows back on the table.
If the count plays out: $19.96 first, then $31 .
One level decides it all.
Not financial advice. DYOR.
#EOSE #ElliottWave #TechnicalAnalysis
1
6
1,695
LLCA - LogLinearChartsAnalysis retweeted
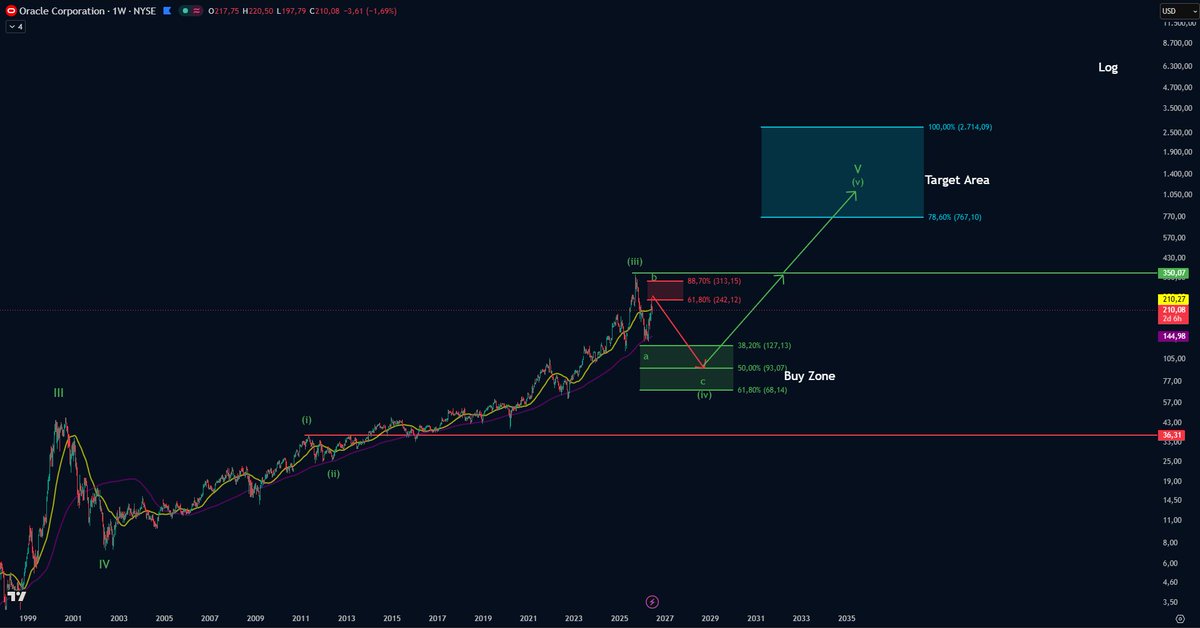
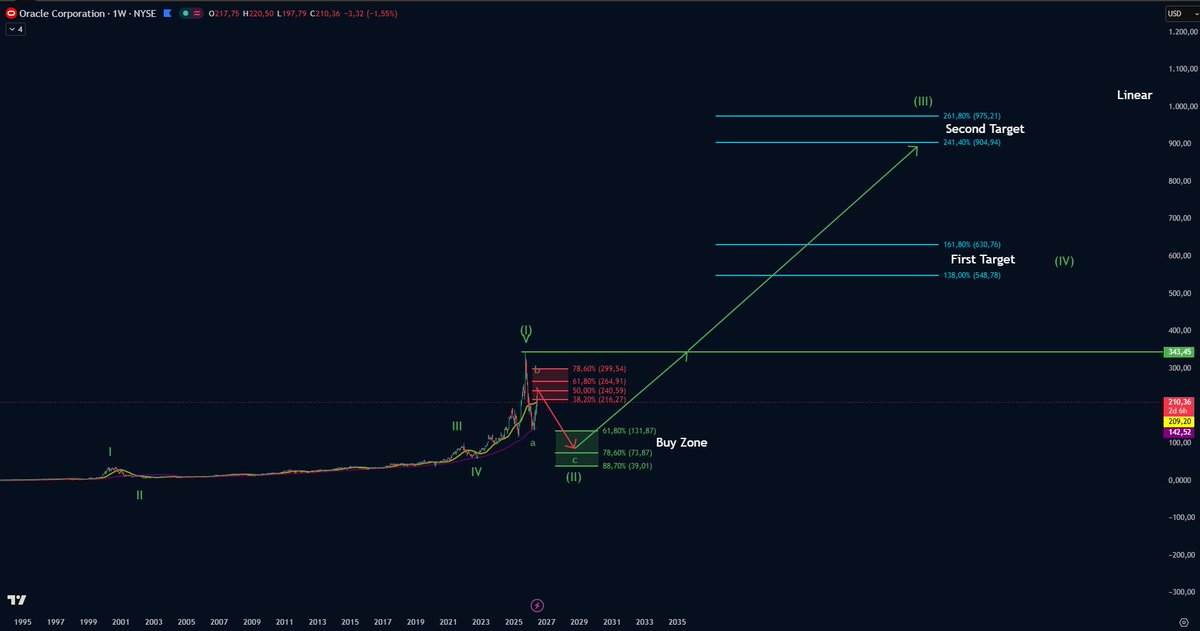
$ORCL — Log vs. Linear. Two charts. Same story.
Both scales say the same thing:
A bit more upside is possible short-term. But the ~$350 zone is the line in the sand.
As long as price stays below it, I expect one more leg down.
📍 My buy zones:
→ Log: $127–$68
→ Linear: $131–$39
The sweet spot where both charts overlap: ~$70. That's where I want to be a buyer.
🎯 Long-term targets if the structure plays out:
→ Log: $2,714–$767
→ Linear: $975–$548
Two completely different methodologies.
Same buy area. Same direction.
That's the confluence I trade.
This is a multi-year route map — not a trade call. Patience first, levels second.
⚠️ Not financial advice. DYOR.
#ORCL #Oracle #ElliottWave #LogLinear #Fibonacci #TechnicalAnalysis #Stocks
1
3
1,480
LLCA - LogLinearChartsAnalysis retweeted
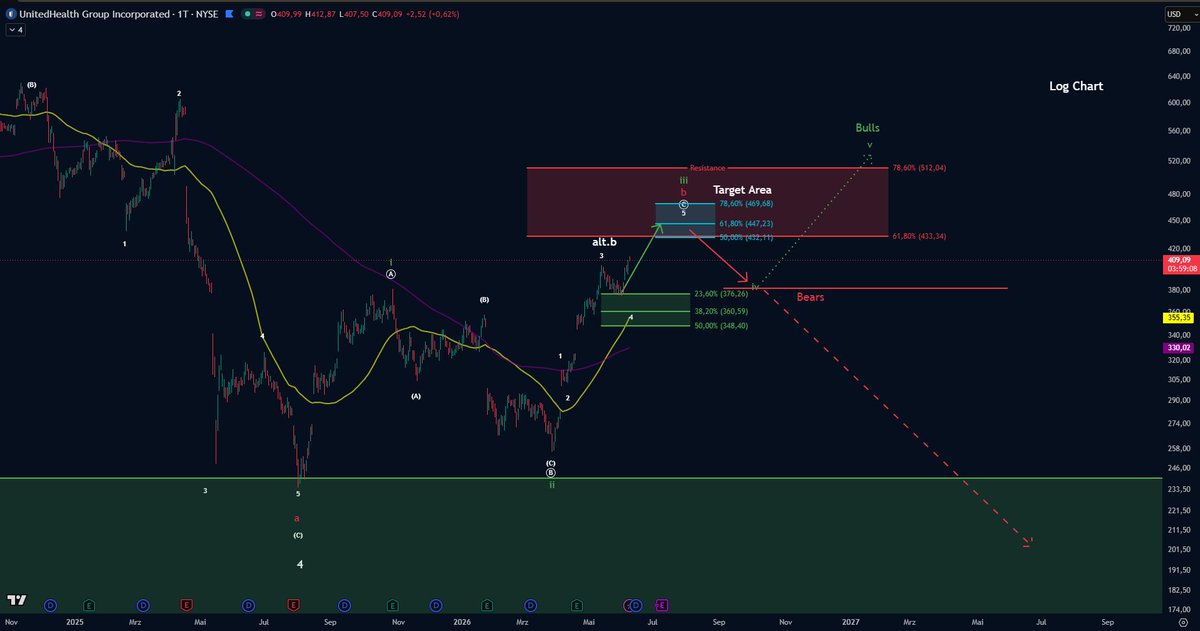
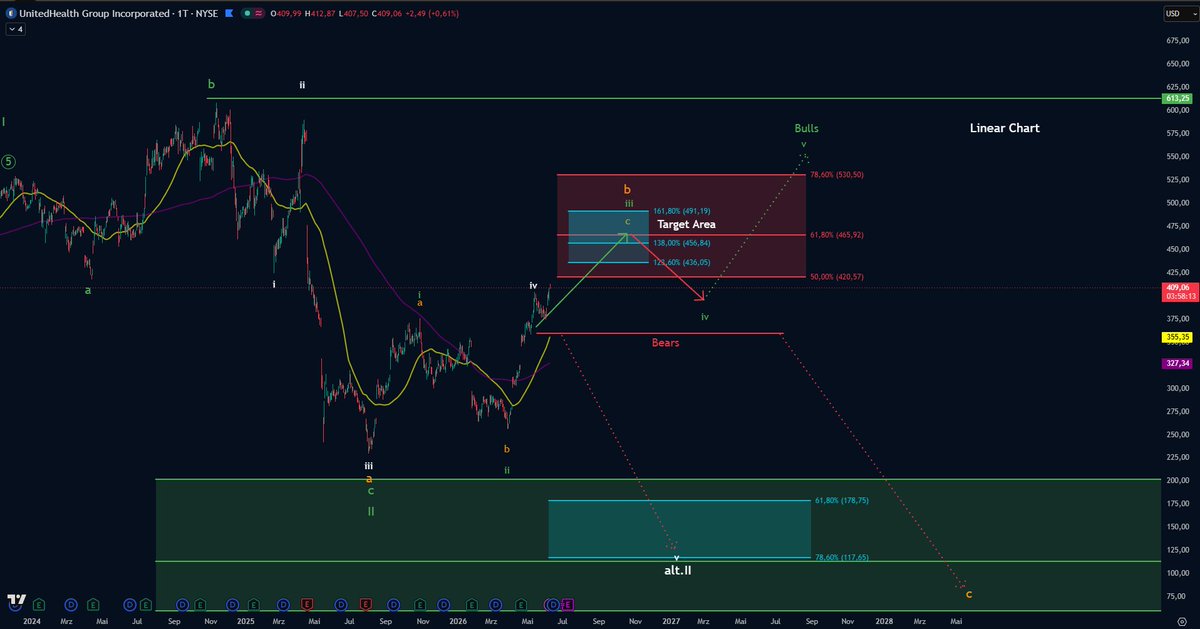
$UNH — update. The plan is playing out.
Support tested. Support held.
Now both scales point to the same Target Area.
→ Log: $469–$432 (key 61.8% at $447)
→ Linear: $466–$420 (61.8% at $466)
Both cluster around $469–$447.
That's the confluence.
🎯 Reach the zone → the market decides:
→ Bulls: wave v, ~$512 (log) / ~$530 (linear)
→ Bears: rejection lower
🛑 Key support: ~$380. Lose it and the count weakens.
Structure intact. Route map points up.
Then we let the market choose.
Not financial advice. DYOR.
#UNH #ElliottWave #LogLinear #Fibonacci #TechnicalAnalysis
2
9
921