
167 Photos and videos


Le Pat retweeted

Apr 23
why is every rapper saying the same 17 words
new Lil NPC - "NPC PROTOCOL"
24
88
435
42,056
Le Pat retweeted
Mar 29
If everyone just accepted this story we could have avoided a war:
7 Aug 2025

Trump now only has default NPC responses when asked about the Epstein List.
4
16
146
4,521

Le Pat retweeted
30 Nov 2025
Embrace your grayness.
Join the $NPC movement.
You are one of us.
29
46
237
7,607
Le Pat retweeted

15 Oct 2025
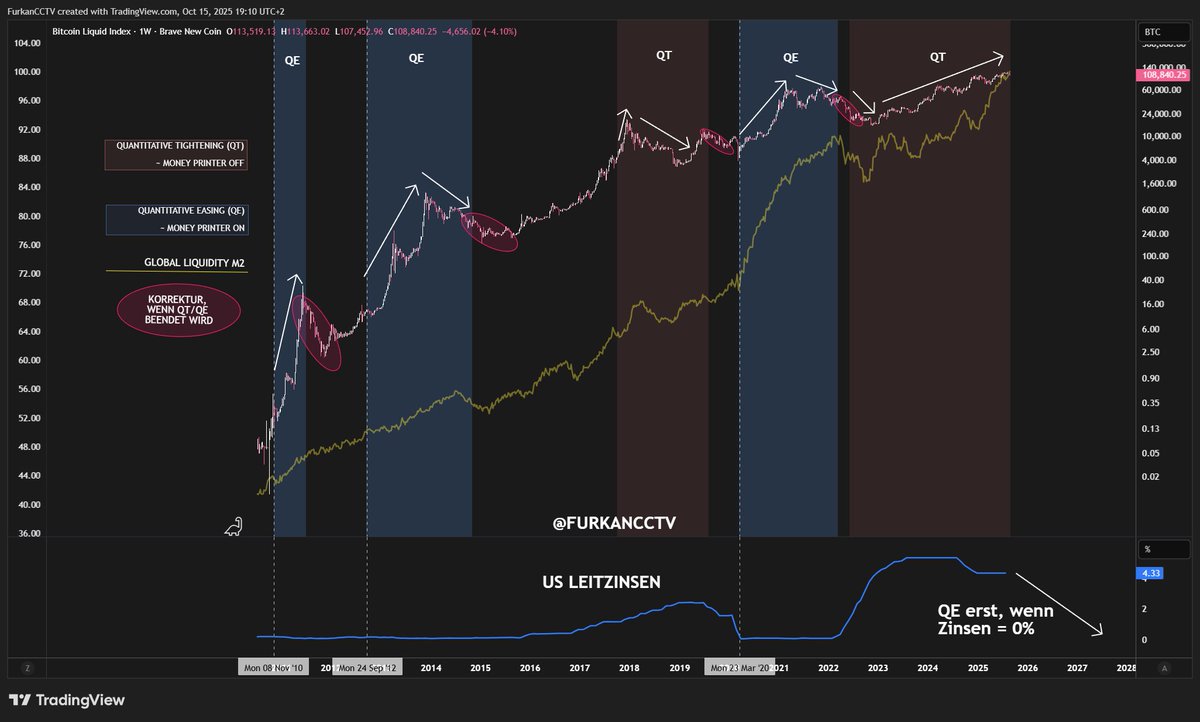
Jerome Powell hat es angedeutet: QT könnte bald enden. Doch was folgt dann wirklich für Bitcoin & Krypto?
Nimm dir bitte die paar Minuten Zeit, denn dieser Beitrag und Chart ist der einzige, den du zu diesem Thema brauchst. 👇
Ich habe mir die Entwicklung der letzten 15 Jahre angesehen, alle Phasen von QE und QT seit 2010. Und ich habe versucht, die Zusammenhänge zwischen Liquidität, Zinspolitik und Kursbewegungen in einem Chart darzustellen.
Viele sagen jetzt:
„QT endet: also steigen die Kurse!“
Diese Meinung klingt einleuchtend, sie ist einfach und sie verkauft sich gut.
Aber sie greift viel zu kurz.
Das Ergebnis:
Die Realität ist deutlich komplexer, als die einfache Wenn-dann-Logik suggeriert.
Kurze Erklärung für alle, die nicht täglich Geldpolitik studieren:
- Quantitative Easing (QE) bedeutet: Die Notenbank kauft Anleihen, pumpt also Geld ins System. Ziel: Wirtschaft ankurbeln, Liquidität erhöhen.
- Quantitative Tightening (QT) ist das Gegenteil: Geld wird entzogen, Anleihenbestände werden reduziert. Ziel: Inflation dämpfen, System „abkühlen“.
Klingt nach einer klaren Formel: mehr Geld = steigende Kurse, weniger Geld = fallende Kurse.
Aber wenn man sich die letzten 15 Jahre ansieht, merkt man schnell:
So einfach ist es eben nicht.
------------------
Was die Daten zeigen:
In meinem Chart (unten) habe ich Bitcoin seit 2010 gegen die Phasen von QE und QT gelegt und zusätzlich die US-Leitzinsen sowie die globale Liquidität (M2).
Das auffälligste Muster:
Immer wenn eine Phase (egal ob QE oder QT) beendet wurde, kam es anschließend zu einer Korrektur.
In allen vier bisherigen Fällen.
1⃣ Nach QE-Ende 2011: monatelange Konsolidierung.
2⃣ Nach QE-Ende 2014: längere Seitwärts- und Abwärtsphase.
3⃣ Nach QT-Ende 2019: ebenfalls Korrektur.
4⃣ Und aktuell befinden wir uns am Ende der jüngsten QT-Phase.
Das heißt nicht, dass die Kurse zwangsläufig fallen müssen, sobald QT endet.
Aber es zeigt, dass Übergangsphasen in der Geldpolitik häufig mit Unsicherheit, Positionswechseln und Marktneubewertungen einhergehen.
Und das führt oft zu Volatilität, nicht zu klaren Aufwärtstrends.
------------------
Das Missverständnis „QT aus = QE an“
Ein weiterer Punkt, der oft übersehen wird:
QE folgt nicht automatisch direkt auf QT.
Historisch beginnt QE erst dann, wenn die Notenbank mit ihren Zinsen keinen weiteren Spielraum nach unten hat, also wenn die Leitzinsen bereits bei 0% sind.
Das sieht man im unteren Teil meines Charts sehr deutlich:
QE startet regelmäßig erst, wenn der Zinssenkungszyklus vollständig abgeschlossen ist.
Davon sind wir derzeit weit entfernt.
Aktuell liegt der US-Leitzins bei über 4%.
Das bedeutet: Selbst wenn QT bald endet, kann es noch lange dauern, bis wirklich wieder Liquidität durch QE ins System kommt.
Es sei denn, es passiert etwas Dramatisches, ein Einbruch am Arbeitsmarkt, ein massiver wirtschaftlicher Schock.
Dann müsste die Fed schnell reagieren.
Aber das wäre kein „bullishes“ Szenario, sondern Ausdruck einer ernsthaften Krise.
------------------
Und dennoch: Die globale Liquidität steigt.
Spannend ist, dass die weltweite Geldmenge M2 trotz QT zuletzt gestiegen ist.
Das zeigt: Die USA sind nicht das ganze Bild.
Andere Faktoren spielen eine große Rolle, zum Beispiel China, wo regelmäßig Liquiditätsspritzen angekündigt werden, oder auch das Reverse Repo-System in den USA, das zeitweise Milliarden freigesetzt hat.
Das heißt: Selbst in einer QT-Phase kann die globale Liquidität steigen und das ist wahrscheinlich auch einer der Gründe, warum sich Bitcoin und andere Assets in den letzten zwei Jahren trotz geldpolitischer Straffung so robust gezeigt haben.
------------------
Fazit:
Nur weil QT endet, heißt das nicht, dass der Markt sofort durchstartet.
Und nur weil QE irgendwann wiederkommt, heißt das nicht, dass alles automatisch besser wird.
Märkte reagieren auf Erwartungen, nicht auf einfache Formeln.
Und wer gelernt hat, diese Übergangsphasen zu lesen, erkennt oft frühzeitig, wann der Markt noch zu euphorisch ist –oder zu ängstlich.
Deshalb:
Nicht auf Schlagzeilen reagieren.
Sondern auf Liquidität achten.
Auf globale Zusammenhänge.
Und auf das, was nicht gesagt wird.
Das ist aktuell wichtiger denn je.
Falls dieser Beitrag für dich hilfreich war, interagiere gerne mit diesem Post, um mehr Menschen zu erreichen und aufzuklären. Vielen Dank! 🫶
------------------
Wenn ihr Lust habt, mache ich zu dem Thema nochmal ein Video, wo ich es nochmal erkläre.
Was ist deine Meinung dazu?
145
159
2,147
346,493
Le Pat retweeted
4 Oct 2025
Who else thinks it's time to bring this energy back into crypto?
18
27
203
4,562
Le Pat retweeted

12 Sep 2025
We have been building tirelessly behind the scenes and the foundation is set. The next phase of NetMind and $NMT is ready.
On Thursday September 18th at 3pm CET 9am EST we go live on X Spaces to share what comes next.
Topics include
• Diving into our Q4 roadmap
• Next generation agents with a teaser of our upcoming flagship
• Multichain expansion
• Token utility and enforced scarcity
• New community campaigns
• Answering community questions
🗓 September 18th
⏰ 3pm CET / 9am EST
📍 X Spaces: x.com/i/spaces/1zqKVdZeXrmJB
We will open questions a few days before so the community can guide the conversation. Netminders, you do not want to miss this.

24
24
141
4,814

Le Pat retweeted
21 Jul 2025
Is $NPC a memecoin? Or is it an NFT?
Blogpost #2 on npc.com is officially out, where we answer these questions and explain the unique design behind the current coin.
$NPC is built different.
Read it here 👇
npc.com/blog/articles/memeco…

53
128
606
32,088

Le Pat retweeted

17 Feb 2025
Never seen this in Web3 gaming 🤯— we heard it nonstop at @nft_paris
- PC was 100% occupied—queues all day
- Insane feedback, especially from OW, Valorant, and CS pros
- Wishlist & social follows skyrocketed
- New superfans unlocked
- T-Shorts were a hit
Huge thanks to everyone who stoped by 🫶🫡
Closed Beta IRL was an absolute blast and exceeded all expectations. Get ready for the first key drop! 🩸
53
73
289
28,122
Le Pat retweeted
25 Dec 2024
Everything You Need to Support the Current Coin
$NPC Cheat Sheet •⎳•
📌 home page: npc.com
📌 create your own NPC: app.npc.com
📌 our token standard: npc.com/mediacoins
📌 AI bot: ai.npc.com
📌 docs: docs.npc.com
📌 NPC customs NFT collection: opensea.io/collection/non-pl…
📌 claim your .npc domain: get.unstoppabledomains.com/n…
📈 coingecko: coingecko.com/en/coins/non-p…
📈 coinmarketcap: coinmarketcap.com/currencies…
🫂 community telegram: t.me/nonplayablecoin
📸 instagram: instagram.com/npc
🤳 tiktok: tiktok.com/@nonplayablecoin
The $NPC takeover has begun. Tradable on Ethereum, Solana, Base, and BNB Chain.
CA for Ethereum: 0x8eD97a637A790Be1feff5e888d43629dc05408F6
👉 Uniswap: app.uniswap.org/swap?outputC…
👉 Chart: dexscreener.com/base/0x3f413…
CA for Solana: BeGY8KqKxboEwRbJd1q9H2K829jS4Rc5dEyNMYXCbV5p
👉 Raydium: raydium.io/swap/?inputMint=s…
👉 Chart: dexscreener.com/solana/fan5g…
CA for Base: 0xB166E8B140D35D9D8226E40C09f757BAC5A4d87d
👉 Uniswap (switch to Base): app.uniswap.org/swap?outputC…
👉 Chart: dexscreener.com/base/0x3f413…
CA for BNB Chain: 0xFEbfA339E44c28E2aa9E62Ea1027C9CB4e378605
👉 PancakeSwap: pancakeswap.finance/?outputC…
👉 Chart: dexscreener.com/bsc/0xd50897…
Liquidity is locked until the year 6969 on ETH and Base. Liquidity on Solana and BNB Chain is burned forever.
👉 Also trading on many centralized exchanges. View them here: npc.com/#buy
‼️ FIVE REASONS TO SUPPORT THE CURRENT COIN ‼️
1️⃣ $NPC is for every human on Earth 🧍♂️
On launch day (July 29, 2023), the total human population was recorded on-chain. There will only ever be 8,050,126,520 NPC ever. The entire supply has been circulating since our fair launch.
2️⃣ $NPC is more than just a memecoin 🧠
It's the first memecoin to be actually backed by a picture of the meme. Every NPC is convertible 1:1 into an NFT of the NPC meme. It's the first memecoin-NFT hybrid or "meme-fungible token" (MFT).
Use npc.com/transform to convert between the two forms
3️⃣ $NPC is endlessly customizable 🛠️
Every NPC is your canvas to become unique and special. You can make your own creations via app.npc.com
There are enough unique combinations for every. human. on. Earth.
View the minted-out collection on Base: opensea.io/collection/non-pl…
4️⃣ $NPC is memecoins 2.0 ✨
Non-Playable Coin is the next generation of memecoins. We have our own token standard called Mediacoins.
An easy way to deploy viral moments, music, and other forms of media and internet culture as a coin.
All open source. For the builders. Check it out: npc.com/mediacoins
5️⃣ $NPC is one of the most viral memes of all time 📈
First starting as a meme in 2018, NPC is one of the most popular memes EVER. With tens of billions of views across TikTok, YouTube, and more, everybody knows the NPC meme.
Do you support the current coin? •⎳•
191
416
1,539
480,146
Le Pat retweeted

4 Dec 2024
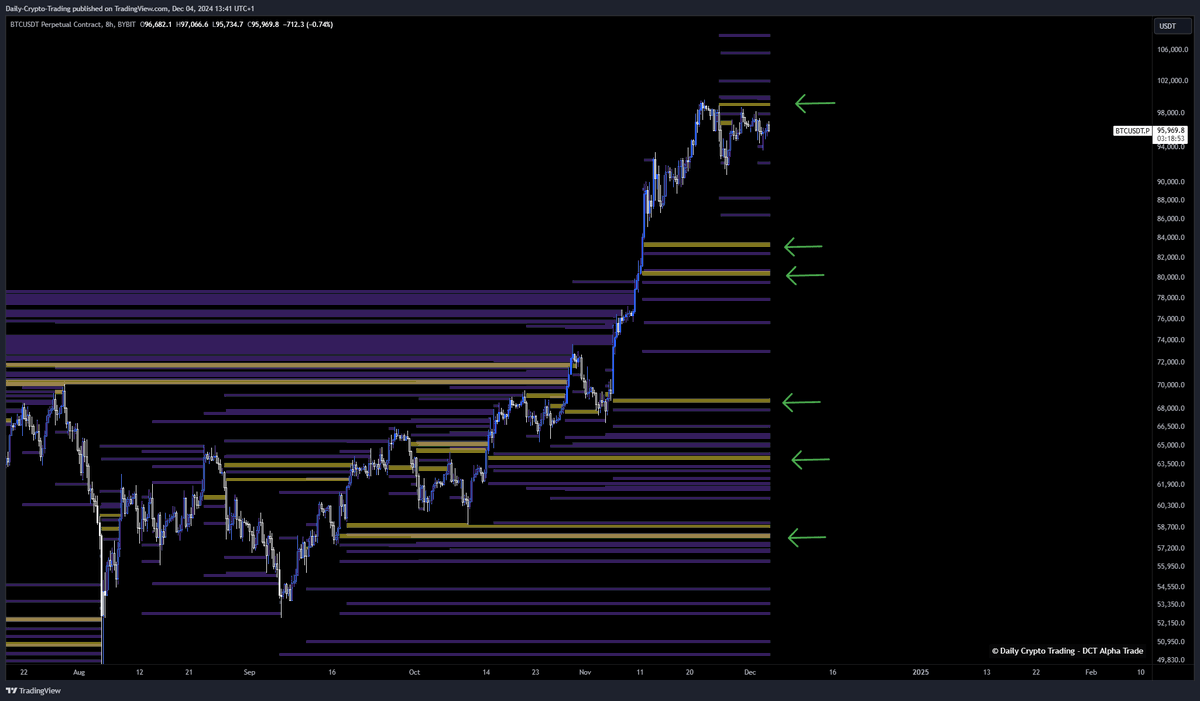
🚨 Urgent: $BTC Top Imminent – Brace for a Blow-Off Top! 🚨
We have accurately predicted every target since 2023, and I have been clear that after reaching $100k , we would be approaching a top. Now, after more than a year, we are finally here. We have nailed BTC targets at $43k, $50k, $60k, $73k, $48k, $82k, $89k, and $99k🎯. Nothing has changed in my long-term TA, and just because we reached my goal from $30k to almost $100k, I am not going to change my TA due to shifting sentiment. I remain true to my analysis until it is invalidated. This TA will show you the invalidation points and some of the last targets before a final drop.
I understand there will be people who will insult me or call me names, but I do not care about them. I care about my community. Remember, I do not get paid for sharing these free insights; they are my own opinions. Most so-called influencers are not traders and will brainwash you to have one bias while selling their VIP groups or shilling their tokens, which they get paid to do. In this channel, we never had one bias; we had different scenarios with different probabilities, and we have nailed every target as mentioned. Now, the final blow is nearing. Ask yourself why I went from super bullish to bearish now? While everyone else was calling for a $60k top, we were targeting $100k . Everyone who followed me knew my target. I have not changed my stance; I always showed you the bullish target and the bearish scenario and was very clear that once we went from $30k to $100k , we were nearing the top. This should not take you by surprise. See every TA I posted.
Before diving in, I’d appreciate your support with likes, reposts, and comments to help grow the channel and keep this content coming. These analyses take time, and your appreciation fuels the drive to keep sharing!
Macro Overview Recap:
If you haven’t already, check out my macro analysis on the inevitable recession. Understanding this is essential before diving into the charts.
Recession:
x.com/DailyCryptoTrad/status…
Warren Buffet's Cash Pile:
x.com/DailyCryptoTrad/status…
Bitcoin Charts Analysis:
Elliott Wave Theory:
My Elliott Wave (EW) analysis has been spot-on since late 2023 and hit all targets. However, I am recounting sub-wave 5 since the structure has changed. We have an impulsive wave 3 which is overextended and losing momentum. This does not mean we cannot reach $100k , but we need to stay cautious. We need our pullback to sub-wave 4 around $75k-$81k to hold (Fibonacci level shows $84k-$80k). Once we complete wave 4, we have our last impulsive wave, meaning there is still some fuel left. We can sometimes form truncated waves, which means wave 4 won’t reach wave 5 or hit the old ATH and make a double top. But if we get a strong wave 5, we could see a 40-50% increase from the $80k level, reaching Fibonacci levels of 3.272 at $113k, 3.414 at $117k, and 3.618 at $121k. This would be the best-case scenario. The invalidation point is if we go over $130k; then, this gets invalidated, and a potential target at $170k can be reached, but we need structure to confirm this first.
Once traditional markets, especially the Nasdaq and S&P 500 tech stocks, correct, Bitcoin is likely to follow, leading to a blow-off top as mentioned. At that point, BTC could drop to $17k-$30k, depending on the peak. This would form a massive ABC corrective pattern with Fibonacci targets at $52k and $31k before finding a bottom. This scenario aligns with a recession-driven market decline.
Invalidation Points:
This scenario could be invalidated if:
1. Markets reset/correct after 1-2 years.
2. Geopolitical tensions or wars are avoided.
3. A recession is avoided.
4. No black swan events occur.
However, if even one of these factors plays out, a market crash becomes highly probable. Be open-minded about these possibilities; ultimately, it is YOUR job to protect your capital.
Weekly Chart:
• Volume: Low volume while price action is increasing – bearish signal.
• RSI: Overbought, showing a bearish divergence since April. This is a high probability given the overbought zone but could be invalidated if RSI reaches 90.
• RSI Stochastic: Overbought but can remain so for up to a month.
• MACD: Bullish momentum but losing its momentum, bullish cross, and lines above 0 are also bullish.
All indicators suggest BTC is gearing up for a blow-off top, but there is still some fuel left.
Daily Chart:
RSI: Consolidating and above 50 – bullish.
RSI Stochastic: Oversold – bullish.
MACD: Bearish momentum, bearish cross, lines above 0 bullish.
Volume: Weak – bearish.
The daily chart suggests a need for consolidation and finding solid support before another move up. A retracement is likely, aligning with our Elliott Wave (sub-Wave 4) expectation. We are getting overextended.
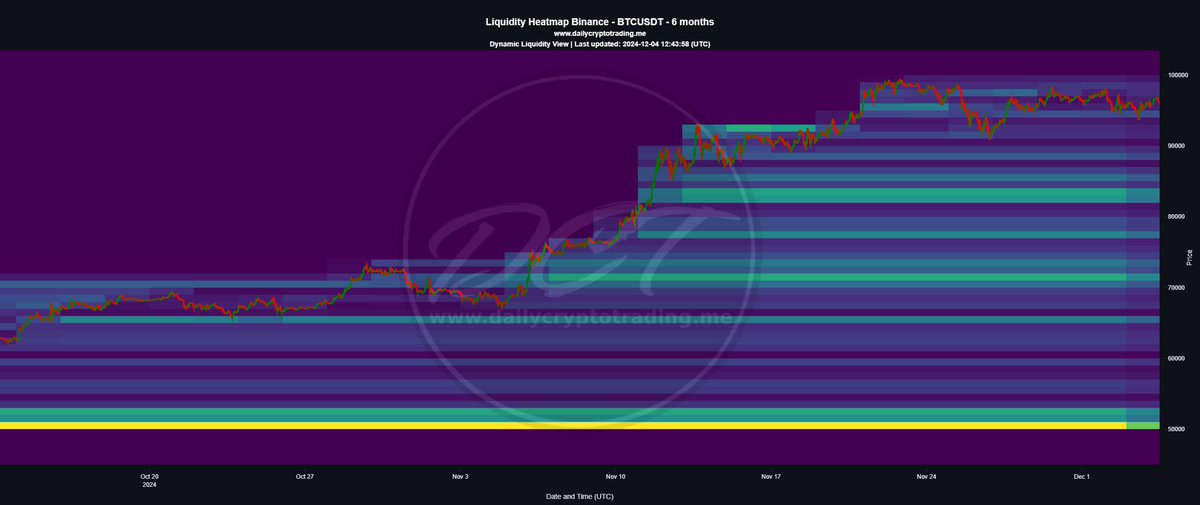
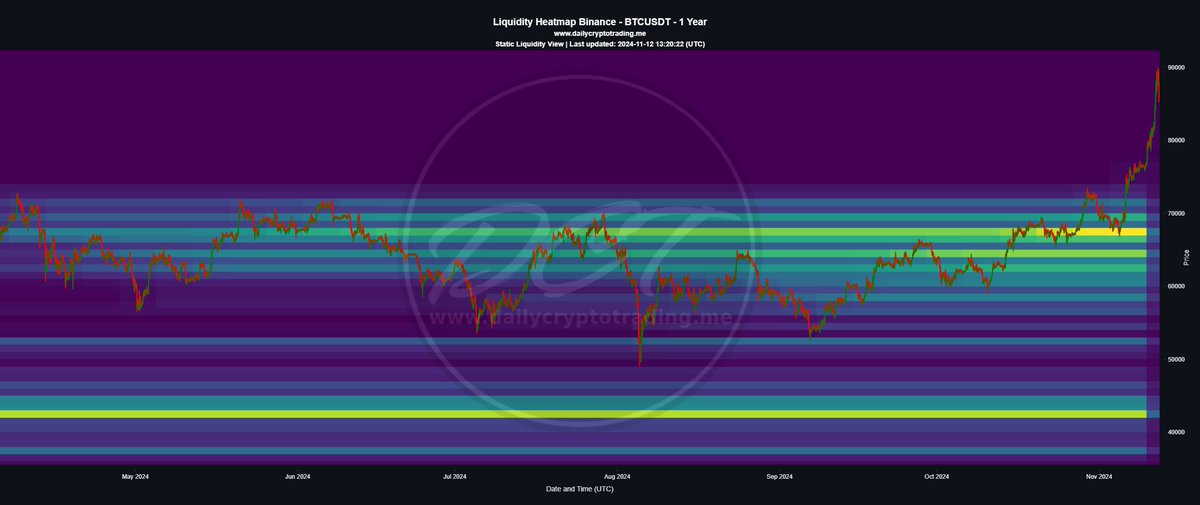
Liquidity and Liquidation Heatmap Insights:
Our liquidity and liquidation heatmaps on TradingView reinforce this outlook, showing significant liquidity pools aligning with our targets. Access the same tools at Daily Crypto Trading.
Conclusion:
Based on my analysis, I firmly believe that BTC is approaching a top, with a likely range of $100k-$120k, especially if the Nasdaq and S&P 500 also peak. This outlook has been consistent since late 2023 and is supported by our Elliott Wave analysis and broader market trends.
However, several factors could disrupt this trajectory:
• Recession: As previously discussed, an economic downturn could align with a traditional market correction, significantly impacting BTC.
• Geopolitical Changes: Major shifts in global politics could introduce volatility, affecting market sentiment and BTC's price.
• Black Swan Events: Unforeseen events can always change market outcomes, as seen in past sudden market shifts.
• Market Shifts: Significant moves in traditional markets, such as those driven by geopolitical tensions or policy changes, could impact BTC.
if we avoid these factors, BTC has the potential to reach as high as $170k, as indicated by our Elliott Wave projections. The strong correlation between BTC and the tech sector suggests that a blow-off top is likely, especially with the current market boost from the "Trump Pump" driven by election cycles. However, potential trade wars or rate cuts could complicate this scenario.
In summary, while BTC could reach new highs, managing risk is crucial. The market is full of probabilities, not certainties. Although our targets have been accurate so far, future outcomes are never guaranteed. This analysis is meant to guide your understanding, but always verify and strategize based on your own judgment. #bitcoin #recession

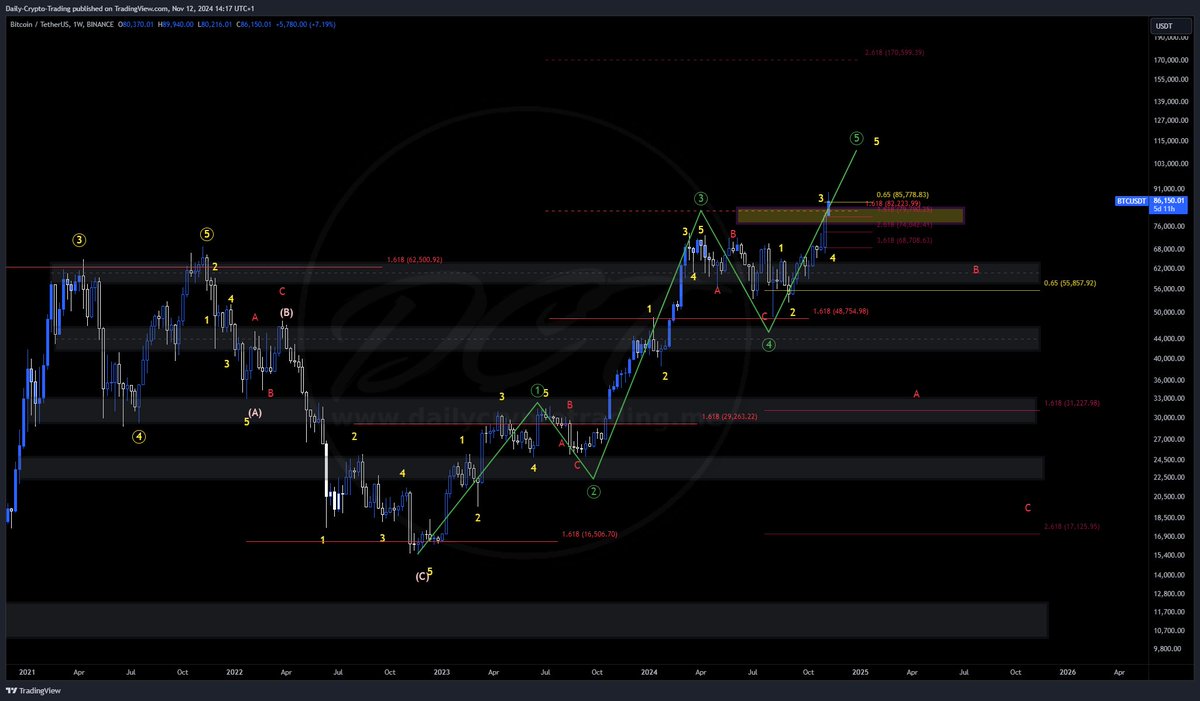
12 Nov 2024

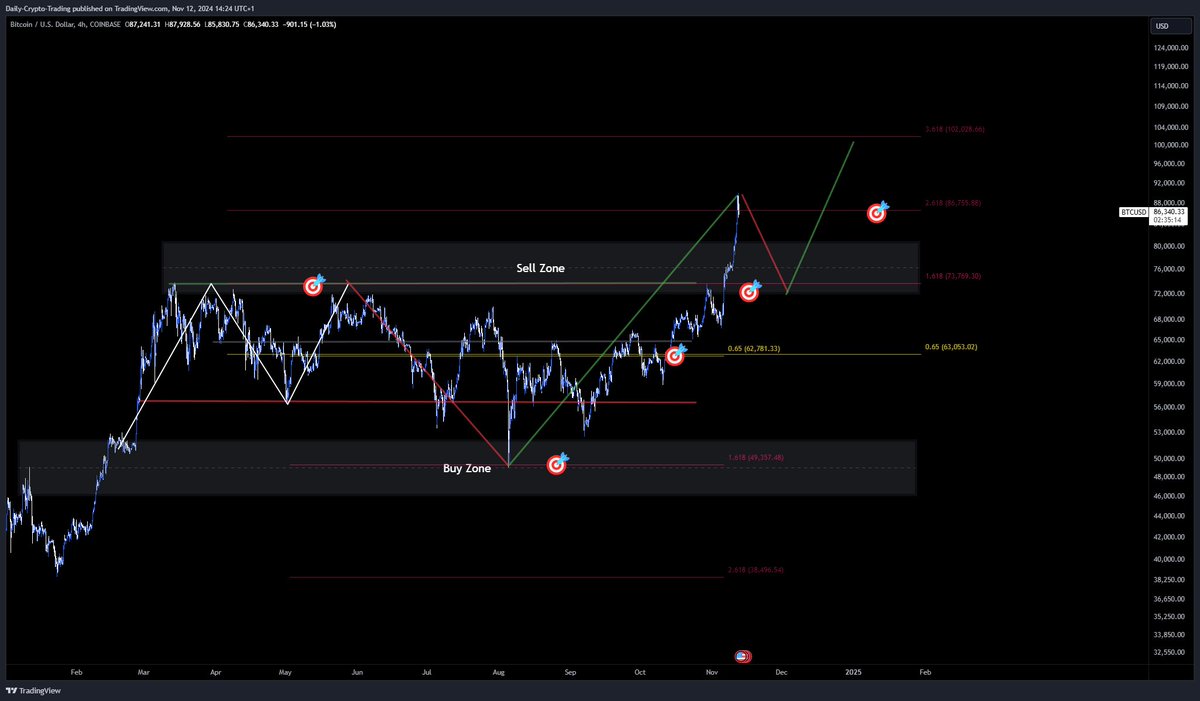
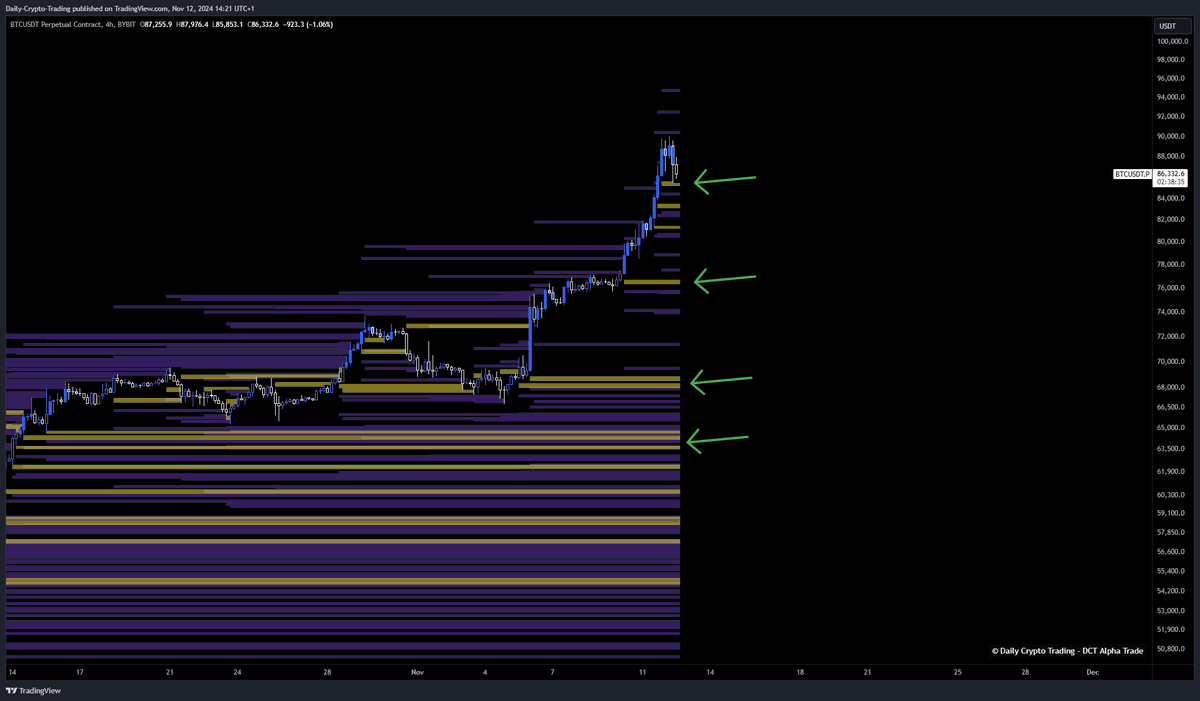
🚨 Blow-Off Top Brewing in $BTC 🚨
We’ve nailed every target since late 2023: $43k, $50k, $60k, $73k, $48k, $82k, and $89k 🎯all hit with precision. Our patience has paid off, and I’m about to share even more valuable insights others won’t, because they want to capitalize on them themselves! This breakdown includes multiple scenarios, my opinions, data, and key invalidation points. 📊
Before diving in, I’d appreciate your support like, repost, and comment to help grow the channel and keep this content coming. These analyses take time, and your appreciation fuels the drive to keep sharing! 🙏
Macro Overview Recap:
If you haven’t already, check out my macro analysis on the inevitable recession. Understanding this is essential before diving into the charts.
Bitcoin Charts Analysis:
Elliott Wave Theory:
Our Elliott Wave (EW) analysis has been spot-on. We completed Wave 4 with an ABC corrective structure and entered a final impulsive wave (Wave 5), initially targeting $82k–$86k, hitting $89k as expected. We’re now meeting resistance around $89k–$90k, and need a sub-corrective wave within Wave 5, likely dipping to $68k–$73k based on Fibonacci levels. Don’t be surprised by a drop to $65k as a brief shakeout before the final pump to complete Wave 5. There’s also potential for BTC to hit $170k based on the 2.618 Fibonacci level we identified last year, though more structure is needed to confirm this.
Once traditional markets, especially the Nasdaq and S&P 500 tech stocks, correct, Bitcoin is likely to follow, leading to a blow-off top. At that point, BTC could drop to $17k–$25k, depending on the peak. This would form a massive ABC corrective pattern with Fibonacci targets at $55k and $31k before finding a bottom. This scenario aligns with a recession-driven market decline.
Invalidation Points:
This scenario could be invalidated if:
1. Markets reset/correct after 1-2 years.
2. Geopolitical tensions or wars are avoided.
3. A recession is avoided.
4. No black swan events occur.
However, if even one of these factors plays out, a market crash becomes highly probable.
Weekly Chart:
• Volume: Medium and consolidating - bullish signals emerging.
• RSI: Overbought, showing a bearish divergence since April. This is a high probability given the overbought zone but could be invalidated if RSI reaches 90.
• RSI Stochastic: Overbought but can remain so for up to a month.
• MACD: Bullish momentum, bullish cross, and lines above 0 are also bullish.
All indicators suggest BTC is gearing up for a blow-off top.
Daily Chart:
• RSI Stochastic: Overbought.
• RSI: Overbought.
• MACD: Bullish momentum, bullish cross, lines above 0 bullish.
• Volume: Strong with an “averaged” pattern.
The daily chart suggests a need for consolidation and finding solid support before another move up. A retracement is likely, aligning with our Elliott Wave (sub-Wave 4) expectation. We are getting over extended.
Liquidity and Liquidation Heatmap Insights:
Our liquidity and liquidation heatmaps on TradingView reinforce this outlook, showing significant liquidity pools aligning with our targets. Access the same tools at dailycryptotrading.me
Conclusion:
I still strongly believe we’re forming a top, though the exact level is hard to predict. Based on our data and analysis, around $100k seems likely if the Nasdaq and S&P 500 also top out. This has been my outlook since late 2023. However, any catalysts like a recession, geopolitical changes, a black swan event, or significant market shifts could alter everything. Without these, BTC could reach as high as $170k at the 2.618 Fibonacci level, as projected in our Elliott Wave analysis from last year.
BTC’s high correlation with the tech sector makes it likely that a blow-off top is in play. We’re seeing the “Trump Pump” now, as election cycles often boost markets. But if Trump imposes tariffs on China and the EU, a trade war could hit the economy hard. Pair this with rate cuts likely to stoke inflation, and the macro picture points strongly toward a blow-off top.
In Short: BTC could reach new highs, but managing risk is crucial. All these are probabilities and not certainties. So while we’ve hit every target so far, nothing is guaranteed. Take this as free educational content to learn from and remember to do your own research! 🔍 #bitcoin #recession
31
52
186
66,533
Le Pat retweeted
25 Nov 2024
🚨 Going to Share What No One Else Will: Why the Rich Get Richer, and the Poor Stay Poor!
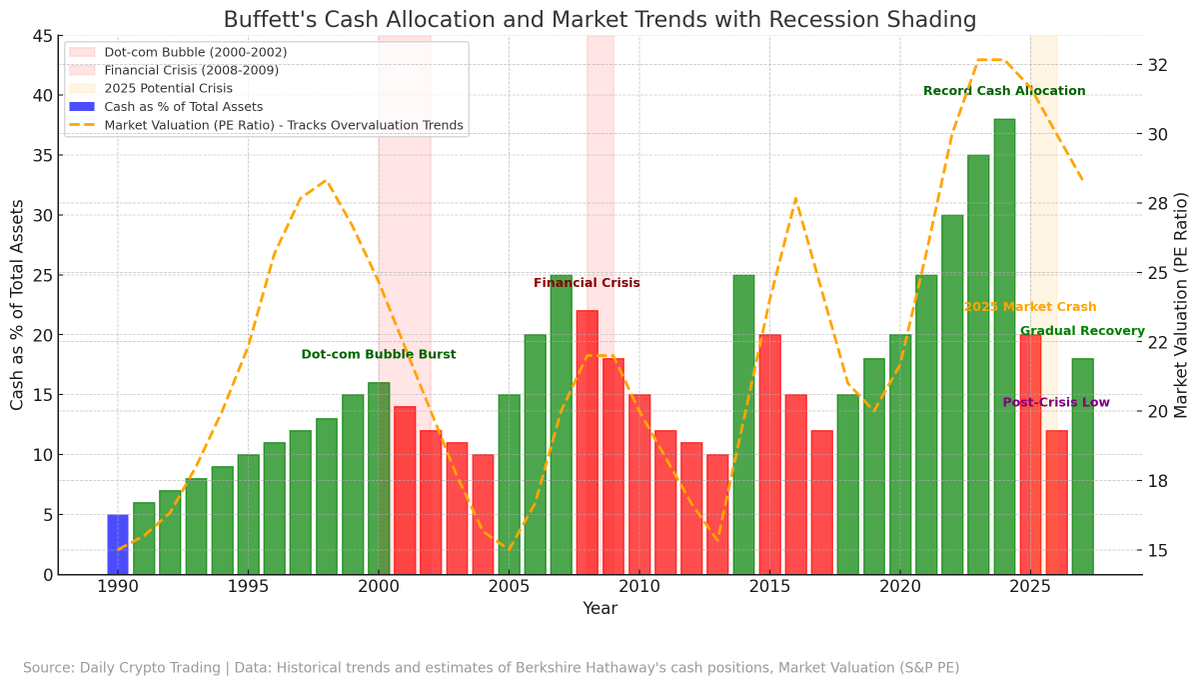
I created this chart to illustrate a pattern that might make you think twice about the markets. These insights are probabilities, not guarantees, so always keep that in mind and do your own due diligence. This is free knowledge, use it wisely!
Let’s dive into something fascinating: Warren Buffett's cash allocation strategy from 1990–2024.
📊 What the Chart Shows:
Before almost every major financial crisis, Buffett sold off his shares when others were euphoric and markets were strong. During downturns, when panic set in, and people ran from the market, he bought shares aggressively. This pattern played out in:
• Dot-com Bubble (2000–2002): Market valuations soared to unsustainable levels, as shown in the P/E ratio spikes. Buffett responded by selling shares ahead of the crash.
• Financial Crisis (2008–2009): Similar P/E ratio trends indicated market overvaluation, prompting Buffett to build up cash reserves before the crash and reinvest in undervalued assets during the recovery.
👉 2025: We’re seeing record-high P/E ratios again. Could this signal another market correction on the horizon?
💰Billions in reserve:
As of Q3 2024, Berkshire Hathaway’s cash reserve hit $325 billion, a 16% increase from its peak during the financial crisis. This is the highest cash allocation Buffett has ever had.
Why This Matters:
Why would one of the richest and smartest investors sell shares (e.g., Apple) during a bull market and a “melt-up”? Why not keep buying when markets are strong?
Buffett’s mantra is clear:
👉 “Be fearful when others are greedy, and greedy when others are fearful.”
Right now, look around you, what does market sentiment scream?
👉 GREED.
The Fear and Greed Index recently hit Greed, reinforcing this sentiment.
What Could This Mean for 2025?
It’s not a guarantee, but there’s a possibility we might see turbulence in 2025–2026. Here’s why:
1. Yield Curve:
• Inverted for over 28 months, the longest in history. This signals prolonged uncertainty and heightened recession risks, even as central banks began cutting rates in September 2024.
2. Corporate Default Rates:
• Defaults are up 7% year-over-year, reflecting the financial stress from 2022–2024’s high rates. Rate cuts haven’t yet eased this stress.
3. Consumer Spending:
• Growth is slowing due to sticky inflation and cautious sentiment. While recent data doesn’t fully show a 3% decline, spending trends are weakening as households feel the pinch.
4. S&P 500 Historical Decline:
• During major crises, the S&P 500 dropped an average of ~45%. The dot-com bubble saw a 49% drop, and the 2008 crash hit 57%. Could we see something similar if 2025’s pressures intensify?
5. Unemployment:
• The unemployment rate rose from 3.4% (April 2023) to 4.3% (July 2024), triggering the Sahm Rule, which historically signals recessions.
6. Debt Crisis:
• The U.S. national debt has surpassed $33 trillion, with debt-to-GDP ratios at historic highs. Rising borrowing costs, combined with fiscal strain, could exacerbate economic instability, adding another layer of risk for 2025–2026
7. Consumer Loan Crisis:
• U.S. consumer credit card debt has exceeded $1 trillion for the first time, reaching $1.14 trillion in mid-2024. Rising interest rates on variable credit are pushing households deeper into debt, creating significant financial strain.
• Delinquencies are already climbing, signaling potential defaults that could ripple across the financial system.
• High consumer debt limits spending capacity, which is critical for economic growth, especially during times of uncertainty.
Final Thoughts:
Does this mean we’re heading for a crash? No one knows for sure, but the probabilities are worth considering. Buffett’s behavior tells us one thing: Patience always wins. Decisions made in fear or greed often lead to failure.
What About $BTC and Crypto?
As I’ve said many times, crypto is highly correlated with the $SPY and NASDAQ, since it’s so tech-heavy. If the bubble bursts, it could drag crypto down with it, unless crypto becomes a true hedge against inflation, which I don’t think it is yet.
So, be prepared. Don’t let greed cloud your judgment in 2025. Stay disciplined, stay informed, and always prioritize patience.
What do you think about this? Let me know your thoughts in the comments!
If you found this valuable, don’t forget to like, share, repost and follow for more insights like this!

24 Nov 2024
Should I drop a new macroeconomic analysis tomorrow? Let me know, hit like, and share your thoughts in the comments! Many don’t want this shared, but I’ll create a visual chart to help you understand why. 🔥📊
19
59
146
37,147
Le Pat retweeted

24 Nov 2024
My first #token review is now online!
Its about $MMM, and the awesome journey they just started. Read it here: defiaddict.com/mmm-magic-min…
@MagicMiniMoney #Solana #memecoin
1
2
3
101
Look at this amazing video!
@MagicMiniMoney to the moon!
$MMM 🧠🚀
23 Nov 2024

🎥 Nfinity Studios Presents: @MagicMiniMoney
When vision meets credibility.
Led by Kristian and Andreas, two established figures whose reputations speak for themselves, Magic Miniature Money redefines what it means to build in Web3.
A project grounded in trust, fueled by innovation, and executed with precision, MMM sets a standard few can match.
At Nfinity Studios, we don’t just produce content—we spotlight the ideas and people shaping the future. With $MMM, we’ve found a story worth telling.
💡 Produced by: Nfinity Studios
🌐 Discover Magic. Discover Money. Discover More.
32